Monday, April 29, 2013

Sell in May?

As we approach the end of April, the inevitable question of seasonality arises. Is it time to sell in May and go away?

While many of my intermediate and long term technical indicators are starting to line up, indicating that it may be prudent to start selling now, I am not seeing the bearish trigger yet. To review, let's consider the charts from the three major regions of the world, US, Europe and China.


What does defensive leadership mean?
In the US, the stock market remains in an uptrend. The SPX, as shown below, remains in an uptrend and it is above both its 50 and 200 day moving average. For traders, it may be premature to get overly bearish without some catalyst or trigger.


The warning signs are there. Defensive sectors have been leading the market. Analysis from Thomson-Reuters shows that the defensive sectors have fared the best in the May-October period during the 21st Century. Is the market is anticipating a downturn or correction?


Consider the chart below of the relative performance of Utilities against the market. The sector appears to be making a saucer shaped relative bottom, which is an indication that the intermediate term outlook for relative performance is positive.


Similarly, look at the relative performance of Consumer Staples. The sector staged a relative upside breakout in late March and remains in a relative uptrend, though it got over-extended and pulled back last week.


As well, take a look at the relative performance chart of Healthcare. Like Consumer Staples, this sector staged a relative upside breakout in March and has also pulled back recently, though the relative breakout remains intact.


Meanwhile, cyclical stocks appear to be rolling over against the market. The chart below of the Morgan Stanley Cyclical Index against the market shows CYC to be failing at a relative resistance level and starting to roll over in relative performance.


The defensive vs. cyclical theme has also played out in the real estate sector. Consider the relative performance of the cyclically oriented homebuilding group, which was on a tear for all of last year, but it is now consolidating sideways after violating a relative uptrend.


By contrast, the chart below of the relative performance of the more defensively and yield oriented REITs against the market shows that this group staged a relative upside breakout in early April, pulled back but the relative breakout remains intact.


Premature to go short
Is it time to get bearish and get short the market? Not yet. I consider the US market to be at a crossroad. The rally last week was led by an oversold bounce in gold and other resource sectors. As the chart below shows, gold has rallied to mostly fill the gap from its recent freefall. We now need to watch if there is any follow through or if gold (and the stock market/risk-on trade) can continue upwards from here.


Another bearish setup has been the relative performance of stocks to Treasuries. As the relative performance chart below shows, stocks remain in a minor relative downtrend to bonds after breaking down from a recent relative uptrend.


In addition, the longer term chart of the 10-year yield shows that bond yields remain in a downtrend and the recent uptick looks like a flag pattern, which is a continuation pattern indicating that bond yields are likely to fall further. As well, David Rosenberg (via Pragmatic Capitalism) indicated that recent sentiment polls showed that there were virtually no bond bulls around. If bond yields fall (and bonds therefore rally), it would likely be bearish for stocks.


However, stocks continue to grind upward because of its fundamental underpinnings of positive earnings momentum. Earnings Season is coming roughly in line with historical experience. Thomson-Reuters reports that with about 20% of the SPX companies reporting, 67% of the companies have beaten earnings expectations, which is in line with the historical experience, but only 44% have beaten on revnues. Nevertheless, Ed Yardeni pointed out that  forward earnings estimates are still rising - which should support the bullish impulse in stocks.


To get more bearish on US equities, I would like to see some combination of:
  • Earnings getting revised downwards, or more misses in earnings reports;
  • More misses in the high frequency economic releases, e.g. New Deal Democrat pointed out that much of the miss in last Friday's GDP report was attributable to a fall in government spending;
  • Major averages to decline below their 50 dma; and
  • Failure of cyclical sectors to regain their leadership and defensive sectors to outperform.

Europe: Waiting for the ECB?
Moving across the Atlantic, the pattern of the European bourses bear an uncanny resemblance to the American one. Despite the well publicized problems in the eurozone, European stocks remain in an uptrend. The chart below of the STOXX 600 shows the index to be above its 50 and 200 day moving averages, though there is some work for the bulls to do as the index is approaching overhead resistance.


As well, I pointed out last week (see Commodity weakness is likely localized) that peripheral country markets were outperforming the core European markets even as stocks declined. This is evidence of rising risk appetites in Europe.

It appears that the market is expecting further stimulus from the European Central Bank this week. Recent economic releases have been so weak, so bad that they're good. Conditions have weakened to the extent that the ECB may be forced to take further action to stimulate the eurozone economies. As Benn Steill and Dinah Walker of the Council on Foreign Relations pointed out, a rate cut is not necessarily a done deal as it may run counter to the ECB's price stability mandate:
In those Eurozone countries where the monetary transmission mechanism is still working normally—Austria, Finland, France, Germany, and the Netherlands—the GDP-weighted-average inflation rate is 1.8%, right near the ECB’s target. France, with 1.1% inflation and 10.8% unemployment, would appear a strong candidate for a rate cut, but not the others. Germany has 1.8% inflation and only 5.4% unemployment. The other three all have above-target inflation rates: Austria at 2.4%, Finland 2.5%, and the Netherlands 3.2%. Austrian unemployment is low, at 4.8%. Dutch unemployment is a moderate 6.4% Only Finnish unemployment is high, at 8.2%.


Some will argue that a bout of robust inflation in the north is just what is needed to restore competitiveness in the south. But the ECB will have to willfully ignore its price-stability mandate if it is to justify a rate cut right now, and it will almost certainly need to apply more radical tools if it is to aid the south quickly. “The ECB is obviously in a difficult position,” German Chancellor Angela Merkel said on April 25. “For Germany, it would actually have to raise rates slightly at the moment, but for other countries it would have to do even more for more liquidity to be made available and especially for liquidity to reach corporate financing.”
In Europe, my bearish triggers are a combination of watching for:
  • Peripheral market underperformance
  • A possible negative reaction to ECB action. Assuming that there is a rate cut, could the market buying the rumor and selling the news?

China: Markets shrugging off weakness
In China, most of the recent economic releases have been below Street expectations. What's more worrying are indications that the new leadership is more concerned about financial system stabililty than growth (via Kate Mackenzie of FT Alphaville):

The official Xinhua report is here and its headline suggests some worry at the economic growth rate. “China needs to cement its domestic economic growth momentum and guard against potential risks in financial sectors,” seems to be the key line, from the third paragraph, although it goes on to point out that Q1′s 7.7 per cent growth that had many China watchers worried was in fact higher than the 7.5 per cent official target.

Then there’s this:
While focusing on improving the quality and efficiency of economic development, the country should keep a proactive fiscal policy and prudent monetary policy while making them more targeted, it said.
Hmm… more targeted

Bloomberg’s take is here and they’ve also noted that the official statement focused on risks despite the slowdown; they also point out the emphasis on boosting the consumption (ie, rebalancing the economy; which as we’ve outlined before, can’t really happen unless growth slows).
Translation: Don't expect more stimulus measures if the economy slows further. Despite these concerns, the markets have shrugged off signs of Chinese weakness. A good measure is the relative performance of the Australian stock market (EWA) to MSCI All-Country World Index (ACWI) as most of Australia's raw material exports go to China. EWA remains in a relative uptrend against ACWI, though there was a recent minor violation of the relative uptrend:


Another key indicator that I have been watching is the AUDCAD currency cross. Both Australia and Canada are resource-based economies, but Australia is more sensitive to Chinese growth while Canada is more sensitive to American growth. The AUDCAD violated an uptrend that began last October on Friday, but I would like to see some further weakness to confirm that this trend violation is not a minor one as we saw in the above chart of EWA against ACWI.


Investor or trader?
Let's go back to the original question, is it time to sell in May?

My inner investor thinks that it may be prudent to trim back some equity holdings, but my inner trader says, "Not yet." He is still waiting for a bearish trigger. I became a reluctant bull in late March (see An uncomfortable bull). Even though my Trend Model turned neutral briefly two weeks ago, it flipped back to risk-on last week and I am still inclined to give the bull case the benefit of the doubt - for now.

My inner trader is still waiting for the aforementioned bearish triggers before getting more defensive.


Cam Hui is a portfolio manager at Qwest Investment Fund Management Ltd. ("Qwest"). This article is prepared by Mr. Hui as an outside business activity. As such, Qwest does not review or approve materials presented herein. The opinions and any recommendations expressed in this blog are those of the author and do not reflect the opinions or recommendations of Qwest.

None of the information or opinions expressed in this blog constitutes a solicitation for the purchase or sale of any security or other instrument. Nothing in this article constitutes investment advice and any recommendations that may be contained herein have not been based upon a consideration of the investment objectives, financial situation or particular needs of any specific recipient. Any purchase or sale activity in any securities or other instrument should be based upon your own analysis and conclusions. Past performance is not indicative of future results. Either Qwest or Mr. Hui may hold or control long or short positions in the securities or instruments mentioned.

Thursday, April 25, 2013

Watching silver for the bottom in gold

In a recent post (see What to do about gold?) I suggested that a tradable bottom for gold may be near, but to wait for some signs of price stabilization:
Personally, I would be inclined to step aside for now and watch how this trade develops. Gold could have great upside potential once it bottoms, but prudence calls for waiting for some signs of stabilization before getting long. I would rather miss the first 10-20% move than lose another 50% should I get long prematurely.
It appears that we are seeing signs of a panic bottom and some signs of stability. The chart of GLD is showing the classic signs of a capitulation bottom:


The same goes for GDX:


As much as my inner trader is itching to jump onto the long side with both feet, a falling silver/gold ratio is flashing a caution signal. The chart below shows the silver/gold ratio as the solid line and the gold price as the candlestick chart. If silver is the high-beta version of gold, i.e. the poor man's gold, why is the silver/gold ratio continuing to fall here?  


In the last couple of instances where gold had bottomed, the silver/gold ratio bottomed at about the same time. Here is the 2008 bottom:


Here is 2004:  


The most charitable explanation that 2013 corresponds to the 2001 gold bottom, where the silver/gold ratio continued to fall. As the gold price stabilized, rallied and then fell back to test the bottom, the silver/gold ratio stabilized, though it was several months late in confirming the start of the secular gold bull.  


The markets in 2011 and 2013 may not be directly comparable. 2001 was the end of a multi-decade secular gold bear market. Today, the price of gold peaked out in late 2012 and fell back below important technical levels after a long bull market.  

Bottom line: We are likely seeing a short-term bottom for gold here. On the other hand, don't be so sure about the intermediate term trend. There may be more downside to come. We'll just have to watch and wait to see how some of these technical patterns resolve themselves.


Cam Hui is a portfolio manager at Qwest Investment Fund Management Ltd. ("Qwest"). This article is prepared by Mr. Hui as an outside business activity. As such, Qwest does not review or approve materials presented herein. The opinions and any recommendations expressed in this blog are those of the author and do not reflect the opinions or recommendations of Qwest.  

None of the information or opinions expressed in this blog constitutes a solicitation for the purchase or sale of any security or other instrument. Nothing in this article constitutes investment advice and any recommendations that may be contained herein have not been based upon a consideration of the investment objectives, financial situation or particular needs of any specific recipient. Any purchase or sale activity in any securities or other instrument should be based upon your own analysis and conclusions. Past performance is not indicative of future results. Either Qwest or Mr. Hui may hold or control long or short positions in the securities or instruments mentioned.

Tuesday, April 23, 2013

Commodity weakness is likely localized

The old Cam would have been freaking out. The first version of my Inflation-Deflation Trend Allocation Model depended solely on commodity prices as the canaries in the coalmine of global growth and inflationary expectations. The chart below of the equal-weighte Continuous Commodity Index is in a well-defined downtrend. The weakness isn't just restricted to gold, but other commodities like oil and copper are all falling.


However, we found with further research that adding global stock prices to commodity prices as indicators gave us a better signal, in addition to giving us a more stable signal.


Equities not confirming weakness
The three axis of global growth are the US, Europe and China. I am finding that signals from all three regions are not really confirming the signals of weakness given by falling commodity prices. Consider, for example, Caterpillar's earnings report yesterday. The company, which is a cyclically sensitive bellwether, reported punk sales, earnings before the opening bell and revised their outlook downwards [emphasis added]:
We have revised our outlook for 2013 to reflect sales and revenues in a range of $57 to $61 billion, with profit per share of about $7.00 at the middle of the sales and revenues outlook range. The previous outlook for 2013 sales and revenues was a range of $60 to $68 billion and profit per share of $7.00 to $9.00.


“What’s happening in our business and in the economy overall is a mixed picture. Conditions in the world economy seem relatively stable, and we continue to expect slow growth in 2013,” said Oberhelman.

“As we began 2013, we were concerned about economic growth in the United States and China and are pleased with the relative stability we have seen so far this year. In the United States, we are encouraged by progress so far and are becoming more optimistic on the housing sector in particular. In China, first quarter economic growth was slightly less than many expected, but in our view, remains consistent with slow growth in the world economy. In fact, our sales in China were higher in the first quarter of 2013 than they were in the first quarter of 2012, and machine inventories in China have declined substantially from a year ago,” said Oberhelman.

“We have three large segments: Construction Industries; Power Systems; and Resource Industries, which is mostly mining. While expectations for Construction Industriesand Power Systems are similar to our previous outlook, our expectations for mining have decreased significantly. Our revised 2013 outlook reflects a sales decline of about 50 percent from 2012 for traditional Cat machines used in mining and a decline of about 15 percent for sales of machines from our Bucyrus acquisition,” said Oberhelman.

In other words, CAT remains upbeat on US housing. China is weak-ish and mining is in the tank. It seems that much of this negative outlook has been discounted by the market. While the stock fell initially, it rallied to finish positively on the day on heavy volume.


For now, the US economy look OK. I agree with New Deal Democrat when he characterized the high frequency economic releases as "lukewarm". We are not seeing gangbusters growth, but there is no indication that the economy is keeling over into recession either. The preliminary scorecard from the current Earnings Season is telling a similar story. The earnings beat rate is roughly in line with the historical average, although the sales beat rate has been somewhat disappointing.


Risk appetite rising in Europe
Across the Atlantic, Europe is mired in recession. However, there is little sign that tail-risk is rising. I have been watching the relative performance of the peripheral markets in the last few days as stocks have weakened. To my surprise, European peripheral markets have been outperforming core Europe, indicating that risk appetite is rising. Here is the relative performance of Greece against the Euro STOXX 50:


Here is Italy:


...and Spain:


Well, you get the idea.


Weakness in China?
What about China? Chinese growth has been a little bit below expectations, such as the March Flash PMI released overnight. Shouldn't weakness in Chinese infrastructure growth would be negative for commodity prices? Isn't that what the commodity price decline is signaling?

Well, sort of. Maybe. We have seen a great deal of financialization of commodities as an asset class. An alternate explanation of commodity weakness is the unwind of the long positions of financial players . Indeed, analysis from Mary Ann Bartels of BoAML shows that large speculators have moved from a net long to a net short position in the components of the CRB Index:


One key gauge I watch of Chinese demand is the Australian/Canadian Dollar cross rate. Both countries are similar in size and both are commodity producers. Australia is more sensitive to Chines growth while Canada is more sensitive to American growth. As the chart below shows, the AUDCAD cross remains in an uptrend in favor of the Aussie Dollar, though it is testing a support region.


In conclusion, the preliminary verdict from the market is that commodity weakness is localized - for now. Barring further weakness in commodity prices and the other indicators that I mentioned, the implication is that US stock market action will be choppy because of the uncertainty caused by commodity weakness and Earnings Season, but any downside will be limited. As the point and figure chart of the SPX below shows, the S+P 500 remains in an uptrend and I am inclined to give the bull case the benefit of the doubt for now.

So relax and chill out.


Cam Hui is a portfolio manager at Qwest Investment Fund Management Ltd. ("Qwest"). This article is prepared by Mr. Hui as an outside business activity. As such, Qwest does not review or approve materials presented herein. The opinions and any recommendations expressed in this blog are those of the author and do not reflect the opinions or recommendations of Qwest.

None of the information or opinions expressed in this blog constitutes a solicitation for the purchase or sale of any security or other instrument. Nothing in this article constitutes investment advice and any recommendations that may be contained herein have not been based upon a consideration of the investment objectives, financial situation or particular needs of any specific recipient. Any purchase or sale activity in any securities or other instrument should be based upon your own analysis and conclusions. Past performance is not indicative of future results. Either Qwest or Mr. Hui may hold or control long or short positions in the securities or instruments mentioned.

Monday, April 22, 2013

My answer to John Hussman

I have the greatest of respect for John Hussman. His weekly commentary has always a must-read for me. So it was with much interest that I watched the video of his speech from the Wine Country Conference (via Mebane Faber).

I came away thinking that while I agree with Hussman's analysis on many fronts, we came away with some very different conclusions - a result that I will explain.


Where I agree with Hussman
If you watch the video, you will see that at the beginning, John Hussman states that he believes that much scarce savings has been squandered. Instead of directing savings towards productive innovation, e.g. robotics, etc., it has gone into financial manipulation (my words, not his) in trying to save the current system.

I completely agree.

Hussman went on to say that QE doesn't work to stimulate long-term sustainable growth. It only serves to drive down interest rates and lower the risk premium, which results in a speculative reach for yield.

I agree.

He went on to outline his 10-year return expectations for stocks. Based on various approaches, he gets an expected return of roughly 3.5%. Indeed, Mark Hulbert highlighted a similar conclusion based on the 3-5 year appreciation potential of stocks from the Value Line Investment Survey.

Hussman 10-year equity return expectations

Unfortunately for the investor, there are no good alternatives in the current QE environment. Expected returns are low for all asset classes.


Hussman called the current environment "An Unstable Equilibrium". In other words, the markets are an accident waiting to happen.

I agree with his analysis. While stocks returns can be relatively benign in the short to medium term, there are at least two major macro tail risks that we have to be concerned about: France (see Short France?) and China (see The canaries in the Chinese coalmine and An update on my Chinese canaries). In other words, the markets can behave for a while and then the roof could suddenly cave in. That's why we have an unstable equilibrium.


Same analysis, different conclusions
What can an investor do under these circumstances? That's where I differ from John Hussman. It appears that Hussman manages his fund primarily based on his 10-year rate of return outlook expectation. If return expectations for all asset classes are low, it makes sense to focus on capital preservation and to go long opportunistically. It's a long-term investment viewpoint, much like the sort adopted by pension fund committees and fiduciaries that I used to speak to in my previous life as an institutional money manager. I understand that point of view completely.

Today, I, along with people like Mebane Faber, believe that we have models that can trade the swings in this market - and there are plenty of swings. In effect, Hussman is saying that we are in a modern day depression - sort of a Japanese Lost Decades-like environment. The economies of the developed world is likely to go through cycles of upswings caused by fiscal and monetary stimulus and declines as the stimulus is withdrawn, largely scarce savings is not being directed at productive investments.

My principal approach is to use my Inflation-Deflation Trend Allocation Model, supplemented by price momentum at the appropriate times. While Hussman's time horizon is measured in years, my time horizon is measured in weeks and months. That's why, despite the poor long-term return expectations, I can be relatively sanguine on the outlook for the stock market. (More on that in a future post.)


Cam Hui is a portfolio manager at Qwest Investment Fund Management Ltd. ("Qwest"). This article is prepared by Mr. Hui as an outside business activity. As such, Qwest does not review or approve materials presented herein. The opinions and any recommendations expressed in this blog are those of the author and do not reflect the opinions or recommendations of Qwest.

None of the information or opinions expressed in this blog constitutes a solicitation for the purchase or sale of any security or other instrument. Nothing in this article constitutes investment advice and any recommendations that may be contained herein have not been based upon a consideration of the investment objectives, financial situation or particular needs of any specific recipient. Any purchase or sale activity in any securities or other instrument should be based upon your own analysis and conclusions. Past performance is not indicative of future results. Either Qwest or Mr. Hui may hold or control long or short positions in the securities or instruments mentioned.

Wednesday, April 17, 2013

What to do about gold?

As gold continues to melt down, I have had a number of discussions with both individual and professional investors about the outlook for the shiny precious metal. Notwithstanding the global conspiracy to suppress the gold price*, here is my view on gold.

First of all, I am relatively agnostic on gold. I am no gold bug, nor am I a permabear on bullion. I do believe that the financialization of gold and other commodity prices has made the precious metal more volatile. No one complained when money poured into GLD and the price was rising, but as Josh Brown aptly put it:


Personally, I think that Bitcoin caused the crash in gold. When Bitcoin, another alternative currency crashed, it created so many margin calls that the effects spilled over into gold**.


The bull and bear case for gold
There is no question that what happened to gold on Monday was what Dennis Gartman termed "a margin clerk market". We saw a disorderly liquidation. Tuesday saw some stabilization. Gold tried to rally but ended up only up slightly on the day - not good.

On a longer term basis, the chart below of the gold to SPX ratio shows that this relationship is testing a long-term relative support zone. Under such panic conditions, we may see a decent bounce.


In addition, there may be some fundamental underpinings for a bottom in gold equities. The dividend yield on the junior gold miner ETF GDXJ is 4.5% according to Yahoo! Finance and 6.2% according to Bloomberg. (Given how quickly the dividend has fallen, I am not sure how real that yield is, though.)


The bear case
While I recognize that gold is off-the-charts oversold, I worry that a significant bottom may not be in place because investor psychology hasn't gotten bearish enough. I have heard anecdotal evidence that people are lined up at the local bullion dealer to buy gold bullion and bars - which is contrarian bearish and an indication that Joe Public hasn't given up on the precious metal yet. (Can anyone else confirm that? Addendum: ZeroHedge reports that physical buyers are out in droves in Australia, China and Japan.)

As well, Bloomberg reports that Indians, who are a large source of physical demand, are still buying:
Gold buyers in India, the world’s biggest consumer, are flocking to stores to buy jewelry and coins, betting a selloff that plunged bullion to a two-year low may be overdone.

“My daughter is just six months old, but I think it is never too early to buy gold,” said Sharmila Shirodkar, a 28- year-old housewife, while displaying a new pair of earrings she bought from a store in Mumbai’s Zaveri Bazaar. “I had been asking my husband every day if prices will go down more. I couldn’t wait anymore.”
A durable bottom will not be in place until the small retail buyer capitulates - and these are not signs of capitulation.

As well, I watch the Silver/Gold ratio to measure the level of speculative activity in precious metals. Silver, another precious metal, is considered to be the poor man's gold and the relative Silver/Gold ratio is an important indicator of precious metal risk appetite. As the chart below indicates, this ratio remains in the middle of its historical range and is showing no signs of a washout yet.


Personally, I would be inclined to step aside for now and watch how this trade develops. Gold could have great upside potential once it bottoms, but prudence calls for waiting for some signs of stabilization before getting long. I would rather miss the first 10-20% move than lose another 50% should I get long prematurely.


*  Relax! That's a joke
** Don't take everything I say so seriously!


Cam Hui is a portfolio manager at Qwest Investment Fund Management Ltd. ("Qwest"). This article is prepared by Mr. Hui as an outside business activity. As such, Qwest does not review or approve materials presented herein. The opinions and any recommendations expressed in this blog are those of the author and do not reflect the opinions or recommendations of Qwest.


None of the information or opinions expressed in this blog constitutes a solicitation for the purchase or sale of any security or other instrument. Nothing in this article constitutes investment advice and any recommendations that may be contained herein have not been based upon a consideration of the investment objectives, financial situation or particular needs of any specific recipient. Any purchase or sale activity in any securities or other instrument should be based upon your own analysis and conclusions. Past performance is not indicative of future results. Either Qwest or Mr. Hui may hold or control long or short positions in the securities or instruments mentioned.

Monday, April 15, 2013

Short France?

I have found that the best trades are ones based on a well-defined fundamental reason combined with a market catalyst. Investors who put on a trade based purely on fundamentals run the risk of being early - and Value investors are a classic example of this tendency. Fundamentals have a way of not mattering to the market until it matters. A much better way to position your portfolio is to wait for the market catalyst by watching the technical conditions of the trade.


A bearish call on France
Consider this article from Charles Gave of Gavekal (via ZeroHedge): France Is On The Brink of A Secondary Depression:


France is engulfed by a political, economic and moral paralysis. The president has record low popularity, unemployment is making new highs and the tax czar of a supposedly left wing government just quit after repeatedly lying about a pile of cash he had stashed in a Swiss bank account. From such a sorry state of affairs, you might think that things could only get only get better. Unfortunately, economic cycles do not work this way and it is my contention that France is about to enter what was known during the gold standard era as a “secondary depression.” The rigid design of the euro system means the whole eurozone is prone to the kind of brutal cyclical adjustments seen in that hard money era of the 19th and early 20th centuries. But having reached the logical limits of its decades long experiment in state-run welfare-capitalism France is far more exposed than even its struggling neighbors.


The article is well worth reading in its entirety, because it lays out the bearish divergence for France against the rest of Europe. There is a French elephant in the eurozone room that no one dares to speak about. While Brussels can manage crisis after crisis in peripheral countries, a blowup in France is too big to contain as the French-German relationship lies at the political heart of the European Union.

Hale Stewart at the Bonddad Blog jumped on the same theme last week when he wrote:
The French ETF is looking more and more like a great short opportunity. As I first noted a little over a week ago, the French economy is in terrible shape: GDP has barely grown for the last 7 quarters, unemployment is rising, industrial production is dropping and the budget and current account deficits are increasing.


Too early to short France
What has been described so far is best characterized as a "trade setup". This is a trade with a strong fundamental backdrop. My inner investor tells me to be wary of France and its effects on Europe, but my inner trader tells me, "Not yet."

These fundamentals have a way of not mattering to the market until it matters. Right now, the market is shrugging off the warning signs. Consider this chart of the relative performance of French equities to eurozone equities below. Relative support seems to have held despite the potential negative news and the CAC is actually rally on a relative basis in the short term.


This may be a case of when it rains, it pours, but you have to wait for the rain. The "rain" to which I refer to is the emergence of a risk-off trade. Right now, there is no sign of that happening. Look at the relative strength of Greek stock to eurozone stocks - it's signaling a risk-on market.


The same could be said of Italy. Look at the relative performance of the MIB against the Euro STOXX 50:


In short, this is a trade setup to be watched. Watch how the fundamentals develop, because you have the time. Should the technicals deteriorate, then you have a great trade with tremendous upside potential - but not today.  

Later this week, I will write about another potential trade setup in a hot topic - gold.


Cam Hui is a portfolio manager at Qwest Investment Fund Management Ltd. ("Qwest"). This article is prepared by Mr. Hui as an outside business activity. As such, Qwest does not review or approve materials presented herein. The opinions and any recommendations expressed in this blog are those of the author and do not reflect the opinions or recommendations of Qwest.

None of the information or opinions expressed in this blog constitutes a solicitation for the purchase or sale of any security or other instrument. Nothing in this article constitutes investment advice and any recommendations that may be contained herein have not been based upon a consideration of the investment objectives, financial situation or particular needs of any specific recipient. Any purchase or sale activity in any securities or other instrument should be based upon your own analysis and conclusions. Past performance is not indicative of future results. Either Qwest or Mr. Hui may hold or control long or short positions in the securities or instruments mentioned.  

Tuesday, April 9, 2013

Why this isn't investment advice

Recently, I have gotten a number of comments like this one from my post You just don't understand Europe:
Cam you were wrong about Europe outperformance relative to US in your prediction for 2013.I am European I know Europe. Don't make mistake of doubling up on your losses.
Some of my readers mistake this blog as investment advice. I draw everyone's attention to the disclaimer that is at the bottom of every blog post, which reads in part [emphasis added]:
None of the information or opinions expressed in this blog constitutes a solicitation for the purchase or sale of any security or other instrument. Nothing in this article constitutes investment advice and any recommendations that may be contained herein have not been based upon a consideration of the investment objectives, financial situation or particular needs of any specific recipient. Any purchase or sale activity in any securities or other instrument should be based upon your own analysis and conclusions. Past performance is not indicative of future results. Either Qwest or Mr. Hui may hold or control long or short positions in the securities or instruments mentioned.

What is an investment process?
You shouldn't use this blog for investment advice. Let me explain. Most investment processes consist of at least the following three steps:
  1. Decide on what to buy and sell.
  2. Decide on how much to buy and sell.
  3. Timing the trade.
As an investment manager, I would add a four step of "review and control", which consists of analyzing past decisions and understanding what went wrong and what went right in order to improve future decisions.

I write this blog as my way of thinking out loud and inviting feedback. Most of what I write relates to step 1. There is little or no discussion of steps 2 or 3. Even if we both agreed that security XYZ is a good idea, I have no idea about your circumstances or your portfolio. I can't tell you how much to buy or whether it is appropriate for you at all.

Moreover, if I advocate entering a position, don't be assured that I will write about my decision to exit the position. Consider this post where I wrote in early December about the market leadership of European stocks and homebuilders (see Some surprising market leaders). Even though I had identified European stocks as market leaders, it didn't mean that I don't have a risk control discipline. The chart below shows the relative performance of the ETFs for Euro STOXX 60 (FEZ) against MSCI All-Country World Index (ACWI):


When the relative trend break occurred in early February, we were out of the trade. I didn't write about it on this blog, nor did I feel any obligation to write about it on this blog.

You can see a similar pattern in the homebuilders of when we exited the position at the relative trend break.


You get what you pay for
The best way to use the content in this investment blog as a source for ideas. But understand that you get what you pay for - and it's not investment advice.

If you do want investment advice, then I need to have an up close and personal relationship with you, where I am getting paid a fee. If you believe, for example, that the fund that I manage is appropriate for you, then I will undergo the four steps that I outlined above.

Otherwise, use my ideas at your own peril.


Cam Hui is a portfolio manager at Qwest Investment Fund Management Ltd. ("Qwest"). This article is prepared by Mr. Hui as an outside business activity. As such, Qwest does not review or approve materials presented herein. The opinions and any recommendations expressed in this blog are those of the author and do not reflect the opinions or recommendations of Qwest.

None of the information or opinions expressed in this blog constitutes a solicitation for the purchase or sale of any security or other instrument. Nothing in this article constitutes investment advice and any recommendations that may be contained herein have not been based upon a consideration of the investment objectives, financial situation or particular needs of any specific recipient. Any purchase or sale activity in any securities or other instrument should be based upon your own analysis and conclusions. Past performance is not indicative of future results. Either Qwest or Mr. Hui may hold or control long or short positions in the securities or instruments mentioned.

Monday, April 8, 2013

A Value rally, or defensive sector rally?

Despite Friday's disappointing Non-Farm Payroll release, I remain relatively constructive on the stock market's outlook for several reasons. First, the market sold off on the open, but rallied into the close - a positive sign.


Second, higher beta parts of the market have been outperforming in spite of the negative news. Consider this chart of the relative performance of small caps against the large caps indicating that the risk-on trade may not be done yet.


The risk-on rebound isn't just confined to the United States. Here is the performance of Greece compared to Europe, which is a key measure of risk aversion:


Here is the relative performance of Italy:


You get the idea.


What about the defensive stock leadership?
The one cautionary sign that I had mentioned last week was the leadership of defensive sectors (see Something's not right about this rally). I was not the only one to notice this effect. David Rosenberg mentioned it last Thursday and the WSJ featured a comment from UBS on the curious leadership behavior:

As the chart from UBS strategist Jonathan Golub shows, the classic defensive sectors, such as health care and consumer staples, led the way during the first three months of the year, while some of the more cyclical sectors, such as energy and tech, lagged near the bottom of the pack.
Defensive leadership or Value leadership?
There may be a more benign explanation for the leadership of defensive sectors. Value stocks have been outperforming Growth stocks since last June. The chart below of the relative performance of the Russell 1000 Value Index against the Russell 1000 Growth Index tells the story.


It just so happens that the Russell 1000 Value Index is overweight the kinds of sectors that have been outperforming, such as Financials and Utilities and the Russell 1000 Growth Index is overweight the sectors that have been lagging, such as the cyclically sensitive Industrials and Technology.

What's more, leadership in Value isn't just a sector effect. A contact of mine at MSCI Barra indicated to me that their factor analysis shows the performance of Value factors like Book to Price and Dividend yield to be outperforming as well. That outperformance was net of industry effects.

Bottom line: The upcoming Earnings Season will give us the best answer to the question of whether the real leadership is defensive stocks, which suggests caution, or Value stocks, which could be neutral to bullish.


Cam Hui is a portfolio manager at Qwest Investment Fund Management Ltd. ("Qwest"). This article is prepared by Mr. Hui as an outside business activity. As such, Qwest does not review or approve materials presented herein. The opinions and any recommendations expressed in this blog are those of the author and do not reflect the opinions or recommendations of Qwest.

None of the information or opinions expressed in this blog constitutes a solicitation for the purchase or sale of any security or other instrument. Nothing in this article constitutes investment advice and any recommendations that may be contained herein have not been based upon a consideration of the investment objectives, financial situation or particular needs of any specific recipient. Any purchase or sale activity in any securities or other instrument should be based upon your own analysis and conclusions. Past performance is not indicative of future results. Either Qwest or Mr. Hui may hold or control long or short positions in the securities or instruments mentioned.

Wednesday, April 3, 2013

A time bomb in the Canadian financials?

In my recent post about the Vancouver property market (see Is the secular bull market in Vancouver RE over?), I speculated out loud that a couple with 200K in annual income and 20% down payment could afford a house in the $1.0-1.2 million range, when Vancouver westside houses that aren't falling apart are trading at $2 million and up. These calculations suggested that the clearing price, in the absence of foreign buyers, would be substantially lower from current levels.

I have since had various discussions with mortgage brokers and realtors that indicated that my $1.0-1.2 million estimate is too low. It was suggested to me that a couple with 200K in annual income and 20% down could afford a $2.0 million home.

At first I couldn't figure out how this could happen. Using a standard mortgage calculator, assuming a 3% mortgage rate for mortgage with a 25 year amortization, I got a monthly payment of $7571, or roughly 91K a year. How could a couple with 200K pre-tax income manage with those kinds of numbers? How would they eat? Even assuming a 2% mortgage rate, I got mortgage payment of 81K a year - still a bit of a stretch for our hypothetical couple with 200K pretax income.


HELOCs to the rescue
After chatting with a couple of realtors, they revealed to me the answer: These people aren't financing their purchases with mortgages. They are financing their entire debt load with Home Equity Lines of Credits (HELOCs), which offer the "flexibility" of being secured, floating rate, interest-only loans!

With an interest only loan, a couple with 200K pretax income and a $1.6 million mortgage HELOC has payments of only $56K a year - which is well within the guideline of 40% of pretax income for housing related costs. Of course, the homeowner has the "flexibility" of paying more than the minimum interest payment each month in order to reduce principal. This financing "innovation" not only gets around the federal government's rules around mortgages, but creates a entire new profit opportunity for lenders.

Also consider the attractiveness of the HELOC business for the lender. These are secured, floating rate demand loans. Current HELOC rates are about 3.5%. Given their near-zero cost of funding, it's a great business (until it isn't). Now lever up those spreads up a "conservative" 20 to 1, imagine the profit potential!

It's a can't lose proposition, right?

For lenders, the HELOC business offers some degree of protection because the lines are secured (depends on your loan-to-asset ratio and how "real" your asset estimates are), floating rate (offloads interest rate risk to the borrower) and because of the demand loan nature of the credit line (just don't shout fire in a crowded theatre). Should the Canadian RE market tank, what happens to these "lucrative" lines of businesses and the "geniuses" who allowed the lending institution to plunge headlong into HELOCs?


An accident waiting to happen
I don't need to go on and on about moral hazard, but Canadians have been taking too much and too long a victory lap about the stability of their financial system. It's little things like the HELOC business in this country that scare me and suggests that there is a time bomb waiting to go off in the Canadian financial system.

For investors, think about the following: Should the Canadian financial system suffer a major hiccup because of a collapse in property prices, what happens to all that money that was chasing dividend yielding stocks, as the common shares of the major banks form a significant portion of the "blue chip" dividend yield universe?


Cam Hui is a portfolio manager at Qwest Investment Fund Management Ltd. ("Qwest"). This article is prepared by Mr. Hui as an outside business activity. As such, Qwest does not review or approve materials presented herein. The opinions and any recommendations expressed in this blog are those of the author and do not reflect the opinions or recommendations of Qwest.

None of the information or opinions expressed in this blog constitutes a solicitation for the purchase or sale of any security or other instrument. Nothing in this article constitutes investment advice and any recommendations that may be contained herein have not been based upon a consideration of the investment objectives, financial situation or particular needs of any specific recipient. Any purchase or sale activity in any securities or other instrument should be based upon your own analysis and conclusions. Past performance is not indicative of future results. Either Qwest or Mr. Hui may hold or control long or short positions in the securities or instruments mentioned.

Monday, April 1, 2013

Something's not right about this rally

OK, so the SPX made a new high. Many of my momentum models are bullish, but my relative strength work (see my previous post on combining momentum with trend following techniques) is making me scratch my head.

To explain, my work based on a paper by a team of researchers at Cass Business School entitled The Trend is Our Friend: Risk Parity, Momentum and Trend Following in Global Asset Allocation suggests that when the market is experiencing an uptrend, you should go for broke and buy the "hot" sectors of the day. On the other hand, when the market is falling, buying the "hot" sectors is a recipe for disaster.


A risk friendly market trend
First of all, my trend following and momentum models is pointing to a risk-on market. Consider the relative returns of SPY (stocks) against IEF (7-10 year Treasuries) below. Unquestionably, we are seeing an uptrend in the risk trade:


The risk-on trade isn't just restricted to stocks vs. bonds. The same effect could be seen in the credit market, where junk bonds are outperforming:


Defensive leadership
Here is what's bothering me. We are obviously seeing an uptrend in the stock market, as evidenced by the new highs. However, sector leadership is gradually shifting away cyclical sectors to defensive sectors and industries. Take a look at what the leadership is today.

The chart below shows the relative returns of Financials (XLF) against the market (SPY). Financials are in a well-defined relative uptrend against the market.


Here are the Transportation stocks, which is a small cyclically oriented industry. These stocks are also in a well-defined relative uptrend.


OK. So far so good. Now here comes the surprises. Look at the relative strength in Healthcare:


...and the turnaround in the relative strength of Utilities:


Commodity cyclicals lagging
I have written that cyclical sectors are displaying a pattern of relative sideways consolidation after an uptrend (see An uncomfortable bull). I won't repeat myself, but you can click on the link and see the charts there.

What's bothering me is that commodity related sectors are lagging badly. Consider the equal-weighted Continuous Commodity Index, which is in a minor downtrend. Though it doesn't seem disastrous and commodity prices have firmed somewhat in the past three weeks, the price action of the commodity complex is not exactly signaling a robust global recovery.


On the other hand, the price action of industrial metals look downright ugly.


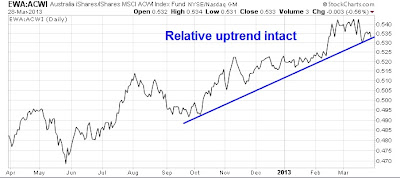
Here are some price relative charts of commodity sensitive stock markets against ACWI, or the MSCI All-Country World Index. Australia looks ok, but it's the exception.


Canada, on the other hand, is in a relative downtrend and has been underperforming since last November.


Here is Brazil. Enough said here:


Here is the relative chart of South Africa (in black), though its relative performance may be linked to the relative performance of gold stocks (in orange):


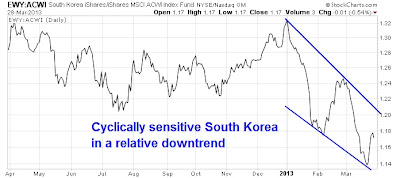
The relative performance of the cyclically sensitive South Korean market is not exactly inspiring either. South Korea remains in a relative downtrend, though it has staged a relative rally in the last week or so.


What's going on?
Frankly, I am puzzled by the nature of the sector leadership when the market is making new highs. My momentum and trend following models are telling to stay long. My relative strength models are telling me to rotate into defensive sectors like Utilities and Healthcare. When I net this all out, I wind up in a fairly neutral position.

Something's not right about this rally. Mohamed El-Arian of Pimco pretty much said the same thing when he indicated that the Markets are sending unusual signals [emphasis added]:
The rally reflects slowly-improving economic conditions, relatively robust corporate profitability and anticipation of stronger domestic and foreign inflows into the equity market. Yet this is far from the whole story.

Investors need only look at where some other benchmarks ended the quarter to get a feel for the unprecedented and artificial nature of today's capital markets.

Few would have predicted that the impressive equity performance would be accompanied by a 10-year U.S. Treasury rate as low as 1.85 percent, a 10-year German government bond (bund) rate as low as 1.29 percent and gold as high as $1,596 an ounce. Think of this as the markets' way to signal to investors some key issues for the quarters ahead.
More on this topic in subsequent posts.


Cam Hui is a portfolio manager at Qwest Investment Fund Management Ltd. ("Qwest"). This article is prepared by Mr. Hui as an outside business activity. As such, Qwest does not review or approve materials presented herein. The opinions and any recommendations expressed in this blog are those of the author and do not reflect the opinions or recommendations of Qwest.

None of the information or opinions expressed in this blog constitutes a solicitation for the purchase or sale of any security or other instrument. Nothing in this article constitutes investment advice and any recommendations that may be contained herein have not been based upon a consideration of the investment objectives, financial situation or particular needs of any specific recipient. Any purchase or sale activity in any securities or other instrument should be based upon your own analysis and conclusions. Past performance is not indicative of future results. Either Qwest or Mr. Hui may hold or control long or short positions in the securities or instruments mentioned.