Monday, September 30, 2013

'Til death do us part? Portfolio edition

In response to my post A Rorschach test for bulls and bears at Seeking Alpha, I saw a couple of important comments. In the article, I made a reference to the analysis of John Hussman, to which a reader wrote that Hussman had a terrible track record, why should anyone listen to him. Another responded that "HSGFX since 11/21/00 is up 61.29%....SPY is up 58.47% (dividends reinvested).....Hussman has had 2 huge bear markets to work with to demonstrate his out performance and yet...."

The more important underlying question at hand is: Hiring a manager, or implementing a model, is like getting married, largely because our lifespans are measured in decades. So when should you get a divorce by getting rid of a manager or model?


Why did you buy it in the first place?
We have all seen the studies about how investors chase performance, over-trade and lose returns. The same is true of fund manager and investment models. Proper portfolio construction calls for proper asset class, style, or model diversification. At any one time, a well-constructed portfolio will have some components that are well performing and others that lag because of uncertainty about the future (see my recent post My Lehman lesson: Model diversification and flexibility).

The proper question to evaluate a strategy or manager who is lagging is, "Is his underlying model broken, or is the evaluation time horizon too short?"

In the case of John Hussman, I agree with his comment:
The problem is that investors constantly abandon effective full-cycle strategies when those strategies encounter their own bear markets, and then pile into other effective (and ineffective) full-cycle strategies at the peaks of their own bull markets. This amounts to investing with no discipline at all.
The value of Hussman's analysis is his long-term forecast of equity returns. For instance, consider his chart of 10-year SP 500 returns compared to the Price to Revenue ratio as shown in his recent commentary entitled Psychological Ether:


Don't just look at the returns and say that a fund manager or an investment model is terrible and therefore it's time for a divorce. Just remember the tenets of diversification. There will always be outperforming managers and models and underperforming managers and models. The time to get rid of one is because you believe that a model is broken, irrespective of recent returns.

In the above example, a good reason to terminate Hussman is to take the position that the Price to Revenue ratio is an inappropriate way to measure equity valuation. The wrong reason to terminate a manager or discard a model is for pure performance reasons.


Contrarian investing is painful
One of the most painful parts of contrarian investing is the psychological pain of going against the crowd and of your instincts to chase recent performance. These principles apply to managers and models as well. David Merkel recently wrote an important post, where he said that there are many valid strategies, but the catch is they don't work all the time:
There are valid theories on investing, and they work on average.  If you pursue them consistently, you will do well. If you pursue them after failure, you can do better still.

How many times have you seen articles on investing entitled “The Death of ____.” (fill in the blank)Strategies trend. There is an underlying kernel of validity; it makes economic sense, and has worked in the past. But any strategy can be overplayed, even my favorite strategy, value investing. My style of value investing tries to adjust for that, but it is not perfect there. (And to tell the truth, September has been a bad month for me, though 2013 has been a very good year.)
To underline Merkel's point about out of favor strategies and managers, Morningstar published an article about how manager performance can turn around:
Would you consider a 10.5% annualized gain a satisfactory investment return for the five years ended Aug. 31, 2013?

Would you believe it if you were told you could have gotten that result from one of the worst-performing and most unpopular large-growth funds of that time period: Fidelity Magellan (FMAGX), which posted an anemic 3% annualized, time-weighted gain and watched investors pull nearly $20 billion out during that span?

Would it further shock you to learn that you could have squeezed that performance from the much maligned Magellan by buying it the same month Lehman Brothers imploded, committing to an automatic investment plan, and then doing next to nothing for the next five years?
With that in mind, I can cite a couple of examples of the kinds of models and strategies that are out of favor and may qualify for the title of the death of _____. As usual, you need to do your own analysis and due diligence before investing.


Managed futures
Consider, for example, this article about managed futures programs:
How bad is this Managed Futures Malaise that we’re talking rain dances and Wilson Philips songs? Pretty bad. The main CTA indices are all at 3.5 year lows and sitting on their worst drawdown levels in the past 15 years – at 28 months and -12% from their past all time highs. And with the year to date numbers negative through August (albeit a small amount), there’s the very real possibility of managed futures postings its 4th losing year out of the past 5 in 2013. What’s more – a comparison of the 10 years prior to 2009 and the period from March 2009 until now shows the asset class at levels not seen decades, in terms of the amount and duration of the losses, reminding us of the ‘generational low’ terminology used by the stock folks circa 2009).

Most managed futures managers use systematic trend following models to derive their returns. When the trend is choppy, these models fail. Are you willing to take the position that the character of markets have changed and they will not be trending anymore? If not, maybe it's time to take the painful contrarian position of putting money in while others are fleeing.


Tactical asset allocation
Another "death of ..." candidate is tactical asset allocation. Recently, the WSJ published an article questioning the value of tactical funds:
There are 41 mutual funds with "tactical" in their names that are tracked by investment-research firm Morningstar Inc., including 18 that were launched since the beginning of 2012. Total assets in this fund category have risen to $4.92 billion from $1.10 billion in December 2007, according to Morningstar.

Just as the so-called market-timing funds did years ago, the tactical funds are underperforming balanced portfolios: On average, they gained 6.9% over 12 months and 7.7% annually over three years through Aug. 31. A classically balanced, passively managed portfolio--with 60% invested in the SP 500 index and 40% invested in the Barclays U.S. Aggregate Bond Index--would have gained 10.2% and 12.1%, respectively, in the same periods, Morningstar said.
Josh Brown chimed in [emphasis added]:
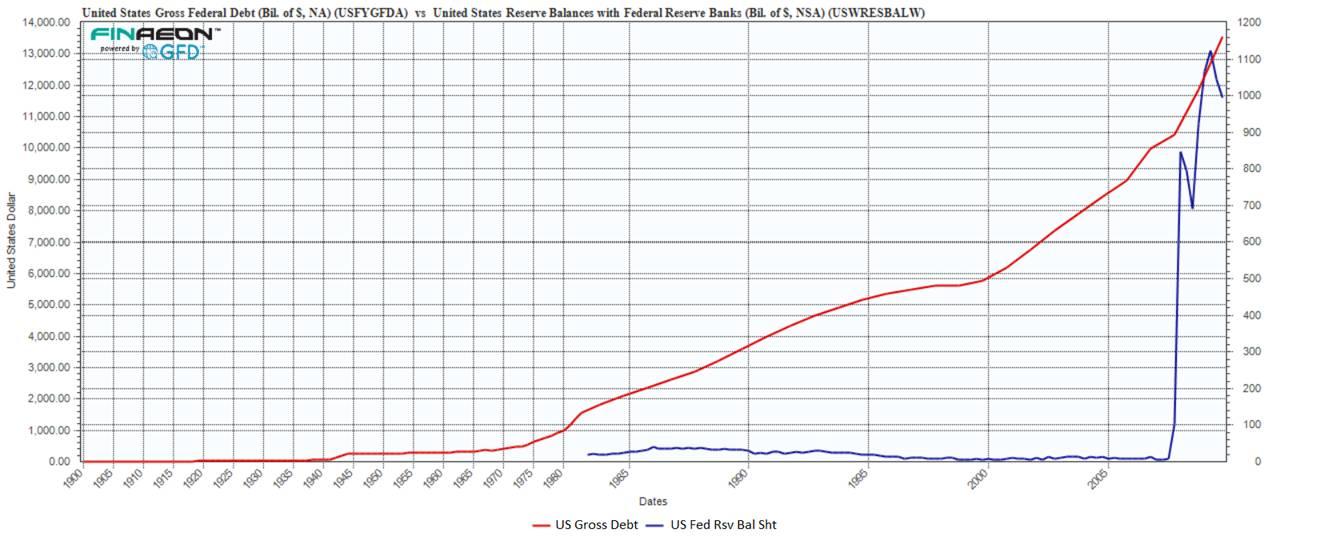
Unfortunately, investors (and their advisors) are now finding out that there is a price to be paid, a cost for this tactical "insurance" being added to the mix: In a bull market, it can easily be a drag. And if you pick a really poor manager, or a quantitative strategy with signals that no longer work, it can actually lose you money. And, even if they work great, they can be expensive (turnover, taxes, internal fees, sales loads) - more expensive, sometimes, than the drawdowns they claim to be protecting you from.
Tactical asset allocation strategies are of little value if the stock market just goes up, as it has largely done since the Lehman Crisis shown in the chart below.


Here's a history lesson: A lot of money got allocated to these kinds of strategies in the wake of the Crash of 1987, but evaporated in the secular bull market of the 1990's. Brown added that he expects that as funds get withdrawn from this class of strategy, the protection that they offer won't be there when it's needed the most:
With tactical funds now adding more drag than performance over the three year period relative to the most vanilla benchmarks available, I fully expect to see the trend toward tactical strategies on the wane in the coming year. And then, just when they're needed most, no one will own them.

Rinse and repeat.
The key issue for investors invested in tactical asset allocation strategies is whether you believe that stocks are embarked in a secular bull market like the 1990's, or more likely to remain range-bound, as stocks did during the 1966-1982 period. I've made my position quite clear on this point (see A new secular bull? Don't count on it).

The moral of this story is, know why you bought into the strategy, fund manager, or investment model in the first place. Just remember the Morningstar cautionary tale about Fidelity Magellan - managers and strategies can turn around unexpectedly. Unless you believe the premise underlying the investment model is broken, arguably you should be a good contrarian investors with a rebalancing strategy - take funds away from top performers and add them to lagging performers.


Cam Hui is a portfolio manager at Qwest Investment Fund Management Ltd. (“Qwest”). The opinions and any recommendations expressed in the blog are those of the author and do not reflect the opinions and recommendations of Qwest. Qwest reviews Mr. Hui’s blog to ensure it is connected with Mr. Hui’s obligation to deal fairly, honestly and in good faith with the blog’s readers.”

None of the information or opinions expressed in this blog constitutes a solicitation for the purchase or sale of any security or other instrument. Nothing in this blog constitutes investment advice and any recommendations that may be contained herein have not been based upon a consideration of the investment objectives, financial situation or particular needs of any specific recipient. Any purchase or sale activity in any securities or other instrument should be based upon your own analysis and conclusions. Past performance is not indicative of future results. Either Qwest or I may hold or control long or short positions in the securities or instruments mentioned.

Sunday, September 29, 2013

Government shutdown! Time to sell?

As I write these words, ES futures are deeply red and it seems that we are on track for a shutdown of the US government. Is it time to get more cautious? Looking out over the next few weeks, I can't get overly excited about the drama in Washington, here's why:

The big question for traders is, did the SPX stage a false breakout or is this more of a classic breakout and pullback technical test?


I tend to think that the latter case is the more likely one. Consider the Russell 2000 small caps, whose upside breakout has held above its resistance turned support level:


Cyclical stocks, as measured by the Morgan Stanley Cyclical Index, has staged an upside relative breakout and that breakout has also held up well. This is an indication of an improving global economy.


Across the Atlantic, the STOXX 600 also staged an upside breakout to new recovery highs. While that index has pulled back a bit, the breakout also held above its resistance turned support level after the German election of September 22.


My favorite indicator of Chinese strength is the AUDCAD currency cross, as both are resource economies but Australia is more sensitive to China while Canada is more sensitive to US growth. The AUDCAD rate broke out of a downtrend in early August and it remains in a minor uptrend, indicating strength in China's economy.


Near-term political risks
The fly in the ointment is the impasse in Washington. I don't have a lot to add to the analysis, but I'll quote a couple of people that I have much respect for. Anatole Kaletsky recently wrote (see Why markets don't fear a government shutdown) that a deal will eventually be made despite all the posturing, that's because the political landscape changed in 2012 [emphasis added]:
First and foremost, the 2012 election decisively shifted Washington’s balance of power, not only by providing President Obama with a new democratic mandate, but also by transforming the political incentives for both sides. Until last November, Obama risked losing his bid for re-election if fiscal gridlock damaged the economic recovery. The Republicans, by contrast, could hope to benefit from any setbacks to economic growth. Now, the tables are turned. Obama will never again face voters and so can afford to risk a budgetary confrontation. Republican congressmen, on the other hand, stand to lose their own seats and their party’s control of Congress by overplaying their hand, especially when opinion polls suggest that Republicans will be blamed if a budget breakdown damages growth or triggers a setback on Wall Street.
Kaletsky believes that the GOP hardliners hold a weak political hand:
[T]he big spending reductions implemented since the 2011 budget crisis have left little scope for further significant reductions in discretionary spending. Fiscal conservatives now recognize that the only programs large enough to transform the budgetary outlook are Social Security, Medicare and Defense — but these programs tend to be strongly supported by elderly and conservative voters.

That, in turn, implies a fourth political transformation. The Republicans are no longer trying to extract major spending reductions in exchange for their budgetary votes. Whereas previously, Republican leadership insisted that any increase in the debt ceiling must be matched dollar for dollar by public spending cuts, this “Boehner Rule” has been quietly dropped. Instead, Republicans are now using budget votes to advance a political cause, the abolition of Obamacare, which is purely symbolic because it offers no scope for compromise with the president and therefore no chance of enactment.
While Kaletsky was wrong in that he did not believe that a government shutdown would occur, his conclusions remain valid:
In sum, the fiscal uncertainty in Washington is almost over — and once the gridlock is broken, the U.S. economy and financial markets could jump back to life like a coiled spring. Remember what happened last January after the fiscal cliff was resolved.
Jeff Miller had a similar take, though it suggests that markets may experience some near-term volatility:
Here is my current working hypothesis:

1.The shutdown will occur, with most scoffing at the effects;
2.Complaints will start to build;
3.Regardless of who wins the blame game, a continuing resolution will be passed;
4.The timing may stretch into the anticipation of a default on debt;
5.Consumers, foreigners, and markets may lose confidence if the debt ceiling deadline is approached; (See the FT's Take)
6.There is little incentive for politicians to resolve this issue early, and some incentive (posturing for constituent groups) to wait until the last minute;
7.The government shutdown may actually encourage an earlier resolution to the debt ceiling issue; (See Ezra Klein's take)
8.Investors have seen the story before, and might not react as violently; and finally 9.The U.S. will not default on its debt. This mainly rests on the understanding of the consequences by business leaders, who will lean on mainstream Republicans if the issue gets close. See this summary.

There are many points in this chain, and each one is open to debate. I emphasize the importance of understanding the limits of forecasts, so we must all realize that this is a fluid situation.

Where are the bearish catalysts?
In the meantime, we have signs of a cyclical upturn globally and an accomodative Fed. These are the signs of a sweet spot for equity returns. Tactically speaking, this study shows that while stocks tend to fall during past government shutdowns, they rallied strongly afterwards.

Longer term, however, I do worry about signs of excessive valuation for the stock market (see A new secular bull? Don't count on it).

In order for stocks to go down, you need a catalyst. For now, fundamental and technical momentum remains positive. Here are the questions that I continually ask myself:
  1. How are Street earnings behaving? Answer: Brian Gilmartin reports that forward 12 month earnings estimates fell last week. However, they had been steadily advancing for the previous few weeks. We'll have to see if the latest downtick is a blip or the start of a downtrend.
  2. Are there any signs of an economic downturn? Answer: Not really.
  3. Is the Fed becoming less accommodative? Answer: No.
Until we see some macro event that derails the market, or the American consumer, who has been an engine of global growth and whose strength continues to surprise me, start to slow, the path of least resistance for stocks is up and I would view shutdown related weakness as an opportunity to add to equity positions.


Cam Hui is a portfolio manager at Qwest Investment Fund Management Ltd. (“Qwest”). The opinions and any recommendations expressed in the blog are those of the author and do not reflect the opinions and recommendations of Qwest. Qwest reviews Mr. Hui’s blog to ensure it is connected with Mr. Hui’s obligation to deal fairly, honestly and in good faith with the blog’s readers.”

None of the information or opinions expressed in this blog constitutes a solicitation for the purchase or sale of any security or other instrument. Nothing in this blog constitutes investment advice and any recommendations that may be contained herein have not been based upon a consideration of the investment objectives, financial situation or particular needs of any specific recipient. Any purchase or sale activity in any securities or other instrument should be based upon your own analysis and conclusions. Past performance is not indicative of future results. Either Qwest or I may hold or control long or short positions in the securities or instruments mentioned.

Thursday, September 26, 2013

A Rorschach test for bulls and bears

Earlier this week John Murphy at stockcharts.com wrote about the gold/copper ratio as a measure of how Mr. Market is perceiving macro-economic sentiment and momentum::
Gold is bought in times of financial stress when stocks are in trouble. Copper is bought when economic conditions are better and stock prices are rising. The gold/copper ratio tells whether investors are optimistic or pessimistic. The fact that the ratio has been falling over the last two years suggests more optimism on the economy and stock market. A stronger global economy supports the price of copper, and diminishes the appeal of gold.
He overlaid a chart of the SPX against the gold/copper ratio. In my analysis below, I inverted the ratio to copper/gold (optimism/pessimism, in red) against a chart of the SPY (stocks) against AGG (bonds) as a measure of risk appetite (in grey):


This chart presents a Rorschach inkblot test for both bulls and bears alike. Do you focus on the enormous gap between the SPY/AGG ratio against the copper/gold ratio and interpret it as stocks have run too far too fast? Or do you focus on the uptrend in the copper/gold ratio as a sign of positive momentum in global macro economic conditions, with the belief that it is the direction of the copper/gold ratio that matters and not the magnitude of the move?

I can argue both sides. My inner investor tells me to focus on the gap, as stocks appear to be overextended against bonds. My inner trader, on the other hand, tells me to stay with the momentum until we see signs that the copper/gold ratio starts to roll over.


John Hussman: Bull and bear
Even the perennially cautious John Hussman agrees. In his latest commentary, He remains highly cautious [emphasis added]:
The challenge at present is that last week’s Fed’s decision does make an already precarious situation more precarious. So the question is how to respond. From the experience of the past few years, the risk is that enthusiasm that the Fed is “all-in” could prompt a surge of further speculation, and even greater financial distortions. At the same time, examining market cycles over a century of market history, present conditions cluster among the most negative 2-3% of data points in terms of average return and downside risk.
However, he is allowing for the possibility of what he terms "a speculative blowoff":
My impression is this. Based on numerous past speculative episodes in the financial markets, we know that financial bubbles have often proceeded in an oscillating pattern featuring increasingly frequent cycles of advance, punctuated by gradually shallower declines reflecting an accelerating eagerness to buy dips. This can produce what Didier Sornette has called “log-periodic” oscillations (see Increasingly Immediate Impulses to Buy the Dip). Given the negative return/risk estimates we observed in April and early-May, I believed that this series of oscillations was ending several months ago. In order to preserve a log-periodic pattern, further oscillations needed to exhibit an even faster alternation between steeply-sloped advances and shallow declines. Yet despite the strongly negative return/risk estimates we already had in April and May, this is unfortunately what has unfolded. With the Fed’s decision last week, we can’t rule out one particularly extreme version of a log-periodic bubble that is consistent with price fluctuations to date. That version is pictured below, and would comprise an advance above 1800 in the SP 500 over a period of about 6 weeks. Again, this is emphatically not a forecast, but the conditions for a final wave of speculation may have been created by the Fed’s decision last week, and it leaves us unable to rule out this admittedly hypothetical possibility – particularly in the context of what has been a classic Sornette-type bubble to-date.
So what does he do? He is buying out-of-the-money calls on the market [emphasis added]:
Strategic Growth Fund remains fully hedged, with a “staggered strike” position that places the strike prices of its index put options close to present market levels. Last week’s decision by the Federal Reserve to defer any reduction in the pace of quantitative easing adds near-term uncertainty. My concern is that investors may draw on this decision as evidence that the Federal Open Market Committee (FOMC) has placed some sort of “safety net” below the market, and that the surprising extension of its current policies could spark a short-term speculative “blowoff.” Given the relatively depressed level of implied volatility (which affects the cost of index option premiums), combined with some potential for the Fed decision to provoke a steep, if short-lived speculative response, we added a very small position in out-of-the-money index call options in Strategic Growth Fund late last week. This position serves mainly as a low cost “contingent” stance that may reduce the impact of our hedging in the event that the major indices advance by more than a few percent in the coming weeks.
Hussman is an example of how you can be both a bull and bear at the same time. It is an example of his inner investor and inner trader at work.


Cam Hui is a portfolio manager at Qwest Investment Fund Management Ltd. (“Qwest”). The opinions and any recommendations expressed in the blog are those of the author and do not reflect the opinions and recommendations of Qwest. Qwest reviews Mr. Hui’s blog to ensure it is connected with Mr. Hui’s obligation to deal fairly, honestly and in good faith with the blog’s readers.”

None of the information or opinions expressed in this blog constitutes a solicitation for the purchase or sale of any security or other instrument. Nothing in this blog constitutes investment advice and any recommendations that may be contained herein have not been based upon a consideration of the investment objectives, financial situation or particular needs of any specific recipient. Any purchase or sale activity in any securities or other instrument should be based upon your own analysis and conclusions. Past performance is not indicative of future results. Either Qwest or I may hold or control long or short positions in the securities or instruments mentioned.

Wednesday, September 25, 2013

A case of too much information from the Fed?

As a follow-up to my last post (see A failure of Fed communication policy), I came upon a post by Barry Ritholz where he rhetorically asked, "Why do we pay attention to Fed forecasts?" His conclusion was:
The short answer is because their Expectations are what drive policy, and Fed Forecasts are what drives their expectations . . .

Thus, despite their terrible forecasting track record, Fed forecast matter to policy implementation.
So it was with some amusement that I read that Stanley Fischer, former head of the Bank of Israel, former thesis adviser to Ben Bernanke at MIT, where he also taught notable economists such as Mario Draghi, Larry Summers and Greg Mankiw, admonished Bernanke about forward guidance:
At the CLSA Investors Forum in Hong Kong Monday, Mr. Fischer suggested Mr. Bernanke shouldn’t get “too precise” in guiding markets. The Fed has raised investors’ expectations with greater communication. But this can give markets a false sense of comfort, as shown by confusion last week over the Fed’s decision to hold bond purchases steady.

This lesson applies to Mark Carney, too. The Bank of England boss entered office this summer intent on providing guidance. Yet telling investors unemployment could be so slow to fall that interest rates might stay steady until late 2016 has been greeted by market skepticism: yields have risen in response.
Is this a case of too much information? Is all this forward guidance actually creating market volatility, instead of dampening it?


Cam Hui is a portfolio manager at Qwest Investment Fund Management Ltd. (“Qwest”). The opinions and any recommendations expressed in the blog are those of the author and do not reflect the opinions and recommendations of Qwest. Qwest reviews Mr. Hui’s blog to ensure it is connected with Mr. Hui’s obligation to deal fairly, honestly and in good faith with the blog’s readers.”

None of the information or opinions expressed in this blog constitutes a solicitation for the purchase or sale of any security or other instrument. Nothing in this blog constitutes investment advice and any recommendations that may be contained herein have not been based upon a consideration of the investment objectives, financial situation or particular needs of any specific recipient. Any purchase or sale activity in any securities or other instrument should be based upon your own analysis and conclusions. Past performance is not indicative of future results. Either Qwest or I may hold or control long or short positions in the securities or instruments mentioned.

Monday, September 23, 2013

A failure of Fed communication policy

William Dudley of the New York Fed made an important speech today entitled Reflections on the Economic Outlook and the Implications for Monetary Policy that justified the Fed's decision to delay the taper. What I am puzzled at is many of the points that he makes has been known for quite some time. In the interests of an open and transparent communication policy, why didn't the Fed tell us this before?

Dudley outlined the drags he saw in the economy. The first is the fiscal drag from sequestration. So why is that such a surprise?
However, against these improving economic fundamentals, we have two important offsets. The first offset is the unusually high degree of fiscal drag, which the Congressional Budget Office (CBO) estimates at about 1¾ percent of potential GDP in 2013.1 The two most important components of this restraint are the end of the payroll tax holiday and the increase in income tax rates this past January, and, more recently, the government spending cuts resulting from budget sequestration.
The second is the rise in interest rates since the May 22 announcement that the Fed was considering a taper. This may be one of the key reasons why the Fed decided to delay.
Another new source of drag for the economy is the sharp rise in long-term interest rates, especially residential mortgage rates—that has occurred since May. So far we don’t have much hard data on how this is affecting the housing sector. But data through mid-September generally indicate that the rise in rates has cut into the upward momentum of the housing sector.

How well "repaired" is the household balance sheet?
The chart below (via John Mauldin) shows how the household sector has repaired its balance sheet since the Lehman Crisis. The grey line shows the household debt ratio, which has declined to levels not seen since the early 1990's. That's good news, right?


Not so fast. The blue line shows the household debt to GDP ratio, which has fallen from its peak but remains at highly elevated levels. The way I interpret this chart is that the fall in debt service burden was largely a function in the decline in interest rates. If rates were to "normalize", then the household balance sheet may not be as "repaired" as many analysts may think.

Dudley went on to reiterate his concerns about the interest sensitive nature of consumer spending [emphasis added]:
Turning first to consumer spending, such spending has remained fairly subdued outside of interest rate-sensitive consumer durables.  In July, for example, real personal consumption expenditures were flat, and it is unlikely that third quarter consumption growth will be much above a 2 percent annual rate. 
He went on to state his concerns about the sustainability of consumer spending growth:
Moreover, the drivers of consumer spending do not look particularly supportive. In particular, real disposable income growth has grown at less than a 1 percent annual pace since March. Furthermore, the recent data do not yet clearly indicate a firming in the income growth rate, or the two important components of labor income growth—hours and compensation.

The conundrum for consumers is a simple one: if consumer spending growth is to exceed 2 percent annualized on a sustained basis at a time when real disposable income growth is below 2 percent then this would require the household saving rate to decline persistently. But there is little reason to expect such a decline given that the current saving rate is at a level consistent with current level of household wealth relative to income.
He concluded that you can't expect the household sector to continue to dig into their savings in order to spend:
Moreover, the drivers of consumer spending do not look particularly supportive. In particular, real disposable income growth has grown at less than a 1 percent annual pace since March. Furthermore, the recent data do not yet clearly indicate a firming in the income growth rate, or the two important components of labor income growth—hours and compensation.

The conundrum for consumers is a simple one: if consumer spending growth is to exceed 2 percent annualized on a sustained basis at a time when real disposable income growth is below 2 percent then this would require the household saving rate to decline persistently. But there is little reason to expect such a decline given that the current saving rate is at a level consistent with current level of household wealth relative to income.
Implicitly, job growth is the ultimate driver of consumer spending growth - and the job market remains weak. Dudley confirmed this view when he explained the reasoning behind his own vote not to taper [emphasis added]:
Several questions have emerged following the meeting. Most noteworthy was—given that market expectations were skewed towards anticipating the beginning of a taper at this meeting—why the Committee did not begin to reduce the pace of asset purchases. Although I can’t speak for the Committee, I can provide some reasons for my own decision.

To begin to taper, I have two tests that must be passed: (1) evidence that the labor market has shown improvement, and (2) information about the economy’s forward momentum that makes me confident that labor market improvement will continue in the future. So far, I think we have made progress with respect to these metrics, but have not yet achieved success.

With respect to the first metric, we have seen labor market improvement since the program began last September. Over this time period, the unemployment rate has declined to 7.3 percent from 8.1 percent.4 However, at the same time, this decline in the unemployment rate overstates the degree of improvement. Other metrics of labor market conditions, such as the hiring, job-openings, job-finding rate, quits rate and the vacancy-to-unemployment ratio, collectively indicate a much more modest improvement in labor market conditions compared to that suggested by the decline in the unemployment rate. In particular, it is still hard for those who are unemployed to find jobs. Currently, there are three unemployed workers per job opening, as opposed to an average of two during the period from 2003 to 2007.
Other analysts, such as former Fed vice-chair Don Kohn, have pointed out concerns over the impending fight over the debt-ceiling:
With respect to the second metric—confidence that the economic recovery is strong enough to generate sustained labor market improvement—I don’t think we have yet passed that test. The economy has not picked up forward momentum and a 2 percent growth rate—even if sustained—might not be sufficient to generate further improvement in labor market conditions. Moreover, fiscal uncertainties loom very large right now as Congress considers the issues of funding the government and raising the debt limit ceiling. Assuming no change in my assessment of the efficacy and costs associated with the purchase program, I’d like to see economic news that makes me more confident that we will see continued improvement in the labor market. Then I would feel comfortable that the time had come to cut the pace of asset purchases.

What's new here?
I think that this was an important speech from a key Fed governor explaining the decision to delay the taper. William Dudley is not far from the mainstream thinking at the FOMC, but I still believe that much of the reasoning behind the decision was not a surprise. Here are his key reasons:

  1. Consumer spending is interest sensitive because household debt levels are still on the high side. As rates have started to rise, it could restrain spending, which is an engine of growth. (No surprise here.)
  2. The improvement in unemployment rate, a key Fed metric, masks many weaknesses in the job market. In particular, the participation rate has been falling more than expected. (No surprise either, the Fed has been talking about the fall in participation rate for some time.)
  3. The fiscal drag from sequestration is restraining growth. (Hello! The Fed would have known about this before the May 22 announcement.)
  4. The uncertainty over the debt-ceiling fight is creating uncertainty. (Is the Fed that timid?)
Unless the FOMC is truly freaked out about the possible effects of the debt-ceiling debate, I don't see anything very new here. The other factors are already well known, but between May 22 and September 19, we had Bernanke and a parade of Fed governors telling us that, while everything is "data dependent", they were on track to taper by the end of the year if the economy continues on the current trajectory.

So what changed? Did they freak out over a debt-ceiling impasse? They knew that interest rates were backing up, so that was not surprise.

IMHO, the FOMC's September surprise decision was a failure of the Fed's communication policy.


Cam Hui is a portfolio manager at Qwest Investment Fund Management Ltd. (“Qwest”). The opinions and any recommendations expressed in the blog are those of the author and do not reflect the opinions and recommendations of Qwest. Qwest reviews Mr. Hui’s blog to ensure it is connected with Mr. Hui’s obligation to deal fairly, honestly and in good faith with the blog’s readers.”

None of the information or opinions expressed in this blog constitutes a solicitation for the purchase or sale of any security or other instrument. Nothing in this blog constitutes investment advice and any recommendations that may be contained herein have not been based upon a consideration of the investment objectives, financial situation or particular needs of any specific recipient. Any purchase or sale activity in any securities or other instrument should be based upon your own analysis and conclusions. Past performance is not indicative of future results. Either Qwest or I may hold or control long or short positions in the securities or instruments mentioned.

Sunday, September 22, 2013

Breakout and pullback?

Last week, major US equity averages like the Dow and the SPX rallied to new all-time highs on the news that the Fed is delaying the taper. On Thursday and Friday, the markets pulled back but remain above its upside breakout level. This looks like a classic case of a breakout and pullback to me.


Traders have to allow for the possibility that the market may pull back further below the breakout level as a test for the bulls. Analysis from Ryan Detrick of Schaeffers Research indicated that the coming week is one of the most seasonally weak of the year:
After one of the best starts in 40 years on the normally ‘scary’ month of September, I showed earlier this week why the rally could continue for the rest of the month.

Well, maybe it isn’t quite that simple. Turns out, next week is one of the most bearish weeks historically. We looked at how September does the week after option expiration – so next week. We’ve noticed over time, the SPX tends to sell-off some after option expiration, but September seems to really drop.

Going back to 2000, the SPX is down -1.12% on average and up just 23% of the time. Compare that with about flat and up 54% for the average week. The median return is actually worse, down -1.63%.

Bulls still in control
Nevertheless, my view is that the bulls still have the upper hand. As I pointed out last week (see Cyclical strength = Taper), cyclical stocks remain in a relative uptrend and the Morgan Stanley Cyclical Index (CYC) staged a decisive relative upside breakout in early September. The CYC/SPX ratio initially broke out in August, but pulled back below relative resistance before surging upward.


If stocks were to show weakness in the coming week, I would not be surprised to see the same pattern repeat itself.

As well, Street estimates of forward 12 month earnings continue to rise across the board for large, mid and small cap stocks. In addition, emerging market currencies have rallied, indicating stabilization and the lessening of tail-risk of an emerging market crisis in the near future. When the Fed indicated "no taper", it was just a case of pouring gasoline on the bullish fire.


How worried should you be about the debt-ceiling debate?
The real test of market psychology is whether the stock market will get serious jitters over the prospect of a government shutdown or possible default. I agree with Yves Smith when she wrote that this is the same-old-same-old kind of political grandstanding we've seen in the past:
So hang tight for way too much unnecessary melodrama over the next month. It’s another round of watching the two parties play chicken, with each posturing that it won’t be the one to steer out of the impending crash. The fact is that Obama really wants his Grand Bargain. All of this high drama is necessary for him to pretend to his base that he was forced to do what he’s been trying to do for years: sacrifice old people since he perversely believes that “reforming” Social Security and Medicare will get him brownie points in the presidential legacy ledger. This staged impasse is hard to take it as seriously until there’s evidence that this iteration of budget farce really is different from its predecessors.
For now, I remain cautiously bullish. One of the key barometers of how the market feels about the prospect that the budget-ceiling fight would seriously hurt the government is the performance of defense stocks. The chart below of an Aerospace and Defense ETF (ITA) against the market (SPY) shows ITA in a major relative uptrend. While it had pulled back somewhat last week, it was a pause from a highly overbought level.


Looking beyond the week, the weekly chart below of the NYSE Summation Index, which is a measure of market breadth, has turned up. I imposed a slow stochastic on the Summation Index in the top panel and showed the SPX in the bottom panel. The slow stochastic shows that the Summation Index is not overbought and, if history is any guide, market strength should continue for at least three weeks.


So relax. The market may show some minor weakness in the week. Unless the fundamentals seriously deteriorate, such as forward earnings start to fall, the bulls are still in control of the tape.


Cam Hui is a portfolio manager at Qwest Investment Fund Management Ltd. (“Qwest”). The opinions and any recommendations expressed in the blog are those of the author and do not reflect the opinions and recommendations of Qwest. Qwest reviews Mr. Hui’s blog to ensure it is connected with Mr. Hui’s obligation to deal fairly, honestly and in good faith with the blog’s readers.”

None of the information or opinions expressed in this blog constitutes a solicitation for the purchase or sale of any security or other instrument. Nothing in this blog constitutes investment advice and any recommendations that may be contained herein have not been based upon a consideration of the investment objectives, financial situation or particular needs of any specific recipient. Any purchase or sale activity in any securities or other instrument should be based upon your own analysis and conclusions. Past performance is not indicative of future results. Either Qwest or I may hold or control long or short positions in the securities or instruments mentioned.

Thursday, September 19, 2013

Investment policy: Not just for pension funds

I recently came upon the newly revised statement of beliefs by CalPERS. Many of these beliefs form the basis for a sound investment policy, not just for the pension fund giant, but for anyone else. The most important for me was their first point:
1) Liabilities must influence the asset structure: I recently wrote (see Think investment policy first, not just NFP) that I was a big fan of using an asset-liability management framework for pension plans and foundations. After all, the liability framework defines your objectives. If you don't know your objectives, how can you know if you are succeeding?
Here are my comments on the others:
2) A long time horizon is a responsibility and an advantage: Pension funds have the luxury of being patient. The main determinant of returns is the asset mix (see belief #6). In a steady state where the fund isn't being liquidated, they can wait out the sub-par equity market returns, which can last for decades. Individuals, on the other hand, don't have the same luxury.

3) CalPERS investment decisions may reflect wider stakeholder views, provided they are consistent with its fiduciary duty to members and beneficiaries. In my last post on this topic (Think investment policy first, not just NFP), I suggested that the investor deal with the soft issues of family dynamics surrounding his foundation. If expectations are not managed properly and agreed to, it can result in ugly family disputes and litigation between family members decades later.

4) Long term value creation requires effective management of three forms of capital: financial, physical and human. These kinds of governance structures are more appropriate to pension funds than for individuals.

5) CalPERS must articulate its investment goals and performance measures and ensure clear accountability for their execution. Agreed. See my comments on belief #1.

6) Strategic asset allocation is the dominant determinant of portfolio risk and return. Also see my previous comments on belief #1.

7) CalPERS will take risk only where we have a strong belief we will be rewarded for it. This is a variant on Richard Grinold's Fundamental Law of Active Management (see my previous comments on that topic here).

8) Costs matter and need to be effectively managed. This belief is another way of stating belief #7. The size of your bet should be related to your perceived edge. If you don't have an edge, but you feel that you need to be exposed to that asset class, then minimize your cost.

9) Risk to CalPERS is multi-faceted and not fully captured through measures such as volatility and tracking error. I have always thought that risk is multi-dimensional. Too many hedge funds forget that simple principle.

10) Strong processes and teamwork and deep resources are needed to achieve CalPERS goals and objectives. A bit of a motherhood and apple pie statement.
In summary, the CalPERS statement of beliefs is an illustration of why individuals need to have an investment policy and plan. The practice of investing isn't that hard, we just get overly caught up in the story of the day, such as what the Fed did or didn't do.

Once you have the plan, then the road forward becomes a lot easier.


Cam Hui is a portfolio manager at Qwest Investment Fund Management Ltd. (“Qwest”). The opinions and any recommendations expressed in the blog are those of the author and do not reflect the opinions and recommendations of Qwest. Qwest reviews Mr. Hui’s blog to ensure it is connected with Mr. Hui’s obligation to deal fairly, honestly and in good faith with the blog’s readers.”

None of the information or opinions expressed in this blog constitutes a solicitation for the purchase or sale of any security or other instrument. Nothing in this blog constitutes investment advice and any recommendations that may be contained herein have not been based upon a consideration of the investment objectives, financial situation or particular needs of any specific recipient. Any purchase or sale activity in any securities or other instrument should be based upon your own analysis and conclusions. Past performance is not indicative of future results. Either Qwest or I may hold or control long or short positions in the securities or instruments mentioned.

Tuesday, September 17, 2013

Cyclical strength = Taper

As we wait for the Fed decision, I am seeing a technical picture of cyclical strength and diminished tail-risk, all of which are setting up the conditions for the Fed to take its foot off the QE accelerator. Firstly, the broadly based NYSE Composite has staged an upside breakout to new all-time highs:


The upside breakout has been confirmed by a breakout in European stock averages:


J.C. Parets did warn yesterday, however, about the dreaded black candles in the Japanese candlestick charts at around key resistance levels and interpreted the candles bearishly. The black candles were present in the two charts above, but Parets did qualify his statement:
So how does this get worse? and How does this get better? These are the questions we should all be asking ourselves.

In my opinion, a gap lower Tuesday in these averages leaving this one black candle standing alone is probably the worst case scenario. This would create an island reversal of sorts, another bearish pattern, which would confirm Monday’s action and would probably lead to a fast and violent sell-off. How do we invalidate the black candle? I think if we have an inside day Tuesday and kind of chill out for a few days before eventually taking out Monday’s highs, that would be really constructive.
The fact that the markets did move high should be viewed constructively.


Cyclical strength, falling tail-risk
In addition, the charts are telling a story of cyclical strength. The relative returns of the Morgan Stanley Cyclical Index (CYC) against the market shows an upside relative breakout indicating that cyclical stocks have assumed the market leadership mantle. I interpret this as Mr. Market telling us that the cyclical part of the economy is taking over the heavy lifting, which should be viewed bullishly for the near term equity outlook.


As another confirmation of my bullish trading call, Ed Yardeni showed that Street consensus forward earnings estimates continue to rise across the large, mid and small cap spectrum of the US equity market.


As well, emerging market tail-risk is diminishing. I had been concerned about EM risk, as it has the potential to lead to another Asian-style currency crisis (see Forget Syria, watch EM for tail-risk). Recent signals from the foreign exchange markets indicate that EM currencies are rallying. The chart below of the EM currency ETF shows that it has rallied out of a steep downtrend and begun to turn upward.


Putting it all together, Mr. Market is telling us that the global economy is recovering and tail-risk is falling. These are ideal conditions for the Fed to taper.

Mr. Bernanke, bring it on!


Cam Hui is a portfolio manager at Qwest Investment Fund Management Ltd. (“Qwest”). The opinions and any recommendations expressed in the blog are those of the author and do not reflect the opinions and recommendations of Qwest. Qwest reviews Mr. Hui’s blog to ensure it is connected with Mr. Hui’s obligation to deal fairly, honestly and in good faith with the blog’s readers.”

None of the information or opinions expressed in this blog constitutes a solicitation for the purchase or sale of any security or other instrument. Nothing in this blog constitutes investment advice and any recommendations that may be contained herein have not been based upon a consideration of the investment objectives, financial situation or particular needs of any specific recipient. Any purchase or sale activity in any securities or other instrument should be based upon your own analysis and conclusions. Past performance is not indicative of future results. Either Qwest or I may hold or control long or short positions in the securities or instruments mentioned.

Sunday, September 15, 2013

My Lehman lesson: Model diversification and flexibility

The press and the blogosphere has been full of articles about the five year anniversary of the Lehman Crisis. What was most striking to me is Pew Research's survey results showing the anemic and uneven nature of the recovery. Many respondents indicated that their own situation remains fragile:
Five years after the U.S. economy faced its most serious crisis since the Great Depression, a majority of Americans (63%) say the nation’s economic system is no more secure today than it was before the 2008 market crash. Just a third (33%) think the system is more secure now than it was then.

Large percentages say household incomes and jobs still have yet to recover from the economic recession. And when asked about the impact of government efforts to deal with the recession, far more believe that economic policies have benefitted large banks, corporations and the rich than the middle-class, the poor or small businesses.

What happened to "unchecked greenback emissions"?
What have we learned? I learned that, in the aftermath of the collapse, a lot of experts were wrong, or more charitably characterized as "early", in their forecasts of the effects of the collapse and the policy response to the collapse. Consider the prognostication of no less a luminary than Warren Buffett, who warned about the effects of money printing and deficit spending in a NY Times Op-Ed on August 18, 2009:
Our immediate problem is to get our country back on its feet and flourishing — “whatever it takes” still makes sense. Once recovery is gained, however, Congress must end the rise in the debt-to-G.D.P. ratio and keep our growth in obligations in line with our growth in resources.

Unchecked carbon emissions will likely cause icebergs to melt. Unchecked greenback emissions will certainly cause the purchasing power of currency to melt. The dollar’s destiny lies with Congress.

The policy and market response
What has happened since then? The federal deficit has soared and so has the Fed's balance sheet. The chart below from Global Financial Data shows the policy response:


What about the market response? The USD didn't plummet in the wake of "unchecked greenback emissions", largely because of the global nature of the financial crisis. Other major industrialized countries (and the eurozone in particular) experienced their own financial crisis and global central bankers went into crisis mode. The balance sheets of the ECB, BoE, BoJ and other central banks expanded to stratospheric levels in response. In that case, shouldn't the effects show up in inflation rather than then the exchange rate? Inflation, as measured by the CPI, has been extremely tame. What about commodity inflation? Shouldn't it show up as commodity inflation? Well, sort of. As the chart below shows, commodity prices (in black) did rise in the wake of the global financial crisis, but so did stock prices (in red). Commodity prices peaked out in early 2011, but stock prices have continued to advance.


Where's the inflation?


Inflation has been dormant
Perhaps the forecasters are early. Some analysts, such as David Rosenberg, believe that stagflation lies in our future:
You cannot keep real short-term rates negative for this long in the face of even modestly positive real economic growth without generating financial excesses today and inflationary pressures in the future. That’s why I continue to believe that the next major theme — and the legacy of the Ben Bernanke regime — will be stagflation.
Warren Buffett expressed his concerns about stagflation back in 2008, according to Bloomberg:
``We're right in the middle of it right now,'' said Buffett, chairman of Omaha, Nebraska-based Berkshire Hathaway Inc., in an interview on Bloomberg Television today. ``I think the `flation' part will heat up and I think the `stag' part will get worse.''
Though he was uncertain about its timing:
``It's not going to be tomorrow, it's not going to be next month, and may not even be next year,'' said Buffett, 77.
Stagflation involves two elements, slow growth and inflation. I understand the slow growth part of the stagflation forecast. The growth path of the American economy remains anemic, largely because this is not the typical recovery from an inventory recession, but a balance sheet recession that requires the deleveraging of household, corporate and government balance sheets. That process takes time.

I am not sure I get the inflation part of the forecast. Today, five years after the Lehman Crisis, we have see little signs of consumer price inflation and asset inflation, in the form of commodity price inflation, remains relatively tame. How long do we have to wait?


Is inflation purely a monetary phenomena?
It sounds like that that the model underlying the thinking of people like Rosenberg and Buffett is Milton Friedman's MV=PQ conceptual framework:

Where

M\, is the total amount of money in circulation on average in an economy during the period, say a year.
V_T\, is the transactions velocity of money, that is the average frequency across all transactions with which a unit of money is spent. This reflects availability of financial institutions, economic variables, and choices made as to how fast people turn over their money.
p_i\, and q_i\, are the price and quantity of the i-th transaction.
\mathbf{p} is a column vector of the p_i\,, and the superscript T is the transpose operator.
\mathbf{q} is a column vector of the q_i\,.


If you were to increase the money supply by expanding the Fed balance sheet, holding V (velocity) and Q (quantity produced in the economy) constant, price rises and you get inflation. That's why, it is said, that inflation is a monetary phenomena.

So far, despite the Fed's efforts to expand the monetary base, velocity has collapsed and we have seen little signs of inflation.


A demographic explanation
To resolve this conundrum, it might be useful to study the last episode of stagflation. Steve Randy Waldman recently proposed an alternative explanation of the stagflation of the 1970's based on age demographics, namely that stagflation was the result of stagnant productivity, not just money printing. Consider the chart below of US productivity. It was stagnant during the 1970's but it has soared to new highs in the current post-Lehman Crisis period.


Waldman wrote:
The “malaise” of the 1970s was not a problem with GDP growth. NGDP growth was off the charts (more on that below). But real GDP growth was strong as well, clocking in at 38%, compared to only 35% in the 1980s, 39% in the 1990s, and an abysmal 16% in the 2000s.

What was stagnant in the 1970s was productivity, which puts hours worked beneath GDP in the denominator. Boomers’ headlong rush into the labor force created a strong arithmetic headwind for productivity stats.
Simply put, there were too many Baby Boomers entering the workforce at that time and productivity lagged as a result:
The root cause of the high-misery-index 1970s was demographics, plain and simple. The deep capital stock of the economy — including fixed capital, organizational capital, and what Arnold Kling describes as “patterns of sustainable specialization and trade” — was simply unprepared for the firehose of new workers. The nation faced a simple choice: employ them, and accept a lower rate of production per worker, or insist on continued productivity growth and tolerate high unemployment. Wisely, I think, we prioritized employment. But there was a bottleneck on the supply-side of the economy. Employed people expect to enjoy increased consumption for their labors, and so put pressure on demand in real terms. The result was high inflation, and would have been under any scenario that absorbed the men, and the women, of the baby boom in so short a period of time. Ultimately, the 1970s were a success story, albeit an uncomfortable success story. Going Volcker in 1973 would not have worked, except with intolerable rates of unemployment and undesirable discouragement of labor force entry. By the early 1980s, the goat was mostly through the snake, so a quick reset of expectations was effective.
Policy makers, in effect, wanted to avoid more social tensions and unrest (remember the anti-Vietnam sentiment of the early 1970's) and paid the price in the form of slow growth and rising inflation. Karl Smith, writing in Forbes, quoted Arthur Burns in justifying the high inflation of the 1970's:
“Viewed in the abstract the Federal Reserve System had the power to abort the inflation in its incipient stage fifteen years ago or at any later point, and it has the power to end it today. At any time during that period, it could have restricted the money supply and created sufficient strains in financial and industrial markets to terminate inflation with little delay. It did no do so because the Federal Reserve was itself caught up in the philosophic and political currents that were transforming American life and culture.
Smith went on:
Put another way, high inflation can always be prevented if one is willing to tolerate recessions. Yet, recessions have consequences. Government budgets – at minimum – are redirected towards immediate relief, if not outright cut. Public investments in basic research, exploration and state-of-the-art infrastructure are postponed. In the private sector R&D budgets are slashed and new products put on hold. Small businesses, especially young start-ups, perish en masse. Families who are just beginning to climb the socioeconomic ladder and offer a better future to their children are knocked back down. Social tensions rise. Xenophobic and ethnocentric movements flourish. The adolescent generation, just on its way to the workforce, is permanently marred by a shortage of training and experience.
If demographics was the main cause of the stagflation of the 1970's, then stagflation may not be in our immediate future. In fact, a paper by IMF economist Patrick Imam (via Business Insider) suggests that an aging population is likely to make monetary policy less effective. Michael Mandel wrote a paper suggesting that productivity growth is likely to skyrocket in the near future because of technological innovations. As well, Izabella Kamanska chimed in and wrote on the likely deflationary effects of a global population peak.


Investment implications
Who is right? David Rosenberg and Warren Buffett in forecasting stagflation, or at least, rising inflation in our future? Or the likes of Waldman, who proposed a demographic and productivity explanation of the stagflation of the 1970's, whose implication is that rising productivity will act to contain inflation?

For policy makers, it presents a conundrum. Who do you believe? Policy makers have a much more difficult problem because policy is dependent on the underlying model of how the economy works.

For investors, the conundrum can be resolved easily because they don't have to adhere to any single point of view. The answer is model diversification.

I honestly don't know who is right. However, my inner investor believes that he should stay flexible and create a portfolio that diversifies between models.

For me, my investment lesson learned in the aftermath of the Lehman Crisis is not to be overly dogmatic about your economic and political beliefs. Stay flexible and learn to diversify your models.


Cam Hui is a portfolio manager at Qwest Investment Fund Management Ltd. (“Qwest”). The opinions and any recommendations expressed in the blog are those of the author and do not reflect the opinions and recommendations of Qwest. Qwest reviews Mr. Hui’s blog to ensure it is connected with Mr. Hui’s obligation to deal fairly, honestly and in good faith with the blog’s readers.”

None of the information or opinions expressed in this blog constitutes a solicitation for the purchase or sale of any security or other instrument. Nothing in this blog constitutes investment advice and any recommendations that may be contained herein have not been based upon a consideration of the investment objectives, financial situation or particular needs of any specific recipient. Any purchase or sale activity in any securities or other instrument should be based upon your own analysis and conclusions. Past performance is not indicative of future results. Either Qwest or I may hold or control long or short positions in the securities or instruments mentioned.

Wednesday, September 11, 2013

A buy signal from the option market

One of the more reliable trading models in the past couple of years has flashed a buy signal. I have been watching the VIX/VXV ratio, as pioneered by Bill Luby, for some time. This investor sentiment indicator measures the term structure of the VIX Index. By my measure, when the ratio falls below 0.92, it has provided reasonably good long entry points in the past (see my previous post Waiting for a Santa Claus rally where I backtested this indicator).

The chart below shows the SPX in the top panel and the VIX/VXV in the bottom panel. The red dotted vertical are previous buy signals when the 3-day moving average of the VIX/VXV fell below the 0.92 mark.


As the NASDAQ 100 stages an upside breakout to new highs, the VIX/VXV is a confirmation of the underlying strength of the stock market.


If the past is any guide, this is a tradable rally that is likely to take the major averages higher, notwithstanding the worries about the Fed taper, the new Fed chair, the debt ceiling debate, etc.


Cam Hui is a portfolio manager at Qwest Investment Fund Management Ltd. (“Qwest”). The opinions and any recommendations expressed in the blog are those of the author and do not reflect the opinions and recommendations of Qwest. Qwest reviews Mr. Hui’s blog to ensure it is connected with Mr. Hui’s obligation to deal fairly, honestly and in good faith with the blog’s readers.”

None of the information or opinions expressed in this blog constitutes a solicitation for the purchase or sale of any security or other instrument. Nothing in this blog constitutes investment advice and any recommendations that may be contained herein have not been based upon a consideration of the investment objectives, financial situation or particular needs of any specific recipient. Any purchase or sale activity in any securities or other instrument should be based upon your own analysis and conclusions. Past performance is not indicative of future results. Either Qwest or I may hold or control long or short positions in the securities or instruments mentioned.

Sunday, September 8, 2013

Why the credit market matters to US equities

From a fundamental point of view, stock prices can advance for two reasons. Either earnings rise, or the P/E multiple expands. In this Fed tapering era, risk premiums are likely to rise and therefore P/Es are likely to fall (see my previous post Regime shifts = Volatility):
[T]he Fed indicated on May 22 that it is considering a plan to taper off its QE purchases. In other words, it may be taking its foot off the accelerator but it is not about to stomp on the brakes (raise rates).

The more subtle message that the market still hasn't gotten is that the various QE programs succeeded in lowering risk premiums by pushing market participants to take on more risk (reaching for yield, carry trades, etc.) Undoing the effects of QE, even though slowly, represents a regime change as risk premiums will start to rise. This will represent a headwind for equity valuations longer term, though the markets will be choppy as it adjusts by focusing on the headline of the day (see my previous blog post It's the risk premium, stupid!)
Despite the disappoint jobs report on Friday, the Street consensus seems to be a September taper. Jon Hilsenrath of the WSJ writes that the Fed is likely to adopt a taper-lite policy:
One option that has gained support among some Fed officials in recent weeks: Reduce their monthly bond purchases by a small amount, say $10 billion to $75 billion, and signal as loudly as possible the next step will depend on more evidence the job market is continuing to improve and inflation is moving back toward 2% from its current low levels.

Regardless of the timing, the prospect of a taper creates an environment where risk premiums face upward pressures and therefore P/E ratios face downward pressures. If stocks start to face headwinds on the P/E multiple front, then that means it is up to earnings to do the heavy lifting if prices were to rise.


Spotlight on earnings
Ed Yardeni monitors earnings and his analysis shows that SPX forward 12 month earnings (red line) continue to rise, which is bullish.


Where is the earnings growth coming from? This analysis from Deutsche Bank shows that most of the growth comes from Financials. In fact, Y/Y earnings growth ex-Financials have been flat.


Focus on Financials
Brian Gilmartin at Fundamentalis analyzed earnings growth at a sector level and found that Financial earnings growth came mainly from improving credit conditions which caused banks to reduce non-performing loan reserves (which had been earnings hits in the past) [emphasis added]:
What is the primary reason for the strong earnings growth for the Financial sector in 2013 ? Well, if you read the 2nd quarter, 2013 FDIC earnings report released to the public this week, you have record nominal profits for the banking sector for the 2nd quarter in a row. However I don't think a lot of people understand this concept since so many bank stocks are still trading below their 2007 highs, thanks to the dilution of the equity shareholder following the financial crisis. The number of fully-diluted shares outstanding for names like Morgan Stanley (MS), Bank of America (BAC), AIG (AIG) and others is sometimes quintuple their share count since mid, 2007. (long BAC). Banks and financials are earnings record profits, but “per share” earnings have been horribly diluted.

The real key to the FDIC report was the record low in non-performing loans (NPL’s) , which has led to reserve releases across the sector. Per the FDIC report, NPL’s improved for the 13th consecutive month, led by single-family housing. In addition the amount set aside by banks for NPL’s fell 40% year-over-year to $8.6 billion or the lowest since the 3rd quarter of 2006.
The tin foil hat brigade will say that this is all financial mumble-jumble and manipulation. I am more pragmatic and believe that even if they were, it will take a lot of time for the market to recognize this and anyone taking a bearish view could get hurt in the meantime. Gilmartin went on to say that he didn't expect this game to go on much longer:
The point is that “credit improvement” is still driving sector earnings, even though we expect this game to be played out by 2014, or at least greatly diminished.

Unfortunately, Dodd-Frank will likely squash the kind of revenue growth we saw in Financials in the late 1990′s, and through 2003 – 2006, in coming years. Revenue growth for the sector off the March ’09 market low, have been relatively subdued between 2% – 5% for the most part, and I don't think – absent a change in Washington – that will change much going forward.
In order for the Financials to grow their earnings in the face of these headwinds, credit conditions have to continue to improve - and improve dramatically. I am therefore watching the relative performance of junk bonds relative to the overall bond market as a quick-and-dirty way of evaluating the trend in credit. So far, junk bond prices continue to be in a relative uptrend, but if they falter - watch out!


Already, the relative performance of Financials to the market is starting to roll over. The message of the market seems to be: "Don't count on this sector to provide further earnings growth leadership in the near future."


Here is my concern. If Financials, which had been providing the bulk of the earnings growth for the market, start to falter, then what happens to stock prices (unless other sectors start to pick up the pace)?

For now, credit conditions hold the key to earnings growth and therefore the outlook for US equity prices.


Cam Hui is a portfolio manager at Qwest Investment Fund Management Ltd. (“Qwest”). The opinions and any recommendations expressed in the blog are those of the author and do not reflect the opinions and recommendations of Qwest. Qwest reviews Mr. Hui’s blog to ensure it is connected with Mr. Hui’s obligation to deal fairly, honestly and in good faith with the blog’s readers.”

None of the information or opinions expressed in this blog constitutes a solicitation for the purchase or sale of any security or other instrument. Nothing in this blog constitutes investment advice and any recommendations that may be contained herein have not been based upon a consideration of the investment objectives, financial situation or particular needs of any specific recipient. Any purchase or sale activity in any securities or other instrument should be based upon your own analysis and conclusions. Past performance is not indicative of future results. Either Qwest or I may hold or control long or short positions in the securities or instruments mentioned.