Sunday, July 30, 2023

On the verge of a long-term buy signal

Preface: Explaining our market timing models 
We maintain several market timing models, each with differing time horizons. The "Ultimate Market Timing Model" is a long-term market timing model based on the research outlined in our post, Building the ultimate market timing model. This model tends to generate only a handful of signals each decade.

The Trend Asset Allocation Model is an asset allocation model that applies trend-following principles based on the inputs of global stock and commodity prices. This model has a shorter time horizon and tends to turn over about 4-6 times a year. The performance and full details of a model portfolio based on the out-of-sample signals of the Trend Model can be found here.


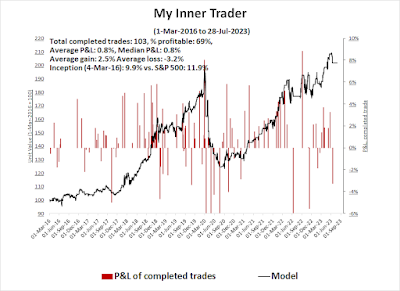
My inner trader uses a trading model, which is a blend of price momentum (is the Trend Model becoming more bullish, or bearish?) and overbought/oversold extremes (don't buy if the trend is overbought, and vice versa). Subscribers receive real-time alerts of model changes, and a hypothetical trading record of the email alerts is updated weekly here. The hypothetical trading record of the trading model of the real-time alerts that began in March 2016 is shown below.


The latest signals of each model are as follows:
  • Ultimate market timing model: Sell equities (Last changed from “buy” on 26-Mar-2023)*
  • Trend Model signal: Neutral (Last changed from “bullish” on 17-Mar-2023)*
  • Trading model: Neutral (Last changed from “bearish” on 15-Jun-2023)*
* The performance chart and model readings have been delayed by a week out of respect to our paying subscribers.

Update schedule: I generally update model readings on my site on weekends. I am also on Twitter at @humblestudent and on Mastodon at @humblestudent@toot.community. Subscribers receive real-time alerts of trading model changes, and a hypothetical trading record of those email alerts is shown here.

Subscribers can access the latest signal in real time here.


A likely buy signal ahead

Regular readers know that I apply the monthly MACD crossover as a way of determining long-term buy signals. The model works this way:
  • Buy when the monthly MACD histogram changes from negative to positive.
  • Sell the market exhibits a negative 14-month RSI divergence.

The month isn’t over yet, but when this model is applied to the broadly based NYSE Composite, it is on the verge of a buy signal, with the caveat that it’s never a good idea to front-run model readings. Significant market strength on Monday, which is the month-end, could tip the model reading into buy territory. Otherwise, the model should flash a buy signal in August barring a major pullback.


This model has performed well on an out-of-sample basis. It was timely in flashing a sell signal in late 2018. It bought back into the market in 2019 and sold just as the market topped in early 2020. It turned bullish again in late 2020 and became bearish in early 2022.
The history of past buy signals has usually indicated relatively long-lived bull runs with only minor drawdown risk.

The full post can be found here.


Saturday, July 29, 2023

Could a credit event derail the equity bull?

Is the soft landing here? Wall Street strategists have been racing to reduce their recession odds in the last week. More importantly, Fed Chair Powell revealed during the post-FOMC meeting press conference that Fed staff had upgraded its forecast from a mild recession in H2 2023 to no recession.
 
In the past few weeks, the stock market has become increasingly exuberant, but the bond market remains nervous. The VIX Index, which is the option implied volatility of stocks, has been steadily falling, indicating the expectation of lower risk. On the other hand, the MOVE Index, which is the bond market’s equivalent of VIX, is still elevated.


I interpret these readings as the stock market is discounting a soft landing, while the bond market is still concerned about a recession. In addition, the Bank of Japan’s decision to ease its yield curve control program has rattled the bond market. Equity bulls run the risk of a credit event which could spark a bear market. Here is my assessment of that risk.
 
The full post can be found here.
Wednesday, July 26, 2023

It's not just about the Fed

Mid-week market update: The market reaction to the FOMC decision was mostly a yawn. The Fed raised rates by a quarter-point, which was expected, and Powell refused to commit to further hikes while repeating his data dependency mantra.  As a consequence, the S&P 500 was mostly unchanged from before the decision to after the close. However, the 2-year Treasury yield, which is a proxy for Fed Funds expectations, did ease a little. Fed Funds expectations were mostly unchanged, other than the first easing was pulled from the May 2024 FOMC meeting to March.
 

The market faces far more sources of volatility than just the Fed.

The full post can be found here.


Sunday, July 23, 2023

A new cyclical bull?

Preface: Explaining our market timing models 
We maintain several market timing models, each with differing time horizons. The "Ultimate Market Timing Model" is a long-term market timing model based on the research outlined in our post, Building the ultimate market timing model. This model tends to generate only a handful of signals each decade.

The Trend Asset Allocation Model is an asset allocation model that applies trend-following principles based on the inputs of global stock and commodity prices. This model has a shorter time horizon and tends to turn over about 4-6 times a year. The performance and full details of a model portfolio based on the out-of-sample signals of the Trend Model can be found here.


My inner trader uses a trading model, which is a blend of price momentum (is the Trend Model becoming more bullish, or bearish?) and overbought/oversold extremes (don't buy if the trend is overbought, and vice versa). Subscribers receive real-time alerts of model changes, and a hypothetical trading record of the email alerts is updated weekly here. The hypothetical trading record of the trading model of the real-time alerts that began in March 2016 is shown below.


The latest signals of each model are as follows:
  • Ultimate market timing model: Sell equities (Last changed from “buy” on 26-Mar-2023)*
  • Trend Model signal: Neutral (Last changed from “bullish” on 17-Mar-2023)*
  • Trading model: Neutral (Last changed from “bearish” on 15-Jun-2023)*
* The performance chart and model readings have been delayed by a week out of respect to our paying subscribers.

Update schedule: I generally update model readings on my site on weekends. I am also on Twitter at @humblestudent and on Mastodon at @humblestudent@toot.community. Subscribers receive real-time alerts of trading model changes, and a hypothetical trading record of those email alerts is shown here.

Subscribers can access the latest signal in real time here.


The momentum buy signal

Technical buy signals are coming out of the woodwork, supported by strong price momentum and signs of broadening market breadth.

Ryan Detrick pointed out that the S&P 500 is on the verge of a five-month win streak of consecutive positive returns. Historically, market strength begets more strength.


I can sympathize. My slower-moving Trend Asset Allocation Model, which monitors a blend of global equity and commodity markets, is on the verge of a buy signal. While I am not inclined to front-run model readings, nor am I inclined to second guess model readings too much, I have some doubts. Here are the bull and bear cases.
 
 The full post can be found here.

Saturday, July 22, 2023

The risks to the disinflation and soft-landing bull case

Ever since the softer-than-expected June CPI report, the Wall Street narrative has pivoted toward disinflation and a soft landing. The disinflationary trend had been building for some time and inflation has been surprising to the downside around the world.


 As a consequence, the markets have taken a risk-on tone in anticipation of less hawkish tones from major central banks. Nevertheless, I would like to sound a word of warning of the risks in the disinflation and soft-landing scenario. Investing isn’t easy, and seemingly bullish scenarios could easily shift at a moment’s notice.
 
The full post can be found here.

Wednesday, July 19, 2023

Scenes from Q2 earnings season

Mid-week market update: I wrote on the weekend that Q2 earnings season is potentially pivotal for the stock market (see What to watch for in a pivotal earnings season). Going into reporting season, the consensus is calling for a rebound in earning, though the recovery is expected to be stronger in large and mid-caps compared to small-caps.
 
 
The very early report card shows relatively upbeat results, though there are some blemishes of concern.
 
The full post can be found here.

Sunday, July 16, 2023

The soft landing vs. slowdown debate

Preface: Explaining our market timing models 
We maintain several market timing models, each with differing time horizons. The "Ultimate Market Timing Model" is a long-term market timing model based on the research outlined in our post, Building the ultimate market timing model. This model tends to generate only a handful of signals each decade.

The Trend Asset Allocation Model is an asset allocation model that applies trend-following principles based on the inputs of global stock and commodity prices. This model has a shorter time horizon and tends to turn over about 4-6 times a year. The performance and full details of a model portfolio based on the out-of-sample signals of the Trend Model can be found here.


My inner trader uses a trading model, which is a blend of price momentum (is the Trend Model becoming more bullish, or bearish?) and overbought/oversold extremes (don't buy if the trend is overbought, and vice versa). Subscribers receive real-time alerts of model changes, and a hypothetical trading record of the email alerts is updated weekly here. The hypothetical trading record of the trading model of the real-time alerts that began in March 2016 is shown below.


The latest signals of each model are as follows:
  • Ultimate market timing model: Sell equities (Last changed from “buy” on 26-Mar-2023)*
  • Trend Model signal: Neutral (Last changed from “bullish” on 17-Mar-2023)*
  • Trading model: Neutral (Last changed from “bearish” on 15-Jun-2023)*
* The performance chart and model readings have been delayed by a week out of respect to our paying subscribers.

Update schedule: I generally update model readings on my site on weekends. I am also on Twitter at @humblestudent and on Mastodon at @humblestudent@toot.community. Subscribers receive real-time alerts of trading model changes, and a hypothetical trading record of those email alerts is shown here.

Subscribers can access the latest signal in real time here.
 

A fragile consensus

It’s remarkable how swiftly the consensus narrative can change. Two weeks ago, the 2-year Treasury yield spike above 5% when the ADP Non-farm Employment report came in at a blowout 497K, which was well ahead of expectations of 228K. The news prompted speculation that the Fed would have to tighten more than expected and send the economy into recession.


Last week, the softer-than-expected CPI report abruptly shifted the tone of the consensus to a soft landing and sparked a risk-on rally in risk assets and yields retreated. This matters because the 2-year Treasury yield is a proxy for market expectations of the Fed Funds rate. Past peaks in the 2-year rate have either been coincidental or led peaks in Fed Funds.


The current environment illustrates the fragile nature of the market consensus. If the narrative can flip from bear to bull in a week, it may not take much for it to flip back. The market is at a critical juncture. Team Soft Landing is locked in a cage match with Team Slowdown. Who wins?

The full post can be found here.


Saturday, July 15, 2023

What to watch for in a pivotal earnings season

The Q2 earnings reporting season could be a pivotal one. Earnings reports and subsequent corporate guidance are likely to give investors greater clarity on whether the economy is softening into a slowdown or undergoing a soft landing and recovery. The preliminary picture is a fragile recovery. Forward guidance for Q2 has improved from Q1. Negative pre-announcements have fallen and positive ones have risen.
 
The key question is whether this represents a data blip or the real signs of recovery. This matters because stock prices are facing substantial valuation risk. The S&P 500 is trading at a forward P/E of 19.3, which is higher than its 5-year average of 18.6 and 10-year average of 17.4, along with an elevated 10-year Treasury yield when compared to its 10- and 20-year history. The asset allocation case for equities has changed from TINA (There Is No Alternative) when rates were near zero to TARA (There Are Reasonable Alternatives) today. Any earnings disappointment could see stocks face substantial downside risk.
 
 
Here’s what I am watching.
 
The full post can be found here.

Wednesday, July 12, 2023

Tech leadership stumbles, what will pick up the pace?

 Mid-week market update: It finally happened. The NASDAQ 100 is being re-weighted in order to address “concentration risk” (full details here). It was a belated decision in response to narrow market leadership, but the problem seems to have moderated on its own. Large-cap technology stocks, which had been on a tear, stalled against the S&P 500. Moreover, sector relative breadth (bottom two panels) are deteriorating.


It may be time to look for new leadership.

The full post can be found here.


Monday, July 10, 2023

The mystery in the NFP report

 I’ve been thinking about the nonfarm payroll report that was reported on Friday. Employment has been gradually slipping from a 5 and 8 handle to about 200K today. The June headline payroll report came in at 209K, which was under consensus expectations. The big surprise was the decline in the unemployment rate.
 
 
The full post can be found here.

Sunday, July 9, 2023

Bond rout = Stock rout?

Preface: Explaining our market timing models 
We maintain several market timing models, each with differing time horizons. The "Ultimate Market Timing Model" is a long-term market timing model based on the research outlined in our post, Building the ultimate market timing model. This model tends to generate only a handful of signals each decade.

The Trend Asset Allocation Model is an asset allocation model that applies trend-following principles based on the inputs of global stock and commodity prices. This model has a shorter time horizon and tends to turn over about 4-6 times a year. The performance and full details of a model portfolio based on the out-of-sample signals of the Trend Model can be found here.


My inner trader uses a trading model, which is a blend of price momentum (is the Trend Model becoming more bullish, or bearish?) and overbought/oversold extremes (don't buy if the trend is overbought, and vice versa). Subscribers receive real-time alerts of model changes, and a hypothetical trading record of the email alerts is updated weekly here. The hypothetical trading record of the trading model of the real-time alerts that began in March 2016 is shown below.


The latest signals of each model are as follows:
  • Ultimate market timing model: Sell equities (Last changed from “buy” on 26-Mar-2023)*
  • Trend Model signal: Neutral (Last changed from “bullish” on 17-Mar-2023)*
  • Trading model: Neutral (Last changed from “bearish” on 15-Jun-2023)*
* The performance chart and model readings have been delayed by a week out of respect to our paying subscribers.

Update schedule: I generally update model readings on my site on weekends. I am also on Twitter at @humblestudent and on Mastodon at @humblestudent@toot.community. Subscribers receive real-time alerts of trading model changes, and a hypothetical trading record of those email alerts is shown here.

Subscribers can access the latest signal in real time here.
 

Trading the island reversal

The S&P 500 hit an air pocket last week as it was rattled by the rout in bond prices. As the index weakened, SPY formed a textbook island reversal with a measured objective of about 435, which represents a fairly shallow pullback. However, the VIX spiked above its upper Bollinger Band, which is an oversold condition that could be indicative of a short-term bottom.


Notwithstanding the market’s short-term volatility, what’s the intermediate-term prognosis? Can the bulls hold support at that initial support level?
 
The full post can be found here.

Saturday, July 8, 2023

Why our Ultimate Market Timing Model is cautious

How would you like to take greater equity risk while reducing the worst of the downside risk of owning equities? That's my Ultimate Market Timing Model (UMTM) is designed to do.
 
I recently had a discussion with a reader about the details of my UMTM. The UMTM is an extremely low turnover model that flashes signals once every few years and is designed to limit the extremes of the downside tail-risk of owning equities. When extreme downside risk is minimized, investors can afford to take greater equity risk. Instead of, say, a conventional 60% stocks/40% bonds asset mix, an investor could be more aggressive and move to a 70/30 or even 80/20 asset mix and revert to a more defensive posture such as a 40/60 or 30/70 asset mix under risk-off conditions.

In that context, the reader asked why the UMTM flashed a buy signal in February and flipped back to sell in March, even as the S&P 500 rallied to a new recovery high.


As it turns out, the UMTM was whipsawed by a trend-following model, which is an unfortunate feature of trend-following strategies. To explain further, let’s unpack the details of the model, which is based on a blend of trend-following strategies and a macro overlay.
 

The full post can be found here.


Wednesday, July 5, 2023

A geopolitical stress test?

Mid-week market update: Geopolitical risks are rising and it remains to be seen how the market reacts to geopolitical stress. On the weekend, I made the following tweet.


Those fears are becoming more real.

The full post can be found here.


Sunday, July 2, 2023

A Q2 global market review

Preface: Explaining our market timing models 
We maintain several market timing models, each with differing time horizons. The "Ultimate Market Timing Model" is a long-term market timing model based on the research outlined in our post, Building the ultimate market timing model. This model tends to generate only a handful of signals each decade.

The Trend Asset Allocation Model is an asset allocation model that applies trend-following principles based on the inputs of global stock and commodity prices. This model has a shorter time horizon and tends to turn over about 4-6 times a year. The performance and full details of a model portfolio based on the out-of-sample signals of the Trend Model can be found here.


My inner trader uses a trading model, which is a blend of price momentum (is the Trend Model becoming more bullish, or bearish?) and overbought/oversold extremes (don't buy if the trend is overbought, and vice versa). Subscribers receive real-time alerts of model changes, and a hypothetical trading record of the email alerts is updated weekly here. The hypothetical trading record of the trading model of the real-time alerts that began in March 2016 is shown below.


The latest signals of each model are as follows:
  • Ultimate market timing model: Sell equities (Last changed from “buy” on 26-Mar-2023)*
  • Trend Model signal: Neutral (Last changed from “bullish” on 17-Mar-2023)*
  • Trading model: Neutral (Last changed from “bearish” on 15-Jun-2023)*
* The performance chart and model readings have been delayed by a week out of respect to our paying subscribers.

Update schedule: I generally update model readings on my site on weekends. I am also on Twitter at @humblestudent and on Mastodon at @humblestudent@toot.community. Subscribers receive real-time alerts of trading model changes, and a hypothetical trading record of those email alerts is shown here.

Subscribers can access the latest signal in real time here.
 

A global market review

Now that the first half of 2023 is in the rear view mirror, let’s review how global equity markets performed. Here are the quick takeaways from a preliminary analysis of relative returns.

  • U.S. equities were the leaders in Q2.
  • Japan is becoming the new stealth leader, while Europe is pulling back.
  • China and other emerging markets were weak on a relative basis.


However, there were more subtle indications if we drill into the details by region.

The full post can be found here.

Saturday, July 1, 2023

Is the Bidenomics electoral focus a contrarian economic indicator?

In many ways, politicians are worse than magazine covers as contrarian indicators. Magazine editors focus on an economic issue when it moves from page 20 to page 1 in the public’s mind. By that time, it’s been largely discounted by the market. Politicians are worse. They follow the trends raised by magazine editors and are even more reactive.
 
It was therefore of great interest that President Joe Biden kicked off his re-election by running on his economic record, which he called “Bidenomics”, which is composed of a grab bag of his past legislative initiatives such as infrastructure, renewable energy and semiconductors. The main theme is a focus on an economic revival for the middle class by emphasizing the addition of 1.3 million jobs and the achievement of a historically low unemployment rate.
 
The Bidenomics focus raises a contrarian risk that the President is touting his economic record just when recession odds are elevated. Consensus expectations for a recession from a variety of surveys of economic forecasts call for a recession to begin in H2 2023.
 
 
Did Biden just top tick the economy?

The full post can be found here.