Wednesday, November 30, 2022

"50 bps in December", or "Stay the course until the job is done"

Mid-week market update: In the long awaited Powell speech, the Fed Chair signaled, "It makes sense to moderate the pace of our rate increases...[and] the time for moderating the pace of rate increases may come as soon as the December meeting". The market reacted with a risk-on tone and began to discount a series of rate cuts in Q3 2023.


Every Fed speaker this week has said that the Fed isn't going to cut rates. Powell concluded his speech with:
It is likely that restoring price stability will require holding policy at a restrictive level for some time. History cautions strongly against prematurely loosening policy. We will stay the course until the job is done.
The change from 75 bps to 50 bps has long been anticipated. Is the risk-on reaction appropriate in this instance? Should investors buy "the 50 bps in December", or sell the "stay the course until the job is done" nattative?

The full post can be found here.

Sunday, November 27, 2022

Waiting for clarity from the Nov 30 Powell speech

Preface: Explaining our market timing models 
We maintain several market timing models, each with differing time horizons. The "Ultimate Market Timing Model" is a long-term market timing model based on the research outlined in our post, Building the ultimate market timing model. This model tends to generate only a handful of signals each decade.

The Trend Asset Allocation Model is an asset allocation model that applies trend-following principles based on the inputs of global stock and commodity prices. This model has a shorter time horizon and tends to turn over about 4-6 times a year. The performance and full details of a model portfolio based on the out-of-sample signals of the Trend Model can be found here.


My inner trader uses a trading model, which is a blend of price momentum (is the Trend Model becoming more bullish, or bearish?) and overbought/oversold extremes (don't buy if the trend is overbought, and vice versa). Subscribers receive real-time alerts of model changes, and a hypothetical trading record of the email alerts is updated weekly here. The hypothetical trading record of the trading model of the real-time alerts that began in March 2016 is shown below.


The latest signals of each model are as follows:
  • Ultimate market timing model: Sell equities*
  • Trend Model signal: Neutral*
  • Trading model: Bearish*
* The performance chart and model readings have been delayed by a week out of respect to our paying subscribers.

Update schedule: I generally update model readings on my site on weekends. I am also on Twitter at @humblestudent and on Mastodon at @humblestudent@toot.community. Subscribers receive real-time alerts of trading model changes, and a hypothetical trading record of those email alerts is shown here.

Subscribers can access the latest signal in real-time here.


Marginally more dovish
Fed policy is still moving markets. The release of the November FOMC minutes confirmed what Fed officials had been telegraphing in the past few weeks, namely that "a substantial majority of participants judged that a slowing in the pace of increase would likely soon be appropriate". However, "the target range for the federal funds rate...had become more important ...than the pace of further increases in the target range". Fed Funds expectations turned marginally more dovish in the wake of the release and the S&P 500 rallied. 


Despite the market's excitement about the slowing in the pace of rate hikes, Fed Chair Powell sounded a more hawkish tone and said during the November FOMC press conference that he's "never thought of [a series of milder inflation readings] as the appropriate test for slowing the pace of increases or for identifying the appropriately restrictive level". Fed Chair Jerome Powell is scheduled to speak at the Brookings Institution on November 30 on the economy and labor markets, just two days before the  start of the blackout window for Fed speeches ahead of the December FOMC meeting. That speech is likely to set the tone for the markets for the coming weeks.

The full post can be found here.

Friday, November 25, 2022

A cyclical rebound mirage?

I highlighted a widening gulf between the technical and macro outlook in August (see "Price leads fundamentals", or "Don't fight the Fed"?). At the time, the technical indicators were wildly bullish because of strong price momentum, while the macro outlook was cautious. The macro view eventually won out.

A similar divide may be appearing again, albeit not as wide. Technical internals has been pointing to a shift in leadership to value and cyclical sectors, indicating the emergence of cyclical green shoots. Further analysis of technical internals, as well as the macro picture, indicate that hope of a cyclical rebound may be an illusion.


Here's why.

The full post can be found here.

Tuesday, November 22, 2022

Things are breaking beneath the surface

Mid-week market update: I thought that I would publish an early mid-week market update in light of the shortened US Thanksgiving trading week. As the S&P 500 consolidates in a narrow range between 3900 and 4000, things are breaking beneath the surface.

Let's begin the analysis at the extreme risk part of the market. As the crypto world teeters, Bitcoin is weakening, Coinbase shares (COIN) have broken support, and the Bitcoin to Greyscale Bitcoin Trust (GBTC) ratio erode, indicating a widening NAV discount.


The full post can be found here.

Sunday, November 20, 2022

Sentiment whipsaws are masking the bear trend

Preface: Explaining our market timing models 
We maintain several market timing models, each with differing time horizons. The "Ultimate Market Timing Model" is a long-term market timing model based on the research outlined in our post, Building the ultimate market timing model. This model tends to generate only a handful of signals each decade.

The Trend Asset Allocation Model is an asset allocation model that applies trend-following principles based on the inputs of global stock and commodity prices. This model has a shorter time horizon and tends to turn over about 4-6 times a year. The performance and full details of a model portfolio based on the out-of-sample signals of the Trend Model can be found here.


My inner trader uses a trading model, which is a blend of price momentum (is the Trend Model becoming more bullish, or bearish?) and overbought/oversold extremes (don't buy if the trend is overbought, and vice versa). Subscribers receive real-time alerts of model changes, and a hypothetical trading record of the email alerts is updated weekly here. The hypothetical trading record of the trading model of the real-time alerts that began in March 2016 is shown below.


The latest signals of each model are as follows:
  • Ultimate market timing model: Sell equities*
  • Trend Model signal: Neutral*
  • Trading model: Bearish*
* The performance chart and model readings have been delayed by a week out of respect to our paying subscribers.

Update schedule: I generally update model readings on my site on weekends. I am also on Twitter at @humblestudent and on Mastodon at @humblestudent@toot.community. Subscribers receive real-time alerts of trading model changes, and a hypothetical trading record of those email alerts is shown here.

Subscribers can access the latest signal in real-time here.


A risk-on stampede?
I pointed out in the past that risk appetite in 2022 can largely be attributable to changes in the USD. The S&P 500 has shown a close inverse correlation to the greenback. Now that the USD has decisively violated trend line support, does that mean that it's time for investors to stampede into a risk-on trade?
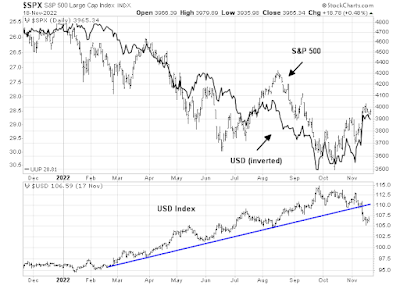

What are the fundamentals that explain the technical breakdown in the USD? Has the Fed signaled that it is about to out-dove the European Central Bank and other major central banks, which would narrow interest rate differentials and weaken the dollar? Will other central banks out-hawk the Fed?

The full post can be found here.

Saturday, November 19, 2022

The Fed cratered stock-bond diversification, what's next?

The performance of balanced funds has become especially challenging in 2022. In most recessionary equity bear markets, falling stock prices were offset by rising bond prices or falling bond yields. The fixed income component of a balanced fund portfolio has usually acted as a counterweight to equities.


Not so in 2022. You would have to go back to the double-dip recession of 1980-1982 to see a prolonged period of positive correlation between stock and bond prices. That era was characterized by the hawkish Volcker Fed, which was determined to keep raising rates in order to squeeze inflationary expectations out of the economy. Fast forward to 2022, the Powell Fed appears to be on a similar path. What does that mean for investors?


Here are the challenges for stock, bond and balanced fund investors as we peer into 2023.

The full post can be found here.

Wednesday, November 16, 2022

Time to jump on the year-end rally bandwagon?

Mid-week market update: The stock market surged last week in reaction to the soft CPI reading. It got better news this week when PPI came in lower than expected. As well, China unveiled a 16-point package to try and stabilize its cratering property market and softened some of its Zero COVID policies. Berkshire Hathaway unveiled a new long position in TSMC, which light a fire under  semiconductor stocks, though Micron's warning this morning unwound some of the rally.

As a consequence, the Investors Intelligence survey showed that the bull-bear spread turned positive. Increasingly, I am seeing discussions about positioning for a year-end rally.


Should you jump on the year-end rally bandwagon?

The full post can be found here.

Sunday, November 13, 2022

Soft CPI is helpful, but it's still a bear market

Preface: Explaining our market timing models 
We maintain several market timing models, each with differing time horizons. The "Ultimate Market Timing Model" is a long-term market timing model based on the research outlined in our post, Building the ultimate market timing model. This model tends to generate only a handful of signals each decade.

The Trend Asset Allocation Model is an asset allocation model that applies trend-following principles based on the inputs of global stock and commodity prices. This model has a shorter time horizon and tends to turn over about 4-6 times a year. The performance and full details of a model portfolio based on the out-of-sample signals of the Trend Model can be found here.


My inner trader uses a trading model, which is a blend of price momentum (is the Trend Model becoming more bullish, or bearish?) and overbought/oversold extremes (don't buy if the trend is overbought, and vice versa). Subscribers receive real-time alerts of model changes, and a hypothetical trading record of the email alerts is updated weekly here. The hypothetical trading record of the trading model of the real-time alerts that began in March 2016 is shown below.


The latest signals of each model are as follows:
  • Ultimate market timing model: Sell equities*
  • Trend Model signal: Neutral*
  • Trading model: Neutral*
* The performance chart and model readings have been delayed by a week out of respect to our paying subscribers.

Update schedule: I generally update model readings on my site on weekends and tweet mid-week observations at @humblestudent. Subscribers receive real-time alerts of trading model changes, and a hypothetical trading record of those email alerts is shown here.

Subscribers can access the latest signal in real time here.


Curb your enthusiasm
Does the soft October CPI report mark the start of a fresh bull? Not so fast!

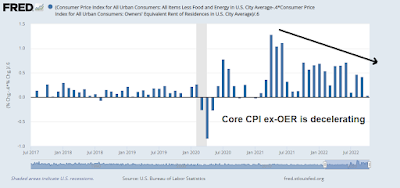
To be sure, the report was positive in many ways. Most of the strength in core CPI was in services and Owners' Equivalent Rent (OER) in particular. Rents are a lagging component of CPI and it has been weakening. Eventually, it will show up in actual CPI metrics. In the meantime, monthly core CPI ex-OER continues to show a trend of deceleration.


Mark Hulbert advised investors to curb their enthusiasm. He pointed out that the stock market's outsized one-day return in response to the softer than expected CPI report is an indication that the bear market is still alive and well.
Despite Thursday’s explosive rally in stocks, it’s likely we’re still mired in a bear market.

In fact, the magnitude of the surge itself suggests the bear is still alive and well.

Consider all trading days since the Nasdaq Composite Index was created in 1971 in which it gained — as it did Thursday — more than 6%. Twenty of 26 of those days prior to Thursday occurred during a bear market, or 77% of the time, according to Ned Davis Research.
The full post can be found here.

Saturday, November 12, 2022

Who's swimming naked as the tide goes out?

Warren Buffett famously said that when the tide goes out, you find out who has been swimming naked. Now that the Fed is tightening financial conditions and the tide is going out, I undertake an analysis to find out what countries and sectors have been swimming naked, and who has been opportunisticaly swimming with the tide.


The full post can be found here.

Wednesday, November 9, 2022

Why the risk-off tone? Isn't divided government bullish?

Mid-week market update: Why have the markets gone risk-off? Isn't divided government supposed to be equity bullish?

While the exact results of the mid-term elections aren't known just yet, polling models and PredictIt odds, which represent consensus expectations, show a narrow Republican majority in the House and a probable Democrat control of the Senate.


This result should be equity positive for several reasons:
  • A tighter fiscal policy which makes the Fed's job easier and raises the odds of a more dovish path for monetary policy.
  • A narrow Republican majority reduces the tail risk of a disorderly debt ceiling impasse. The recent UK experience showed that the market has little patience for fiscal uncertainty.
While the political overtones of the election are mildly bullish, I can think of some other reasons for the risk-off tone in the markets.

The full post can be found here.

Sunday, November 6, 2022

The hidden story of investor capitulation

Preface: Explaining our market timing models 
We maintain several market timing models, each with differing time horizons. The "Ultimate Market Timing Model" is a long-term market timing model based on the research outlined in our post, Building the ultimate market timing model. This model tends to generate only a handful of signals each decade.

The Trend Asset Allocation Model is an asset allocation model that applies trend-following principles based on the inputs of global stock and commodity prices. This model has a shorter time horizon and tends to turn over about 4-6 times a year. The performance and full details of a model portfolio based on the out-of-sample signals of the Trend Model can be found here.


My inner trader uses a trading model, which is a blend of price momentum (is the Trend Model becoming more bullish, or bearish?) and overbought/oversold extremes (don't buy if the trend is overbought, and vice versa). Subscribers receive real-time alerts of model changes, and a hypothetical trading record of the email alerts is updated weekly here. The hypothetical trading record of the trading model of the real-time alerts that began in March 2016 is shown below.


The latest signals of each model are as follows:
  • Ultimate market timing model: Sell equities*
  • Trend Model signal: Neutral*
  • Trading model: Bullish*
* The performance chart and model readings have been delayed by a week out of respect to our paying subscribers.

Update schedule: I generally update model readings on my site on weekends and tweet mid-week observations at @humblestudent. Subscribers receive real-time alerts of trading model changes, and a hypothetical trading record of those email alerts is shown here.

Subscribers can access the latest signal in real time here.


Resilient retail sentiment?
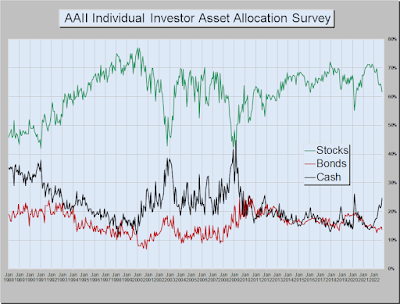
AAII conducts two surveys, and they are different from each other. The weekly AAII survey asks respondents how they feel about the markets. The monthly survey asks them what they're doing with their money. The latest monthly asset allocation survey shows that while equity weights have fallen, they are nowhere near the capitulation levels seen at the bottom of the 1990, 2003, and 2008 bear markets. It has led to the conclusion that retail investors haven't thrown in the towel, which opens the door to further downside potential in stock prices.


I beg to differ...

The full post can be found here.


Saturday, November 5, 2022

Peering into 2023: A bear market roadmap

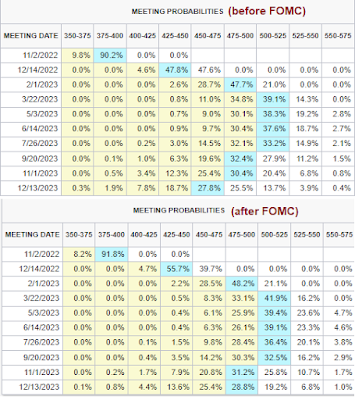
In the wake of the November FOMC meeting, Fed Chair Jerome Powell summarized Fed policy very clearly with two statements: "We will stay the course until the job is done". He added, "It is very premature to think about pausing (rate hikes)". 

It was a hawkish message, though Fed Funds expectations were largely unchanged after the meeting and press conference.


Stock prices reacted by skidding badly. The S&P 500 ended the day -2.5%. The Fed has made it clear that it wants to tighten monetary conditions by engineering an equity bear market. How far can the bear market run? Here is a roadmap.

The full post can be found here.

Wednesday, November 2, 2022

Do the bulls have anything left in the tank for their charge?

Mid-week market update: It's always difficult to make tactical trading calls on FOMC meeting day. The S&P 500 approached the latest meeting with the 5-day RSI near overbought territory. The experience in 2022 of overbought or near overbought conditions on meeting days (March and July, n=2) has seen stock prices continue to advance. Can it continue? Do the bulls have anything left in the tank for their charge?


The full post can be found here.