Preface: Explaining our market timing models We maintain several market timing models, each with differing time horizons. The "
Ultimate Market Timing Model" is a long-term market timing model based on the research outlined in our post,
Building the ultimate market timing model. This model tends to generate only a handful of signals each decade.
The
Trend Asset Allocation Model is an asset allocation model that applies trend-following principles based on the inputs of global stock and commodity prices. This model has a shorter time horizon and tends to turn over about 4-6 times a year. The performance and full details of a model portfolio based on the out-of-sample signals of the Trend Model can be found
here.
My inner trader uses a
trading model, which is a blend of price momentum (is the Trend Model becoming more bullish, or bearish?) and overbought/oversold extremes (don't buy if the trend is overbought, and vice versa). Subscribers receive real-time alerts of model changes, and a hypothetical trading record of the email alerts is updated weekly
here. The hypothetical trading record of the trading
model of the real-time alerts that began in March 2016 is shown below.
The latest signals of each model are as follows:
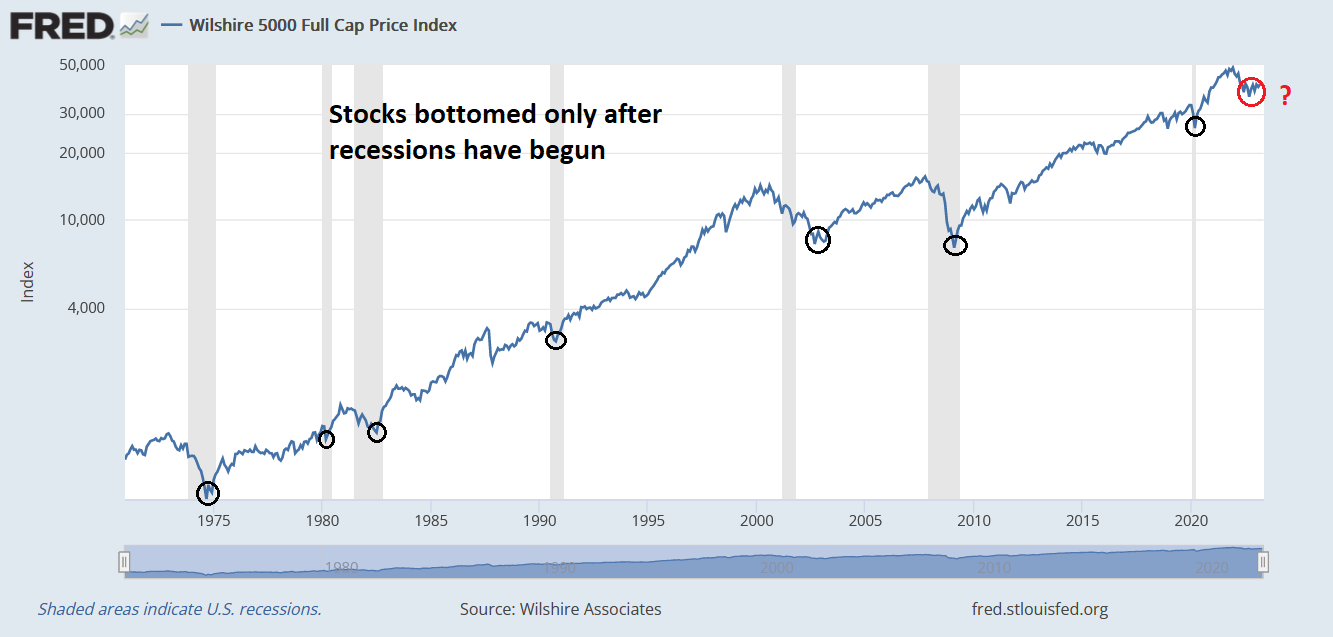
- Ultimate market timing model: Sell equities*
- Trend Model signal: Neutral*
- Trading model: Bullish*
* The performance chart and model readings have been delayed by a week out of respect to our paying subscribers.Update schedule: I generally update model readings on my
site on weekends. I am also on Twitter at @humblestudent and on Mastodon at @humblestudent@toot.community. Subscribers receive real-time alerts of trading model changes, and a hypothetical trading record of those email alerts is shown
here.
Subscribers can access the latest signal in real time
here.
Dissecting the sources of European strength
As investors wait for the resolution of the debt ceiling talks, I would like to pivot away from the U.S. market and focus on the sources of underlying European strength. As regular readers are aware, we have been bullish on European equities for some time (see
The market leaders hiding in plain sight).
Here is the major reason I am bullish. The Euro STOXX 50 staged a relative breakout from a long base in early 2023. France has been the leader among the major core and peripheral European countries, along with Italy and Greece. However, Germany has been the laggard, testing a key relative resistance level.
I analyzed the sources of European equity strength and show why the latest move is sustainable. The possibility exists that this could be the start of a major bull leg in Europe, much like how the U.S. FANGs led global markets in 2008.
The full post can be found
here.