Wednesday, June 30, 2010

Stronger than a soaring RMB

There has been much angst in the aftermath of the Chinese announcement of further currency flexibility. Despite the hoopla, the RMB barely budged against the USD in the wake of the news.

The source of friction in Sino-American relations is the US-China trade gap. There are some other adjustments in evidence that could close the gap, notwithstanding any change in exchange rate. Firstly, on the China side, the Chinese minimum wage went up by 20% in early June. In addition, an article in  Bloomberg/Business Week states that American companies are getting better quality local workers at a cheaper price as the discouraged unemployed take a job...any job:

The 6.8 million Americans out of work for 27 weeks or longer -- a record 46 percent of all the unemployed -- are providing U.S. companies with an eager, skilled and cheap labor pool. This is allowing businesses to retool their workforces, boosting efficiency and profits following the deepest recession since the 1930s.
Rising wages in China and falling wages in the US makes the Chinese labor arbitrage less compelling. These factors are more powerful than the exchange rate adjustment the American politicians want to beat the Chinese over head about and should serve, in the long run, to alleviate some of the trade tensions.

…until multi-nationals migrate to even lower wage countries like Vietnam.

Monday, June 28, 2010

The austerity dilemma

As the G20 meeting get under way in Toronto, it is evident that not all is well and the posturing began long before the summit.

Despite the soothing offical pronouncements, it is evident that the US position is a source of division at the G20 meetings. In Europe, the cult of austerity has caught fire. The UK has passed a high profile austerity budget (see analysis here) and so has Germany. Nevertheless, the G20 remains divided. On this side of the Atlantic, US officials are urging G20 to avoid growth dampening budget cuts.

What gives?


The risks of fiscal austerity
Unfortunately, the answer to the fiscal austerity question isn't black and white. There is no question that countries cannot run these kinds of enormous deficits without getting into trouble. Deficit hawks point to the Britain under Margaret Thatcher and the benefits of that painful restructuring.

While the Thatcher experience is instructive, there is a differences between then and now. Thatcher’s Britain was the only country in the region to take the deficit reduction path at the time. It worked because of my favorite economist phrase "everything else being equal". What happens everything else wasn't equal and if everyone tries austerity at the same time? Martin Wolf of the FT explains [emphasis added]:

[S]uch thrift entails either current account surpluses or fiscal deficits. Of these countries, only Germany and Japan have current account surpluses. The rest are capital importers. These countries will duly run fiscal deficits that are bigger than their private surpluses. We have, as the hysterics note, a tide of fiscal red ink. Which came first – private retrenchment or fiscal deficits? The answer is: the former. In the case of the US, the huge shift in the private balance between the fourth quarter of 2007 and the second quarter of 2009, from a deficit of 2.2 per cent of GDP to a surplus of 6.6 per cent, coincided with the financial crisis. The fact that aggregate demand and long-term interest rates tumbled at the same time shows that the collapse in private spending “crowded in” the fiscal deficits. Wild private behaviour drove the wild public behaviour.

Yet it would now be particularly damaging for fiscal austerity to overcome the European economy and so force beggar-my-neighbour outcomes on the hapless US. As Fred Bergsten of the Peterson Institute for International Economics in Washington noted in the FT last week, such policies could be very dangerous. Thus, far from being stabilising, premature fiscal retrenchment threatens destabilisation of the world economy. In this case, a decision to turn the eurozone into a huge Germany would – and should – be seen as an act of mercantilist warfare upon the US. How long would the latter put up with the hypocrisy of surplus countries that blame borrowers for the deficits their own surpluses make inevitable? Not much longer, would be my guess, at least now that the US government has become the world’s borrower of last resort.to be a balance.
New Keynesians like Paul Krugman believe that it’s far too early for austerity and such policies would be disastrous for the world economy. Indeed, it may be somewhat early to implement austerity programs. In their book This Time is Different, economists Reinhart and Rogoff studied a range of financial crises throughout history and observed that government debt rises an average of 86% after a banking crisis.


The US states as fiscal laboratories 
Consider what would happen if that kind of budget cutting were to occur in the US. We have a laboratory in America: the states, which are required to be balance their budgets. The New York Times reports that individual states are starting to look like Greece. Time has written on the dire state of the states. California is on the verge of system failure and that experience is not isolated. Barry Ritholz pointed out that much of the state budget woes stem from unemployment. State budget austerity is therefore pro-cyclical, which would exacerbate the problem.


What about the muni market?
This is a recipe for disaster in the financial markets. The muni market seems to be oblivious to the coming storm. Minyanville recently reported that investors are flying to municipal bonds like moths to a flame. I agree with Rick Bookstaber that the municipal bond market is an accident waiting to happen.

What happens then? TARP for state and local governments? What happens to sovereign debt risk then?

Remember the adage that all politics are local and populist sentiment is sure to rise under such circumstances. The Globe and Mail quoted Warren Buffett as believing that bailouts are inevitable:


Billionaire Warren Buffett, who advised U.S. President Barack Obama during his White House run, suggested recently that a Washington bailout of California and other troubled states is inevitable. How, he wondered, can Washington deny California after saying yes to General Motors, AIG and dozens of banks.
Do we want to really want to see the US government pile on with fiscal austerity at the federal level?


No easy choices - Hurt now or hurt later?
I wrote before about an analytical framework for the deficit hawks. Economists at the BIS recently wrote a report the likely trajectory of government spending and the kind of reductions and actions that are required to bring deficits under control.

The Centre for Economic Policy Research recently released a discussion piece on the deficit reduction question and put the dilemma into perspective. The Economist recently had an article that explained the deficit conundrum more simply:

Debt is as powerful a drug as alcohol and nicotine. In boom times Western consumers used it to enhance their lifestyles, companies borrowed to expand their businesses and investors employed debt to enhance their returns. For as long as the boom lasted, Mr Micawber’s famous injunction appeared to be wrong: when annual expenditure exceeded income, the result was happiness, not misery.
Now comes the hangover. It’s a question of whether we want to hurt now or hurt later. There are no good choices. This is only a slight exaggeration but politicians who choose an effective “hurt now” option, as per the BIS analysis, could go down in history as the economic equivalent of the Pol Pot regime. The “hurt later” school, by contrast, are choosing the financial equivalent of releasing a latent Ebola virus into their population, to be manifested at some time in the future.

Thursday, June 24, 2010

Anxious markets = Volatile markets

Recently the IMF warned of the risks of hot money flows to emerging markets, otherwise known as "emerging asset" markets with limited liquidity. "Emerging asset markets" is a term coined by Ana Fostel and John GeanakoplosI in a paper entitled Leverage cycles and the anxious economy. In that paper, the authors detail “anxious economies” and how Minsky Moments (my term, not theirs) occur in them:

We distinguish three different conditions of financial markets: the normal economy, when the liquidity wedge is small and leverage is high; the anxious economy, when the liquidity wedge is big and leverage is curtailed, and the general public is anxiously selling risky assets to more confident natural buyers; and, finally, the crisis or panicked economy, when many formerly leveraged natural buyers are forced to liquidate or sell off their positions to a reluctant public, often going bankrupt in the process. A recent but growing literature on leverage and financial markets has concentrated on crises or panicked economies. We concentrate on the anxious economy (a much more frequent phenomenon) and provide an explanation with testable implications for (1) contagion, (2) flight to collateral, and (3) issuance rationing. Our theory provides a rationale for three stylized facts in emerging markets that we describe below, and perhaps also explains some price behavior of other “emerging asset” classes like the US subprime mortgage market.
The authors studied “emerging asset” economies, i.e. emerging markets, but they note that their analysis is applicable to some of the smaller liquidity constrained markets such as “the US subprime mortgage market”. In the paper, they introduce the concept of the “anxious economy”:

This is the state when bad news lowers expected payoffs somewhere in the global economy (say in high yield), increases the expected volatility of ultimate high yield payoffs, and creates more disagreement about high yield, but gives no information about emerging market payoffs. A critical element of our story is that bad news increases not only uncertainty, but also heterogeneity. When the probability of default is low, there cannot be much difference in opinion. Bad news raises the probability of default and also the scope for disagreement. Investors who were relatively more pessimistic before become much more pessimistic afterward. One might think of the anxious economy as a stage that is frequently attained after bad news, and that occasionally devolves into a sell-off if the news grows much worse, but which often (indeed usually) reverts to normal times. After a wave of bad news that lowers prices, investors must decide whether to cut their losses and sell, or to invest more at bargain prices. This choice is sometimes described on Wall Street as whether to catch a falling knife.

They go on to model how financial leverage exacerbate the booms and busts to create Minsky Moments in an anxious economy:

Agents are allowed to borrow money only if they can put up enough collateral to guarantee delivery. Assets in our model play a dual role: they are investment opportunities, but they can also be used as collateral to gain access to cash. The collateral capacity of an asset is the level of promises that can be made using the asset as collateral. This is an endogenous variable that depends on expectations about the distribution of future asset prices. Together with the interest rate, the collateral capacity determines an asset’s borrowing capacity, which is the amount of money that can be borrowed using the asset as collateral. The loan to value (LTV) of an asset is the ratio of the asset’s borrowing capacity to its price. The haircut or margin of an asset is the shortfall of its LTV from 100 percent—in other words, the fraction of the price that must be paid in cash. The maximal leverage of an asset is the inverse if its margin. The leverage in the system, like the other ratios just mentioned, is determined by supply and demand; it is not fixed exogenously…

The underlying dynamic of the anxious economy—fluctuating uncertainty and disagreement— simultaneously creates the leverage cycle and the liquidity wedge cycle; that is why they run in parallel. Since leverage affects the liquidity wedge, the leverage cycle amplifies the liquidity wedge cycle. So what does collateral, and the possibility of leverage, add to the liquidity wedge cycle already discussed? It generates a bigger price crash, not due to asset undervaluation during anxious times, but due to asset overvaluation during normal times. This may lead the press to talk about asset price bubbles.

While the dynamic described by Fostel and Geanakoplos was intended to describe smaller emerging market economies, their description appears to sound an awful lot like the American and European economies in the current environment of rising concerns about sovereign debt.


Higher volatility ahead
One of the conclusions of the paper is that during and in the aftermath the downleg of the crisis, volatility is high because of a heightened liquidity wedge:

We define the liquidity wedge as the spread between the interest rate optimists would be willing to pay and the rate pessimists would be willing to take. As we shall see, the liquidity wedge is a useful way of understanding asset prices. When the liquidity wedge increases, the optimists discount the future by a bigger number, and all asset prices for which they are the marginal buyers fall. The liquidity wedge increases because the disagreement between optimists and pessimists about high yield grows, increasing the desire of optimists to get their hands on more money to take advantage of the high yield buying opportunity. The portfolio and consumption effects create a liquidity wedge cycle: as the real economy moves back and forth between the normal and the anxious stage, the liquidity wedge ebbs and flows.

The observation about higher volatility is consistent with my comments about rising volatility and the implications for investment policy. The chart below from Macquarie Research illustrates the environment of rising macroeconomic volatility.


Wayne Whaley of Witter & Lester has observed the same effect.


Jonathan Tepper of Variant Perception has commented on the same thing.


Examine investment policy assumptions
In the current environment of heightened macroeconomic volatility, which imply higher investment risk and uncertainty, investors need to re-think their approaches to investing and asset allocation. Buy-and-hold allocations may be suboptimal under such circumstances.

Tuesday, June 22, 2010

Inflation vs. deflation, revisited

I have written extensively before about the inflation vs. deflation dilemma. There are huge stakes and risks involved for investors. Get the call right and you’ll be a hero; get it wrong and you’ll be the goat.


Why are gold and US Treasuries rallying?
Now more and more people have weighed in on the debate. The Economist/Buttonwood blog recently asked the question "why are both gold and US Treasuries performing so well?" One would suppose that their returns should be polar opposites of each other. The answer is that the inflation and deflation views are increasingly becoming bifurcated among investors [emphasis mine]:

Martin Barnes of Bank Credit Analyst, a research firm, points out that the direction of official policy (low rates, quantitative easing, big deficits) looks inflationary but the economic fundamentals (a big output gap, sluggish credit growth) look deflationary. Faced with this dichotomy, investors who buy both Treasury bonds and gold are not displaying cognitive dissonance. They are just hedging their bets.

Inflation risks from the US printing presses
James Hamilton at Econbrowser believes that the current environment is deflationary, but he is worried about the seemingly inevitability of inflationary policies down the road:

The source of my concern about long-run inflation comes not from the expansion of the Fed's balance sheet, but instead from worries about the ability of the U.S. government to fund its fiscal expenditures and debt-servicing obligations as we get another 5 or 10 years down the current path. Just as many analysts have had trouble seeing how Greece can reasonably be expected over the near term to move to primary surpluses sufficient to meet its growing debt servicing costs, I have similar problems squaring the numbers for the U.S. looking a little farther ahead.

The way that I would envision these pressures translating into inflation would be a flight from the dollar by international lenders, leading to depreciation of the exchange rate, increase in the dollar price of traded goods, and possible sharp challenges for rolling over U.S. Treasury debt. We've of course been seeing the exact opposite of this over the last few months, as worries in Europe and elsewhere have resulted in a flight to the dollar and the perceived safety of U.S. Treasuries. That appreciation of the dollar has been one factor keeping U.S. inflation down. So any inflation scare is clearly not an incipient development, but instead something we'd possibly face farther down the road.

Developments are policy dependent
David Merkel at Aleph Blog wrote about the Social Security time bomb [emphasis added]:

There are no good solutions now. Budgetary cuts and tax increases reduce the possibility of government default. They also will tend to slow the economy, unless the tax increases stem from cutting cheating, and the budget cuts affect only things that are a fraudulent waste.

Once you reach the point of no return, it doesn’t matter what prescriptions one follows — failure is coming. One can shape the type of failure, but not that there will be failure.

All that said, there are still options, though none of them are good. Will the currency be inflated? Will the government default? Will taxes be raised dramatically? I don’t know. Be alert; be ready. The endgame is here; we will see what moves the government makes.
I agree with Merkel. The government seems unwilling to make the hard choices so the collapse is coming. The kind of collapse is entirely dependent on policy…and we have no idea which path the authorities will choose (or humorously, what the consequences are, hat tip to Crossing Wall Street).


Buy-and-hold asset allocation = riding a salt-n-pepper ride at the carny
For investors, Cassandra does Tokyo draws the parallel of the current inflation/deflation situation to being on a "salt-n-peper" ride at the carnival, a musical metronome, the Newtonian pendulum, or the sand-weighted Punching Dummy:
Humanity, in general, their households, and their sovereign and corporate institutions alike will undoubtedly take hits - many hits, and from all sides - but life will go on, and as in post-war Europe, Lebanon, Argentina, Turkey, Serbia, and other seemingly unimaginable examples to our unpracticed imaginations, it will rebound and rise again, in fits, starts, almost randomly lurching to' and fro', before balancing upright again - if only to have the collective shit kicked out of it yet another time...
Under such a volatile environment, preserving financial staying power will be of utmost importance. Fixed buy-and-hold asset allocation solutions will doom an investor to mediocre returns in such conditions. Investors need to go back to basics and rethink their asset allocation assumptions. It's time to stay flexible with the use of dynamic asset allocation techniques such as the Inflation-Deflation Timer model to survive the coming crisis.

Monday, June 21, 2010

Apocalypse avoided, for now

Last week I wrote about the possibility of another financial Armegeddon:

I have become increasingly concerned about the markets and the economy, largely because of the poor behavior of economically sensitive commodity prices. If the current commodity weakness were to persist, then conditions may be setting up for a repeat of the Great Bear of 2008.
In a subsequent post, I set out some goals for the bulls to achieve in order to stave off a “deflation” signal on my Inflation-Deflation Timer model which would signal the kind of waterfall decline that the markets saw in 2008. I pointed to copper prices and the relative price behavior of the Morgan Stanley Cyclical Index (CYC) against the market.

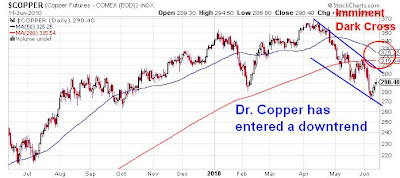
In the last week, the bulls did manage to rally the markets and achieve a stalemate with the bears, which is a victory of sorts. Take a look at the price of Dr. Copper, which rallied up through the downtrend line but ended the week lower. This may be a signal of underlying strength and a sideways pattern rather than a continuation of the downtrend. Nevertheless, a “dark cross” is imminent in copper prices indicating the development of an intermediate term downtrend.


A similar picture was seen in the relative chart of CYC vs. SPX. CYC rallied through the downtrend line but weakened again which points to a possible sideways consolidation pattern.


The good news
There are signs of good news. David Leonhart at Economix reports that private hours worked are rising in the US, which indicates that the economy is rebounding:


Jeff Matthews wrote that corporate management is reporting signs of nascent economic strength, both in the US and Europe. Such bottom-up reports from the ground are always useful antidotes to the top-down analysis from 50,000 feet.

There is good news in China. China’s economy is slowing but may be headed for a soft landing. Jeremy Grantham was quoted as China may avoid a housing bubble. The vestiges of a command economy still remain in China and her policies seem to veer between flooring the accelerator and stomping on the brakes. It appears that the authorities have decided that they have stomped on the brakes too much and it’s time to step on the gas pedal again. The Shanghai Composite appears to be finding a floor at current levels and there are signs that China’s plunge protection team is going into action ahead of the Agricultural Bank's ginormous new stock issuance.

In addition, the People’s Bank of China announced on the weekend that they are preparing for “currency flexibility”, which is code for an easing or elimination of the RMB to USD peg. Such a move would serve to ease trade tensions ahead of the G20 meeting.


Eye of the storm
Where are we now? Todd Harrison believes that we are currently in the eye of the storm and I agree with that assessment:

We've been pushing risk further out on the time continuum for such a long time that it's become an accepted -- dare I say normalized -- pattern that interconnects the world through a tangled web of derivatives.

While the recent price action has been docile, I believe we're in the eye of the storm, a relative calm between the first phase of the financial crisis and the cumulative comeuppance that'll flush -- and perhaps reset -- the system.

Harrison went on to view any downturn with a sense of optimism, because of the possibility of renewal:

I view the Great Depression as the framework for optimism. Most of society worked, great discoveries were made and formidable franchises were established.

Indeed, if the greatest opportunities are bred from the most formidable obstacles, we're about to enter a most auspicious era.

Unfortunately, I don’t share his optimistic view as I believe that the extrapolation of the American experience in the Great Depression to today has survivorship bias problems (see my comment here about what happens in the really long run). What if America today is not the America of the 1920s or 1930s, but the Britain, France or Germany of the same period? Those were the great developed market economies of the time too.

I do agree, though, with Harrison’s assessment that we are in the “eye of the storm”. We could very well be moving into Act II of the financial crisis, as postulate by George Soros as we move through the eye of the hurricane to the other side.


A time for caution
Despite the rally in risky assets last week, it's a stalemate and it would be premature to conclude that the bulls have the upper hand. The markets remain on a knife edge as the technical picture remains mixed. The above charts of copper and CYC to SPX show rallies through the downtrend but weakness back below the trend line. Could this be a headfake? Indeed, some Dow Theorists believe that the bull may be near death. The copper/gold ratio is also pointing to further stock market weakness.

Mish wrote that the Philly Fed survey, which came out last week, shows signs of weakness and the growth risks remain tilted to the downside. The ECRI Leading Indicator released on Friday continued to weaken from its negative reading the previous week. As well, the Baltic Dry Index is turning down again, indicating slowing global trade.

Despite my reservations about the downside risks, I am not panicking and I continue to maintain the discipline of adherence to the asset allocation based on the results of the Inflation-Deflation Timer model. Trader's Narrative's weekly summary sentiment surveys show that readings are not at extreme levels and give little insight to near-term market direction.

Regardless of the current model reading, the global economy and markets remain in a fragile state. The Inflation-Deflation Timer model is a trend following model and is not designed to spot tops or bottoms, but trends. Should the economy and markets turn south, there will plenty of time to capitalize on the trend.

I can only trade what I see and the current picture is neutral.

Thursday, June 17, 2010

Remind me...why I am paying 2 and 20?

My very first post on this blog was to question what exactly are hedge funds hedging? My principal objection was that hedge funds were one giant risk trade and aggregate hedge fund returns were correlated with stock returns. Now nearly three years later, nothing has changed. The latest figures from HFRX show their global hedge fund index to be slightly down for the year after suffering a horrible May, just like equities:


What's more, Byron Wien recently spoke out to say that he believes that the hedge fund industry may have to engage in more risk control, which will serve to depress returns (and volatility). This is a clear indication of over-capacity in the hedge fund industry, of too many players chasing too little alpha.

Remind me again, why are investors paying the big 2 and 20 fees for these equity-like returns?

Wednesday, June 16, 2010

Escape by arbitrage

Rick Bookstaber has a great post up about the weaknesses of any potential financial regulation. You can escape it by regulatory arbitrage by picking and choosing your regulator.

Macro Man, on the other hand, has a better idea in this environment of higher taxes and goveernment regulation:
I have had in the back of my mind for many years that a large consortium of the mega-rich, private and corporate, should buy Eritrea from its owners and build a low tax, regulation free Utopia. The Country motto being Caveat Emptor and the only rule being, in Mad Max style
But serious, folks...

Madness over. However, there is one country that is quietly shaping up to be a pretty good contender for the role of off-shore Europe..... The new Carthage. Have you seen what Libya are up to these days?
The ultimate escapes, but be careful about what you wish for.

Tuesday, June 15, 2010

Trailing by 2, bottom of the 9th

Further to my last post entitled Are the markets setting up for a repeat of 2008, I received a couple of emails from readers asking exact how much commodity prices need to rally to negate the potential “deflation” reading on the Inflation-Deflation Timer model.

The exact details of the Inflation-Deflation Timer model are proprietary, but I can answer that question in a number of indirect ways that address the big picture.

In general, I would characterize current market conditions as being akin to being in the bottom of the ninth inning, with the bulls trailing by two runs, with two outs and one man on base. The bulls still have a chance to tie the game but they face an uphill battle.


I see downtrends…
Putting my technician's hat on, I noted in my last post that Dr. Copper was in a downtrend. I would like to see a cyclically sensitive metal such as copper rally to break the upper band of the downtrend line before I feel comfortable that the threat of a deflationary panic has subsided.


The relative chart of the Morgan Stanley Cyclical Index (CYC) compared to the market tells the same story. CYC broke down out of a relative uptrend in mid-May and is now testing the upper band of a relative downtrend line. I would like to see CYC/SPX line to decisively break out of its relative downtrend line as a signal that the US economy is not moving into double-dip territory.


Over the weekend, I read other technicians coming to the same conclusion (a typical example here). The market is in a downtrend, but there has been support evident at the 1044 level on the SPX. While the existence of the downtrend suggests that the bears have the slight upper hand, technicians cannot discern a direction until the pattern is resolved (either by upside breakout or by support violation).


Macro forecasters: High risk zone
From a macro-economic perspective, respected forecasters are confirming my ninth inning assessment that the US economy is at serious risk of a double-dip recession. David Rosenberg (free registration required) wrote on Monday that the latest reading in the ECRI Weekly Leading Indicator shows an 80% probability of a double-dip recession:

[W]e can safely say that this barometer is now signalling an 80% chance of a double-dip recession. It is one thing to slip to or fractionally below the zero line, but a -3.5% reading has only sent off two head-fakes in the past, while accurately foreshadowing seven recessions — with a three month lag. Keep your eye on the -10 threshold, for at that level, the economy has gone into recession … only 100% of the time (42 years of data).

John Hussman of Hussman Funds came to a similar conclusion as Rosenberg and me. In his latest weekly comment, Hussman notes that the conditions for forecasting a double-dip recession are almost all fulfilled. It is possible, however, that his indicators could strengthen and a double-dip is avoided.

In short, both the technical and top-down macro picture are telling the same story. The bears are leading in the bottom of the 9th inning. Can the bulls rally and tie the game?

Monday, June 14, 2010

Are the markets setting up for a repeat of 2008?

I have become increasingly concerned about the markets and the economy, largely because of the poor behavior of economically sensitive commodity prices. If the current commodity weakness were to persist, then conditions may be setting up for a repeat of the Great Bear of 2008.


Commodities are signaling trouble
As an example, the price of Dr. Copper, which earned its nickname of having a Ph.D. because of its ability to forecast downturns, is in a downtrend and on the verge of a dark cross.


The Reuter/Jeffries CRB Index has already exhibited a dark cross.


Ominous readings from the Inflation-Deflation Timer model
My Inflation-Deflation Timer model, which is a trend following model based on the price movement of commodity prices, is on course to flash a “deflation” signal the week of June 21 unless commodity prices stage a strong and broad based rally from current levels.

My concern stems from the quick transition from an “inflation” signal to a potential “deflation” signal. The model only moved from an “inflation” reading to “neutral” in early May. For the model to go from an “inflation” to “deflation” reading in six weeks is highly reminiscent of the Lehman crisis experience of 2008.

The chart below shows the model signals for the critical period from December 2007 to December 2009. The black line shows the cumulative simulated returns of the Inflation-Deflation Timer model, where the red line shows the cumulative returns of equities, the purple line commodities and the green line the US long Treasury Bond. The pink shaded area indicate periods when the Inflation-Deflation Timer showed an “inflation” signal, the white areas a “neutral” signal and the light blue areas a “deflation” signal.

Anatomy of a Financial Crisis

In 2008, the model moved turned “neutral” from an “inflation” reading in late June and went to a “deflation” reading in early August, in the space of about five weeks. Financial markets were already tanking during the July transition period when the model reading was “neutral”. As the model went to “deflation” signal, the markets panicked and went into freefall because of the Lehman crisis and virtual all asset classes got clobbered.

While in 2008 the Inflation-Deflation Timer correctly moved to the safety of US Treasuries during the Lehman crisis and then rotated back into risky asset classes as the crisis ebbed, I remain concerned about the current backdrop of market psychology and macro-economic landscape. Today, we have a similar situation where model readings are potentially transitioning quickly from an “inflation” to “deflation” reading, which is highly unusual, and financial markets are jittery and under stress.


Is this just a correction or something worse?
To be sure, we may not see a 2008-like waterfall decline because markets are oversold and may have begun a reflex rally. Investor sentiment remains bearish, which is contrarian bullish. The blog post at Trader’s Narrative put the sentiment picture into context. Current readings are consistent with a market bottom if this is a run of the mill correction, but not extreme enough for a bottom if the recent action represents the re-emergence of a bear run.

What if this is the re-emergence of a bear market? There is good support for such a thesis. George Soros recently warned that we are now in Act II of the global economic crisis. John Hussman also warned about “Aunt Minnie” type conditions in his market comment dated May 24, 2010 [emphasis added]:

Such indicator subsets, or Aunt Minnies, are essentially "signatures" that often have very specific implications. In medicine, an Aunt Minnie is a particular set of symptoms that is “pathognomonic” (distinctly characteristic) of a specific disease, even if each of the individual symptoms might be fairly common. Last week, we observed an Aunt Minnie featuring a collapse in market internals that has historically been associated with sharply negative market implications…

Historically, we can identify 19 instances in the past 50 years where the weekly data featured broadly negative internals, coupled with at least 3-to-1 negative breadth, and a leadership reversal. On average, the S&P 500 lost another 7% within the next 12 weeks (based on weekly closing data), widening to an average loss of nearly 20% within the next 12 months - often substantially more when the Aunt Minnie occurred with rich valuations and elevated bullish sentiment.
Even Paul Volcker, the former central banker who is so circumspect that he once quipped that when he went out for dinner, he would say that “I’ll have the steak, but that doesn’t mean I don’t like the lobster”, has become vocal about his own pessimism: “I don’t remember any time, maybe even in the Great Depression, when things went down quite so fast, quite so uniformly around the world.”

In addition, ECRI confirmed Volcker's view of economic weakness as its weekly leading indicator (WLI) turned negative last Friday. However, Lakshman Achuthan of ECRI qualified the negative reading and indicated that the negative reading is not a forecast of recession but a forecast of slower growth.

Don't panic yet
What should investors do in the face of this negative and high risk backdrop?

From my own viewpoint, I am maintaining the discipline of adherence to the Inflation-Deflation Timer model and I am not in the business of anticipating signals. At this point, I would not batten down the hatches or run for the hills - yet. However, these conditions are creating a high degree of concern about the near-term downside potential of returns for many asset classes.

However, the possibility of such a negative signal makes me ever cautious. Commodity markets need to stage a significant rally this week to negate the potential negative signal next week.

It’s not time to run into the bomb shelter, but it wouldn’t hurt to crack open its door.

Thursday, June 10, 2010

An analytical framework for deficit hawks

There has been some buzz as David Cameron gave a hint of the budget cuts to come in the UK as its credit rating is at risk of a downgrade. While it is unclear how much austerity is possible under a coalition government, the market appears to be anticipating some fairly tough measures.

While we are on the topic of cutting government budgets, Angela Merkel has also announced some draconian measures in Germany. Observers are now asking about the Canadian fiscal “miracle” (see discussions here and here). To me, it doesn’t feel like a “miracle”, but happenstance that was the result the combination of austerity, a bull market and the decision not to go overboard on military expenditures. Recall that at the end of the Clinton era, both the American and Canadian fiscal budgets were in surplus, artificially buoyed by capital gains from the Tech Bubble market. In the wake of 9/11, the US embarked on a series of military adventures and keeled over into deficit, while Canada only made a limited commitment and remained in surplus for a few more years.


Putting any cuts into perspective
It is beyond the scope of this post to comment on the pros and cons of fiscal tightening at this stage of the economic cycle. That dilemma is not insignificant but further discussion of those issues will have to be delayed to another day. Nevertheless, to the deficit hawks who are reading this, I would caution that you should put any budget cuts from any government into the following perspective.

I had discussed the BIS report entitled The future of debt prospects and implications before. The chart below is from the report and shows the projected debt to GDP ratios of Europe, Japan and the United States for the next 30 years. The red dotted line depicts the baseline scenario, which assumes that assume that government total revenue and non-age-related primary spending remain a constant percentage of GDP at the 2011 OECD projected levels. The green line assumes budget cuts of 1% of GDP for five years starting in 2012. The blue line assumes deeper cuts to entitlement programs, e.g. pension benefits, etc.


The UK chart on the bottom row shows budget balances spiraling out of control in all three scenarios. By contrast, the announced German cuts amount to about 0.7% of GDP per year for the next four years, which falls short of the BIS projection of 1% of GDP.


A framework for analysis
Budget cutting isn’t easy for fiscal authorities. Paul Krugman characterized the US government as a giant insurance company with a military. The key items to watch are the cuts to entitlement programs (i.e. pensions, health care benefits, especially given the higher demands of an aging population). Paul Volcker recently raised the issue of dealing with these long-tailed liabilities of government because "the time we have is growing short":
Restoring our fiscal position, dealing with Social Security and health care obligations in a responsible way, sorting out a reasonable approach toward limiting carbon omissions, and producing domestic energy without unacceptable environmental risks all take time. We’d better get started. That will require a greater sense of common purpose and political consensus than has been evident in Washington or the country at large.
For investors, evaluating the effectiveness of any fiscal austerity program isn't easy either. It can be hard to cut through the ideological noise and baggage that burden all of us. However, things become much clearer once we use the analytical framework as outlined by the BIS report.

Wednesday, June 9, 2010

Signs of the times

Here are a couple of noteworthy items that have recently come across my desk:

Al Qaeda on Strike
BBC News - Muslim suicide bombers in Britain are set to begin a three-day strike on Monday in a dispute over the number of virgins they are entitled to in the afterlife. Emergency talks with Al Qaeda have so far failed to produce an agreement.

The unrest began last Tuesday when Al Qaeda announced that the number of virgins a suicide bomber would receive after his death would be cut by 25% this February from 72 to 60. A company spokesman said increases in recent years in the number of suicide bombings have resulted in a shortage of virgins in the afterlife.

The suicide bombers' union, the British Organization of Occupational Martyrs ( or B.O.O.M. ) responded with a statement saying the move was unacceptable to its members and called for strike vote. General Secretary Abdullah Amir told the press, "Our members are literally working themselves to death in the cause of Jihad. We don't ask for much in return, but to be treated like this is like a kick in the teeth".

Speaking from his shed in Tipton in the West Midlands , Al Qaeda chief executive Osama bin Laden explained, "I sympathize with our workers' concerns, but Al Qaeda is simply not in a position to meet their demands. They are simply not accepting the realities of modern-day Jihad in a competitive marketplace. Thanks to Western depravity, there is now a chronic shortage of virgins in the afterlife. It's a straight choice between reducing expenditures or laying people off. I don't like cutting benefits, but I'd hate to have to tell 3,000 of my staff that they won't be able to blow themselves up."

Spokespersons for the union in the North East of England , Ireland , Wales, and the entire Australian continent stated that the change would not hurt their membership as there are few virgins in their areas anyway.

According to some industry sources, the recent drop in the number of suicide bombings has been attributed to the emergence of Scottish singing star, Susan Boyle. Many Muslim jihadists now know what a virgin looks like and have reconsidered their benefit packages.


What sovereign risk?
The Economist/Buttonwood blog reports that the yield on Thai government debt is now about the same as US Treasuries.

Tuesday, June 8, 2010

It takes a village...

Regular readers will know that while I have a bearish bias, my inner trader believed that the market is oversold and ripe for a rally, which has so far not materialized. In the last few days, there were a number of analysis showing that we are as oversold or sentiment washed out at levels last seen during the February lows. This comment from Technical Take is a typical sample:

Judging by the emails I receive, it seems to be hard for investors to grasp the idea that I view the current market environment as a "fat pitch". If we use the analogy of a card counter in black jack, I can only determine when I bet aggressively. I cannot guarantee that I will get a winning hand even though the cards should be in my favor. Nonetheless, I would always prefer to bet when the chance for strong gains is likely. This is just one aspect of the "fat pitch". The other aspect and it may be more important than all those potential gains is that a failed signal tends to portend a poor outcome for the markets. Based upon my data, I have clearly defined risk parameters, and this is what is so good about the "fat pitch" --possibility for strong gains plus the ability to define my risk.

How things might be different
It is useful from a trader’s perspective that Technical Take qualified his comments about entering a trade with “defined risk parameters” and that “a failed signal tends to portend a poor outcome for the markets.”

Having waited in vain for a market rally, my inner trader is now tilting from bullish to bearish. The primary reason is that whereas in February, when the bulls were still in control of the tape, today the bears are in control. The change in trend is evident as there are now death crosses everywhere in large cap stocks.

There are systemic risks everywhere. A contact at a major brokerage firm recently informed me that leverage is still on at hedge funds and major institutional long-only accounts are still positioned for a recovery and not a correction. As good traders know, overbought markets can get more overbought and oversold markets can get more oversold. If bearish momentum continues to carry the day, then there is still a lot of pent-up selling to be done.

What’s more, Mr. Market seems to be infected by a global contagion. Free market economists generally believe that markets are self-correcting (and therefore oversold bounces are more likely) because there are many independent market participants expressing their views. What if the views aren’t independent but self-reinforcing? Macro Man details how self-reinforcing these views might be [for the newbies, the term "spoos" refer to the S&P 500]:

"Well it’s definitely the equity markets driving this", say the FX boys, "If Spoos drop we sell Yen crosses, so they must be driving it"...

"Can't be us", reply the equity boys, "We just sell when we see the Yen rally or spreads widen"... Oooops, don't like the sound of this...

Must be those bond boys then...? "Nah not us, we buy bunds when we see Yen strengthen and equities drop and when Libor tightens".

Must be the short term cash boys then...? "Not us, we just demand more when we see Yen rally, stocks drop, bonds rally and if one of those central banks say the banks need to increase capital requirements when they can't..."
Hillary Clinton famously wrote a book called It Takes a Village detailing how interconnected people are as a celebration of community.

I am not so dogmatic as to be married to any single model of the markets. I only trade what I see. Right now, the lack of any substantial reflex rally on Monday after Friday's precipetous drop must be a concern for the bulls.

If financial markets are indeed interconnected and the whole village is arrayed against you, then it’s time to watch out for downside risks. But regardless of your bullish or bearish views, I agree with the views of Technical Take (see above). This is an extremely volatile market and it's important to define your risk parameters.

Monday, June 7, 2010

Asset allocation: Back to basics

In the June 2nd edition of Breakfast with Dave (free registration required) by Dave Rosenberg of Gluskin Sheff, Rosenberg writes:

The name of the game is to focus attention on strategies that:
  • Delivers income (including dividend growth, hybrid funds and corporate bonds since company balance sheets are in fine shape);
  • Minimize volatility and emphasize on capital preservation in a secular bear market (true long-short “hedge fund” portfolios), and;
  • Commodities (precious metals as a “buffer” in a financially unstable world; and industrial commodities to take advantage of (i) the secular growth dynamics in Asia, and (ii) repeated rounds of currency depreciation inevitably lead to trade protectionism and “security of supply” constraints, which tend to benefit basic materials.

I have the greatest of respect for Dave Rosenberg. In the current environment of economic uncertainty and volatility, this is the most reasonable asset allocation that I can think of. However, there are a lot of macro risks out there, namely an implosion in Europe, a hard landing in China, risks to the US banking system from another round of residential mortgage resets, from commerical real estate, an imploding muni market and others. Depending on if and how things implode, a portfolio that focuses on income bearing securities may be a source of instability.

I believe that Rosenberg intuitive understands the weakness of a buy-and-hold allocation as he went on to quality his statements in the following way:
This by no means suggests that now is the time to load up on resources seeing as they are cyclical in nature and prone to sharp short-term swings — but commodities are in a secular bull market so these periodic spasms offer nice long-term buying opportunities. Defense stocks — hardly politically correct but I don’t claim to be a saint — should also be considered seeing as global military conflicts tend to follow suit, if history repeats itself, in the context of these global financial crises (Turkey is all of a sudden a big power broker, and not necessarily in a very stable fashion). Investors should focus their attention on the currencies and government bonds of countries whose public balance sheets are truly AAA rated — low debt ratios, low primary or structural deficits and with stable banking systems: these would include Canada, Australia, New Zealand, Norway, Sweden and Switzerland.

Towards a new asset allocation framework
James Montier of GMO recently wrote a research article that expresses my view in a much more articulate fashion on asset allocation.

Typically, analysts derive an efficient frontier based on the past performance, volatility and correlations of returns of different asset classes. From this efficient frontier, it is said that and investor can trade off between risk and return to build an “efficient portfolio”.


While many believe that diversification is the only free lunch to be had, many of the effects of diversification disappear when you need it the most – during panic episodes such as we saw in the Lehman crisis, the Russia crisis, etc. The basic assumption in a buy-and-hold asset allocation is that correlations and volatility estimates are stable. What happens when return correlations converge to 1 as they do during panic episodes?

Putting it in geek-speak, Tony Cooper wrote the following in his National Association of Active Investment Managers' 2010 Wagner award winning paper entitled Alpha Generation and Risk Smoothing using Volatility of Volatility [emphasis mine]:
In traditional asset allocation vovo [volatility of volatility] has a cost. As an example, consider a balanced-fund manager who uses, say, bonds to reduce the volatility of a fund which contains equities. Or a financial planner who assesses the risk tolerance of a client investor and proposes, say, a 60-40 equities-bonds mix. The traditional way of managing these investments is to look at the long term historical volatility of the component asset classes to decide the proportions to invest in. Usually no consideration is given to the vovo of the asset classes and no constant volatility target is set. So the investor or manager with a static or reasonably constant 60-40 mix has to suffer the varying volatility of the markets. sometimes sleeping well at night, occasionally not. In order to ensure that the worst volatility is minimised the asset allocation will have erred on the side of conservative. This will have cost returns.

The chart below shows the level of volatility in the OECD leading indicator, which point to an environment of rising macro volatility. How stable are asset return correlations and asset price volatility estimates under these conditions?


Volatility of OECD Leading Indicator
Montier made more points about the problem with static buy-and-hold framework to asset allocation, including:

  • Confusing risk with volatility
  • Not considering valuation risk, or the instability of the equity risk premium
  • How benchmarking alters manager behavior
He also points out a whole host of other important issues. Go read it all.


Back to basics
Fixed asset allocation makes good sense in secular bull markets. In a secular bear market or in a range bound market, fixed allocations will be of little use and will result in subpar returns.

I would suggest a back to basics approach to portfolio construction. The first step is to look at the problem from an analytical point of view instead of relying on estimates of volatility and correlation based on historical data. Why is X correlated or uncorrelated to Y and why? Look for causality (e.g. when interest rates rise, bond prices fall) instead of historical correlations.

Think about how different assets behave under different macro risk scenarios. Where does an investment asset lie on the risk vs. safety scale?  As an example, consider the tradeoffs between equities vs. default-free government paper. For example, are emerging market equities more or less risky than developed market equities given the higher secular growth exhibited by emerging market economies? My answer: in the long run, EM is probably less risky than traditionally perceived but in a meltdown scenario, they are more volatile.

If you are reaching for yield, where do REITs sit on the risk vs. safety scale? How would they behave in a market panic?

As a second step, you can then assemble a portfolio based on sensible estimates of diversification effects.

For bonus points, you can move from a fixed allocation buy-and-hold framework to a dynamic allocation framework based on forecasts of risk, using a combination of factors such as valuation, momentum, sentiment, etc.

Friday, June 4, 2010

Double-dip ahead?

As Mr. Market waits for the US Non-Farm Payroll release, it is useful to reflect upon the fact that real-time market indicators seem to point to a pending double-dip recession. A recent Bloomberg report highlighted the following observations from the market:

  • The Journal of Commerce Industrial Price Commodity Smoothed Price Index, where half the items it tracks don’t trade on futures exchanges and therefore a better sign of actual economic activity, is plunging.
  • Manufacturing indices are sliding, such as China’s Purchasing Manager Index, as well as indicators in the Eurozone and the ISM survey in the US.
The Economist/Buttonwood blog concurred with the above points and added the following negative signs:

  • Stocks are correcting;
  • The 10-year U.S. Treasury yield are dropping; and
  • The money supply in Europe and the US is flat or falling.
...with the only positive sign as the upward sloping shape of the yield curve. FT Alphaville also highlighted this week some of the risks to the US commercial real estate market that I wrote about before are now rearing their ugly heads.

Speaking of NFP, Barry Ritholz at The Big Picture analyzed the correlation between the ISM Manufacturing Index and NFP and asks the question: “Is this as good as it gets?”


Market sentiment still upbeat
Intermediate term sentiment indicators are still worrisome as Bespoke pointed out that the Street’s investment strategists remain bullish, which is contrarian bearish.

Given the recent change in tone in the market action, I believe that investors should be adopting a more defensive posture in their asset allocation.

Tuesday, June 1, 2010

An acid test for the markets

How a jittery market react to news is an important test of future direction.

Consider the news over the weekend of the Israeli raid on the aid flotilla that left at least 10 dead. (The fact that one of the ships was called the Rachel Corrie does not help Israel's image.)

I am not here to judge who is right or wrong, but to see how events like this affect market reaction. Turkey has called for an emergency meeting of NATO, the implication being that she could invoke Article 5 of the NATO Charter which states that an attack on any member state is an attack on NATO itself [emphasis added]:

The Parties agree that an armed attack against one or more of them in Europe or North America shall be considered an attack against them all and consequently they agree that, if such an armed attack occurs, each of them, in exercise of the right of individual or collective self-defence recognised by Article 51 of the Charter of the United Nations, will assist the Party or Parties so attacked by taking forthwith, individually and in concert with the other Parties, such action as it deems necessary, including the use of armed force, to restore and maintain the security of the North Atlantic area.
Turkey invoking Article 5 would  be the nuclear diplomatic option for that country. At the time of this writing Ankara is raising the stakes by threatening to escort future aid convoys with the Turkish navy. Such actions would threaten the NATO alliance in so many ways that I couldn't even begin to name. Not only that, such a rupture may not be taken kindly by the markets.

When the bulls were in control of the tape a few months ago, the markets would have shrugged off this news. Today, with the markets jittery but deeply oversold, such an event serves as an acid test to see whether the bulls, bears or the undecideds are in control.