Showing posts with label investment strategy. Show all posts

Saturday, March 28, 2026

Some Final Words on the Market Outlook

This is my last strategy publication before my retirement at the end of March and I would like to conclude with some final words on the intermediate-term outlook for stocks. (I will be publishing a final technical analysis review tomorrow).

Let’s begin with the good news. My long-term timing model is still bullish on the U.S. stock market. As a reminder, this model flashes a buy signal whenever the monthly MACD of the broadly based NYSE Composite (bottom panel) 
 
Ozan Tarman, vice chair of global macro at Deutsche Bank, revealed in a Bloomberg podcast that in speaking to global macro hedge funds, he concluded that the pain trade is a squeeze higher, though the left-tail of the return distribution is quite fat.

The full post can be found here.

Saturday, December 27, 2025

How the Investing Game is Changing

Preface: Explaining our market timing models 
We maintain several market timing models, each with differing time horizons. The "Ultimate Market Timing Model" is a long-term market timing model based on the research outlined in our post, Building the ultimate market timing model. This model tends to generate only a handful of signals each decade.

The Trend Asset Allocation Model is an asset allocation model that applies trend-following principles based on the inputs of global stock and commodity prices. This model has a shorter time horizon and tends to turn over about 4-6 times a year. The performance and full details of a model portfolio based on the out-of-sample signals of the Trend Model can be found here.

  
My inner trader uses a trading model, which is a blend of price momentum (is the Trend Model becoming more bullish, or bearish?) and overbought/oversold extremes (don't buy if the trend is overbought, and vice versa). Subscribers receive real-time alerts of model changes, and a hypothetical trading record of the email alerts is updated weekly here. The hypothetical trading record of the trading model of the real-time alerts that began in March 2016 is shown below. 

 
The latest signals of each model are as follows:
  • Ultimate market timing model: Buy equities (Last changed from “sell” on 28-Jul-2023)*
  • Trend Model signal: Bullish (Last changed from “bearish” on 27-Jun-2025)*
  • Trading model: Neutral (Last changed from “bullish” on 26-Nov-2025)*
* The performance chart and model readings have been delayed by a week out of respect to our paying subscribers.

Update schedule: I generally update model readings on my site on weekends. I am also on X/Twitter at @humblestudent and on BlueSky at @humblestudent.bsky.social. Subscribers receive real-time alerts of trading model changes, and a hypothetical trading record of those email alerts is shown here.

Subscribers can access the latest signal in real time here.

A Lifetime Paradigm Shift

The year is almost over, and it's time to reflect on the tumultous time investors have experienced. In particular, Trump's trade war has caused an unexpected response and volatility. The markets were initially rattled by his "Liberation Day" announcements. Calm set in once it became apparent that major trading partners didn't retaliate, except for China and stocks turned risk-on and bond yields fell. 
 

The trade war was only the beginning. When I announced in March that I was shutting down, I didn't expect the financial markets were going to experience a paradigm shift of a lifetime. The White House release of the National Security Strategy (NSS) is just another manifestation of the paradigm shift that not only affects U.S. foreign policy, but basic assumptions about investing that I am not sure I know how to analyze anymore. 
 
The investing game is changing. It's time for me to leave.

The full post can be found here.

Tuesday, March 28, 2017

A passive index fund built to outperform?

A long time reader sent me this Seeking Alpha article entitled "Monish Pabrai Has Created An Index Fund Built To Outperform", which described a "passive index fund" built using the following three investment themes deployed in three portfolio buckets:
  • Share buybacks: Companies that are buying back their own shares
  • Selected value manager holdings: The holdings of 22 selected value managers, based on their 13F filings
  • Spin-offs: Companies that were recently spun off from their parent
It's difficult to have a detailed opinion on the pros and cons of this fund. That's because the article only described what this "index fund" would hold, it did not describe the portfolio construction method, or how much of each stock it would hold. So it`s impossible to understand the risk profile of the fund, the size of its factor exposures, as well as its sector and industry exposures.

All the marketing hype aside, this investing approach is really a re-packaged form of factor investing, otherwise known as "smart beta". Therefore investors who buy into such a vehicle should expect similar kinds of results as "smart beta", though in a multi-factor format.

The full post can be found at our new site here.

Friday, February 27, 2015

Will Bridgewater unleash Terminator-like alpha-bots?

There has been some buzz about this latest announcement from Bridgewater:
Ray Dalio’s $165 billion Bridgewater Associates will start a new, artificial-intelligence unit next month with about half a dozen people, according to a person with knowledge of the matter. The team will report to David Ferrucci, who joined Bridgewater at the end of 2012 after leading the International Business Machines Corp. engineers that developed Watson, the computer that beat human players on the television quiz show “Jeopardy!”

The unit will create trading algorithms that make predictions based on historical data and statistical probabilities, said the person, who asked not to be identified because the information is private. The programs will learn as markets change and adapt to new information, as opposed to those that follow static instructions. A spokeswoman for Westport, Connecticut-based Bridgewater declined to comment on the team.
I have much respect for Bridgewater and AI applications, but this latest initiative is unlikely to unleash an army of Terminator-like robots that relentlessly seek out alpha in the investment business.

Let me explain why. The classic approach of evaluating an investment manager is through the 4 or 5Ps:

  1. People: Who are they? What are their pedigrees? What is their experience, legal and regulatory history, etc.
  2. Performance: What are the returns? What is the risk profile, etc.
  3. Philosophy: Why do you think you have an alpha? What distinguishes you from the other managers?
  4. Process: How do you implement your stated investment philosophy?
  5. Portfolio (optional): Does your portfolio reflect what you said about your investment philosophy and process?
The problem with AI systems that learn from past history and its mistakes is that they are notoriously difficult to debug. When something goes haywire, it becomes virtually impossible to walk back the steps that led to the misstep. Was the bad decision a bug, or a feature? It is very difficult to tell.

In the framework of the Ps, it becomes very difficult to have confidence in a investment process where you have no idea of what is going on, other than the fact that it is a black box. That is why AI systems are unlikely to be in widespread use - few institutional sponsors will trust them. In the absence of widespread adoption, we are unlikely to see a future army of AI-bots rooting out alpha.

Maybe I'm just too much of a fuddy duddy, but I have been around far too long to


Chaos Theory: A cautionary tale 
Back in the early 1990s, there was also similar kinds of excitement in the investment community over Chaos Theory, which was also known as non-linear dynamics. Wikipedia explained Chaos Theory as follows:
Chaos theory is a field of study in mathematics, with applications in several disciplines including meteorology, sociology, physics, engineering, economics, biology, and philosophy. Chaos theory studies the behavior of dynamical systems that are highly sensitive to initial conditions—a response popularly referred to as the butterfly effect. Small differences in initial conditions (such as those due to rounding errors in numerical computation) yield widely diverging outcomes for such dynamical systems, rendering long-term prediction impossible in general. This happens even though these systems are deterministic, meaning that their future behavior is fully determined by their initial conditions, with no random elements involved In other words, the deterministic nature of these systems does not make them predictable. This behavior is known as deterministic chaos, or simply chaos. The theory was summarized by Edward Lorenz as follows:
Chaos: When the present determines the future, but the approximate present does not approximately determine the future.
The idea is that non-linear systems can be highly interconnected, but initial condition dependent. In one moment, a butterfly flapping its wings could conceivably cause weather havoc on the other side of the world, but in another, nothing would happen.

One example of a principle that is initial condition dependent is Elliot Wave Theory, which is a charting technique known well to technical analysts. The interpretation of a chart can be highly dependent on how the analyst begins his wave count and different starting points can lead to very different conclusions (one reason why I've never understood EW very well).

A number of years ago, I spoke to the head of a large quantitative investment firm in Boston and their firm had done extensive work in non-linear systems. They had some success with it, but abandoned it after discovering that the risk-adjusted alpha that it generated was roughly in line with traditional linear factors such as the value, growth and momentum. These systems were just too difficult to control and diagnose, especially if investment results turned negative.

The moral of this story: Stick with something simple. (That's how you can live long and prosper.)

Wednesday, September 3, 2014

The One Big Bet made by most buy-and-hold portfolios

Recently, there has been a lot written about active vs. passive investing and, as part of that debate, asset allocation. As an example, Barry Ritholz wrote about the effects of market timing and concluded that the "time" in market is more important than timing the market:
What of an ordinary investor who is a dollar-cost averager into broad indexes? He has a huge advantage over the world’s best market timer, in that he really exists. What he does is possible. The perfect market timer does not and cannot exist. There is no crystal ball or a magic formula that allows for perfect market timing. Instead, our dollar-cost averager simply makes regular contributions to his portfolio. It is a simple, powerful strategy that requires no special prescience into the future, and is a formula that actually exists.

What about risk?
There is a key underlying assumption behind the strategy of determining an asset mix and then buying and holding (with or without re-balancing) as an investment policy.

The assumption is that risk is mainly defined by portfolio volatility, which is the basic tenet of MPT. There is also an excellent discussion of the shortfalls of volatility as a measure of risk by Micah Spruill here, which is well worth reading.

There are other elements of risk for investors with long time horizons. When I write about the risk in an investment policy, I refer to:
  • Volatility, which is the metric most investment professionals focus on; and
  • The risk of the permanent loss of capital, which is split into the following two categories:
    1. The risk of loss from confiscation and conflict; and
    2. Legal framework uncertainty risk, otherwise known as, "How do you know you have a legal claim to what you own, or think you own?"

Confiscation and conflict risk
When investment professionals study past returns to determine future risk and return expectations, they often focus on US assets. As per the Credit Suisse Global Investment Yearbook 2014, here is a typical chart of US asset return considered by planners:


A survivorship bias problem
There are a number of serious problems with this analysis. First, it ignores the risk of confiscation and conflict. The above chart suffers from a severe case of survivorship bias. CS shows this chart of capitalization weights of global equity markets in 1899:


Here is the same pie chart in in 2013. The US went from a 15% market cap weight in 1899 to an astounding 48% in 2013. The UK market, which represented one of the dominant political powers of the early 20th Century, shrank from a 25% weight to 8% in 2013, France, another Great Power, went from 11% to 4%. Notwithstanding the fact that most investors invested in the bond market at the turn of the 20th Century instead of stocks, trying to project returns based on the US experience is like projecting returns based on AAPL`s returns since its 1980 IPO.


In 1899, which was 15 years before the start of World War I, the Major Powers were:
  • Britain
  • Germany
  • France
  • Austro-Hungary
  • Russia
The US was still a promising emerging market country, as was Argentina (how did those Argentine railway bonds work out?).

As per the Credit Suisse review, here are some of the returns of the markets of some major markets in the past 115 years. Here is the old Austro-Hungarian Empire, which has since broken up into modern-day Austria, Bosnia-Herzegovina, Croatia, Czech Republic, Hungary, Slovakia, Slovenia; large parts of Romania and Serbia; and small parts of Italy, Montenegro, Poland and Ukraine. (Bear in mind that, as the per above US asset real return chart, $1 invested in US equities in 1899 = $1,248 in inflation-adjusted dollars today).


What about Germany? That country underwent a couple of severe dislocations in the form of two World Wars in the past 115 years, the worst of which involved losses of over 90% if you invested in German equities.


The same pattern of 90% losses held true for Japan:


Of course, there is China, which has been a recent favorite among emerging market investors. The Shanghai market suffered a severe *ahem* dislocation in the wake of Mao Zedong's takeover Liberation of China and didn't turn around until the Deng Xiaopeng era.


The same kind of *ahem* dislocation occurred in Russia. In the cases of Russia and China, the personal experience of a resident of those countries as a capitalist investor likely paralleled that of most European Jews in World War II.


Legal framework risk
In addition, to the risk of permanent or severe loss of capital from confiscation and conflict, investors with long time horizons face the risk of legal framework uncertainty. Gold bugs will point to FDR`s Executive Order 6102, which effectively banned the private ownership of gold by individuals and companies in 1933.

A more modern example can been seen today in possible sanctions that have been proposed against Russia. FT Alphaville recently highlighted a Bloomberg article indicating proposals to cut Russia off from the western banking system, as the West did with Iran:
The U.K. will press European Union leaders to consider blocking Russian access to the SWIFT banking transaction system under an expansion of sanctions over the conflict in Ukraine, a British government official said.

The Society for Worldwide Interbank Financial Telecommunication, known as SWIFT, is one of Russia’s main connections to the international financial system. Prime Minister David Cameron’s government plans to put the topic on the agenda for a meeting of EU leaders in Brussels tomorrow, according to the official, who asked not to be named because the discussions are private.
Such a move could be devastating to the Russian economy:
The FT also reports that Swift is on the table, although it would be an “extreme measure”.

After all, if Europe did decide to press Belgium-based Swift, and thus financial globalisation itself, into service — it places Russia into a tricky spot this time round.

Swift doesn’t clear cross-border banking transactions itself. But it does open doors for relatively isolated banking markets (like Russia’s is, still) to connect to clearing systems such as Target2 or, in the US, Fedwire. The Kremlin has seen the risk coming and moved to create a local replacement. But as Reuters notes, less than 10 per cent of transactions involving Russian banks stay within Russia.

The model is Iran. EU sanctions in 2012 effectively obliged Swift to comply with disconnecting Iranian banks from its processes. The use of Swift allowed what’s become quite a familiar dynamic in US and European financial sanctions.
In other words, you may own those assets, but can you access them? If you are restricted from accessing them, what is their value (emphasis added)?
Some foreign investors might always stick with Russia as the assets are so cheap. Gazprom and Rosneft, two enormous companies with a combined enterprise value above $270bn (the Moscow bourse’s market cap is $560bn), are respectively trading 3 and 4 times forward earnings.

Sberbank, market cap $42bn, trades below book value despite a return on equity western banks would kill for, and having survived the financial crisis with barely a dent. Is it cheap even with Swift risk? Would any of these companies appeal to a minority shareholder, if the Russian state interest in them may mean they can also be tools of this ‘hybrid’ warfare?

Interesting questions, but the cheapness is almost irrelevant if the plumbing breaks. And then, there is what happens if Russian money flows home. That end-point presumably has to be factored into the sanctions strategy, and how the EU’s policymakers believe it would pressure Putin. Would it? Putin’s power rests partly on distributing resources at home to a selected elite group. Would returning capital change, weaken or strengthen this? What about the localised bank transfer systems which Russia would try to create — would it consolidate the Kremlin’s control?

A bet on World Peace
I began this post discussing the active vs. passive question, along with the asset allocation issue. Most investment professionals erroneously start with an asset allocation that is has a significant home bias (and therefore represents an active bet away from the global portfolio pictured below).


For most Americans, their portfolio allocations would be highly US-centric. For other developed market investors, their allocations will typically have a home-country bias. Such so-called "passive" allocations represent a big bet on continued world peace. For the foreseeable future, that appears to be a reasonable bet. JP Morgan Asset Management shows the effect of war in the world today (via FT Alphaville):
  • 11.7 per cent population
  • 9 per cent oil production
  • 3.8 per cent foreign direct investment
  • 3 per cent GDP
  • 2.6 per cent trade
  • 2.4 per cent gross capital formation
  • 0.8 per cent corporate profits
  • 0.7 per cent equity market capitalisation
  • 0.5 per cent interbank claims
  • 0.4 per cent portfolio investment inflows
Even though it involves 11.7% of global population, which is devastating to those involved, it only involves 3% of global GDP and 0.7% of equity market capitalization - which are not large figures that would overly disturb financial markets.


Doubling down on Pax Americana
In summary, most investment policies today are Big Bets on world peace. For Americans, they represent an even bigger bet - the continuation of Pax Americana. To illustrate my point, here is the CS chart of real returns on UK assets from 1899. Britain was a dominant global power at the dawn of the 20th Century. The sun never set on the British Empire as it had possessions around the world. The real return of $372 based on $1 in British equities in 1899 looks reasonably good, but it`s dwarfed by the 1,248 figure shown by US equities in the same period.


France, which was overrun by Germany in 1940, had an equity market that did much worse, though it did not suffer the 90% losses that the German and Japanese stock markets did.


If you wanted to project equity risk and return expectations, what figure would you use? The US 1,248 real return, the British 372 or the French 36 real return figure?

The history of the 20th Century has shown that previously dominant empires can fall. We don`t know what the future holds. Do investors with very long time horizons want to make an bet on the continuation of Pax Americana?

Thursday, June 26, 2014

How to be bullish and bearish, part 2

In a past post, I had outlined my long-term concerns for US equities, though I remain relatively constructive on the intermediate term outlook for stock prices (see How stocks are both cheap AND expensive).


Belski long-term bullish
Now BMO strategist Brian Belski has taken a mirror image of my views, which is long-term cautious but short-term bullish, with a long-term bullish but short-term cautious stance. First, Belski explained his bullishness based on the thesis that we are seeing a secular bull market after a Lost Decade and therefore long-term equity return expectations of 10% are plausible (via FT Alphaville):
Secular Bull Markets Are Born Out of Lost Decades: Based on historical evidence, stocks typically enter a very long period of expansion after emerging from a period of negative 10-year holding period returns. We found that, on average, these periods last for roughly 15 years and deliver average annual returns of about 16%. Given that 10-year holding period returns emerged from negative territory a little over five years ago and currently stand at 5.5%, it is not unreasonable to assume that there is about 10 years and 10% of average annual returns left to the current bull market should performance follow historical patterns.


Short-term cautious
On the other hand, Belski was featured in a recent Financial Post story with the title "5 signs Canadian stocks are frothy", namely:

  1. Forward P/E ratios are near the highest level since 2000
  2. More than 35% of TSX companies are hitting 52-week highs
  3. Volatility is at a record low
  4. Stock performance is significantly outpacing underlying commodities
  5. Recent TSX outperformance has been highly concentrated in energy stocks
Now I recognize that the Canadian stock market is not the same as the US market, but the two economies are tightly bound to each other and the returns of the two markets have shown a high degree of correlation.

While I disagree with Mr. Belski's conclusions (see my previous post How stocks are both cheap AND expensive for the reasoning), but this is another example of how someone can be both bullish and bearish at the same time. It just depends on your time horizon.


Cam Hui is a portfolio manager at Qwest Investment Fund Management Ltd. (“Qwest”). The opinions and any recommendations expressed in the blog are those of the author and do not reflect the opinions and recommendations of Qwest. Qwest reviews Mr. Hui’s blog to ensure it is connected with Mr. Hui’s obligation to deal fairly, honestly and in good faith with the blog’s readers.”

None of the information or opinions expressed in this blog constitutes a solicitation for the purchase or sale of any security or other instrument. Nothing in this blog constitutes investment advice and any recommendations that may be contained herein have not been based upon a consideration of the investment objectives, financial situation or particular needs of any specific recipient. Any purchase or sale activity in any securities or other instrument should be based upon your own analysis and conclusions. Past performance is not indicative of future results. Either Qwest or I may hold or control long or short positions in the securities or instruments mentioned.

Monday, May 19, 2014

Know your time horizon

Philosophical Economics has an interesting post that posed the question, "Would you be better off if stocks melted up 200% or plunged 67%?" For investors with 30 year time horizons, the counter-intuitive answer is the 66% plunge in stock prices.

As equity investors, we tend to focus more on capital gains, but as fixed income investors are keenly aware, there are two other sources of returns for investors. The first source is capital gains, the second is income (interest for bonds and dividends for stocks) and, lastly, re-investment return, or interest on interest.

As the analysis from Philosophical Economics shows, if stock prices were to plunge 66%, the investor would be able to compound his returns at much lower prices than if the market melted up. Thus, for investors with sufficiently long time horizons, periodic corrections and bear markets are helpful to terminal wealth value as that dividend income can be re-invested at lower prices.


I once had a taxable investor client with an extremely long time horizon. The client was formed as a trust and most of the positions acquired decades ago, e.g. GE with a cost base in pennies. The low cost base of the positions made selling nearly impossible because of the capital gains liability, so the client adopted an investment policy of focusing on companies with a history of good dividend growth. That way, the current beneficiaries could enjoy a steady and predictable rising income stream. Bear markets were especially welcome, as we could "harvest" capital losses to offset the capital gains from the sale of positions with low costs.

I had a fruitful relationship with that client, but it was a disconcerting feeling when I called to report our quarterly results when stock prices were rising. I almost felt like I had to apologize, "Sorry, we made you money this quarter. Your portfolio went up by X%." Nevertheless, the strategy of focusing on dividend growth made sense as it should provide better overall returns in the long run for investors with sufficiently long time horizons.

It was a good lesson for me in formulating an investment policy statement. Know what you really want. Know your time horizon.


Cam Hui is a portfolio manager at Qwest Investment Fund Management Ltd. (“Qwest”). The opinions and any recommendations expressed in the blog are those of the author and do not reflect the opinions and recommendations of Qwest. Qwest reviews Mr. Hui’s blog to ensure it is connected with Mr. Hui’s obligation to deal fairly, honestly and in good faith with the blog’s readers.”

None of the information or opinions expressed in this blog constitutes a solicitation for the purchase or sale of any security or other instrument. Nothing in this blog constitutes investment advice and any recommendations that may be contained herein have not been based upon a consideration of the investment objectives, financial situation or particular needs of any specific recipient. Any purchase or sale activity in any securities or other instrument should be based upon your own analysis and conclusions. Past performance is not indicative of future results. Either Qwest or I may hold or control long or short positions in the securities or instruments mentioned.

Tuesday, February 4, 2014

Did Zero Hedge just turn bullish?

You have to love the tone of the writing at Zero Hedge. I can generally count on them to point out that not only is the glass half full, it's actually leaking. In a recent post, ZH may have inadvertently turned bullish on the stock market.

Consider the post entitled Fed's Lacker Slams Permabulls, Pours Cold Water On The US "Growth Story". The post details Richmond Fed President Lacker's comments on the economy. I won't go through all the details, but the main point was the skepticism that Lacker expressed about the robustness of the US economy's growth rebound [emphasis added]:
Economists' hopes have been bolstered of late by a recent string of data releases indicating that 2013 ended on a positive note. Second-half growth in real GDP — our broadest measure of overall economic activity — was stronger than we've seen in quite some time. While that figure was boosted significantly by inventory accumulation that is unlikely to persist, there was some evidence of momentum that might carry forward.
In effect, Lacker said that he had seen these growth spurts before:
Although consumption grew rapidly at the end of last year, we have seen similar surges since the last recession, only to see spending return to a more moderate trend. Consumer spending trends are likely to depend on whether the dramatic events of the last few years are only a temporary disturbance to household sentiment or if they instead represent a more persistent shift in attitudes about borrowing and saving. At this point, I am inclined toward the latter view.
If growth was so robust, then where's the hiring and the capex?
Businesses also appear to be quite reticent to hire and invest. A widely followed index of small business optimism fell sharply during the recession and has only partially recovered since then. Interestingly, when small business owners were asked in the latest survey about the single most important problem they face, 20 percent answered "government regulations and red tape." This observation accords with reports we've been hearing from many business contacts for several years now. They've seen a substantial increase in the pace of regulatory change and a substantial increase in uncertainty about the shape of new regulations. Both are said to discourage new hiring and investment commitments.
Lacker is known to tilt to the hawkish camp (see this Business Insider review of the hawk-dove spectrum) and his speech concluded with a summary of his skeptical view that the current bout of so-called growth acceleration is real:
The pickup in growth late last year is certainly a welcome development, and it may well be a harbinger of stronger growth ahead. But experience with similar growth spurts in the recent past suggests that it is too soon to make that call. My suspicion is that we will see growth subside this year to closer to 2 percent, about the rate we've seen since the Great Recession.

Is bad news good news?
I pointed out before that too much growth could actually be bad news because it would push the Fed towards a tightening bias that would spook the markets (see The risk of catastrophic success). In that sense, a growth deceleration towards the 2% level as postulated by Lacker could actually be a good thing for financial markets, as long as the economy doesn't slow into recessionary territory.

Tim Duy recently made the point that the bond market is pricing in slower growth and an easier Fed by highlighting Jon Hilsenrath's recent WSJ article:
The market, in short, is now pricing in a much easier Fed, not a tighter Fed. Movements in 10-year Treasury notes are telling the same story. Last summer, 10-year yields were rising because investors saw a tighter Fed. Now they’re falling. Investors seem to be reading a string of soft economic data – weaker car sales, a manufacturing slowdown, disappointing job growth – and concluding the economic coast is not as clear as it appeared just a few weeks ago.
Duy went on to suggest that the market is expecting a more accommodative Fed:
I would suggest that the decline in rates indicates the Fed is too tight, not too easy. Indeed, we would hope that they would only be tapering in the context of a rising interest rate environment as it would suggest that market participants were anticipating higher growth and inflation. But the Fed doesn't see it that way. They see lower rates as a signal that policy is easier. And hence are not inclined to react to ease policy further by stopping the taper.
Indeed, the 10-year yield has been falling for most of 2014:


The current round of stock market weakness has been attributed to two causes: the possibility of a US growth slowdown and the rising risk of an emerging market crisis because of Fed tapering. Now consider the following:

Falling bond yields? An easier Fed? Shouldn't that be music to the ears of the US stock investors as they get over this "growth scare". Similarly, won't this be good news for emerging market investors as well, because tapering would be replaced by other forms of accommodation. When will Mr. Market take the view that an easier Fed is good news (as long as the economy doesn't keel over into recession)?

Regardless of whether Lacker is right about a reversion to a 2% growth rate, it seems to me that a 2-3% growth rate for the US economy represents the sweet spot (not too hot, not too cold) for risky assets.

This brings up an interesting question. Does that mean that when ZH tried to talk down the growth rate, it actually (inadvertently) turned bullish?


Cam Hui is a portfolio manager at Qwest Investment Fund Management Ltd. (“Qwest”). The opinions and any recommendations expressed in the blog are those of the author and do not reflect the opinions and recommendations of Qwest. Qwest reviews Mr. Hui’s blog to ensure it is connected with Mr. Hui’s obligation to deal fairly, honestly and in good faith with the blog’s readers.”

None of the information or opinions expressed in this blog constitutes a solicitation for the purchase or sale of any security or other instrument. Nothing in this blog constitutes investment advice and any recommendations that may be contained herein have not been based upon a consideration of the investment objectives, financial situation or particular needs of any specific recipient. Any purchase or sale activity in any securities or other instrument should be based upon your own analysis and conclusions. Past performance is not indicative of future results. Either Qwest or I may hold or control long or short positions in the securities or instruments mentioned.

Sunday, September 15, 2013

My Lehman lesson: Model diversification and flexibility

The press and the blogosphere has been full of articles about the five year anniversary of the Lehman Crisis. What was most striking to me is Pew Research's survey results showing the anemic and uneven nature of the recovery. Many respondents indicated that their own situation remains fragile:
Five years after the U.S. economy faced its most serious crisis since the Great Depression, a majority of Americans (63%) say the nation’s economic system is no more secure today than it was before the 2008 market crash. Just a third (33%) think the system is more secure now than it was then.

Large percentages say household incomes and jobs still have yet to recover from the economic recession. And when asked about the impact of government efforts to deal with the recession, far more believe that economic policies have benefitted large banks, corporations and the rich than the middle-class, the poor or small businesses.

What happened to "unchecked greenback emissions"?
What have we learned? I learned that, in the aftermath of the collapse, a lot of experts were wrong, or more charitably characterized as "early", in their forecasts of the effects of the collapse and the policy response to the collapse. Consider the prognostication of no less a luminary than Warren Buffett, who warned about the effects of money printing and deficit spending in a NY Times Op-Ed on August 18, 2009:
Our immediate problem is to get our country back on its feet and flourishing — “whatever it takes” still makes sense. Once recovery is gained, however, Congress must end the rise in the debt-to-G.D.P. ratio and keep our growth in obligations in line with our growth in resources.

Unchecked carbon emissions will likely cause icebergs to melt. Unchecked greenback emissions will certainly cause the purchasing power of currency to melt. The dollar’s destiny lies with Congress.

The policy and market response
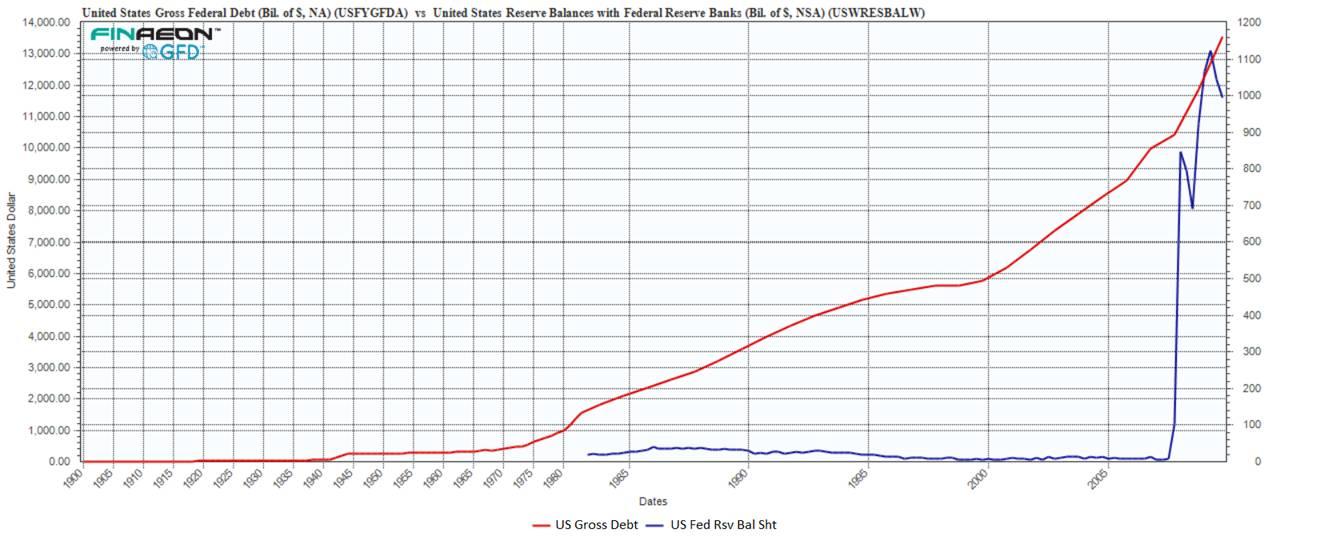
What has happened since then? The federal deficit has soared and so has the Fed's balance sheet. The chart below from Global Financial Data shows the policy response:


What about the market response? The USD didn't plummet in the wake of "unchecked greenback emissions", largely because of the global nature of the financial crisis. Other major industrialized countries (and the eurozone in particular) experienced their own financial crisis and global central bankers went into crisis mode. The balance sheets of the ECB, BoE, BoJ and other central banks expanded to stratospheric levels in response. In that case, shouldn't the effects show up in inflation rather than then the exchange rate? Inflation, as measured by the CPI, has been extremely tame. What about commodity inflation? Shouldn't it show up as commodity inflation? Well, sort of. As the chart below shows, commodity prices (in black) did rise in the wake of the global financial crisis, but so did stock prices (in red). Commodity prices peaked out in early 2011, but stock prices have continued to advance.


Where's the inflation?


Inflation has been dormant
Perhaps the forecasters are early. Some analysts, such as David Rosenberg, believe that stagflation lies in our future:
You cannot keep real short-term rates negative for this long in the face of even modestly positive real economic growth without generating financial excesses today and inflationary pressures in the future. That’s why I continue to believe that the next major theme — and the legacy of the Ben Bernanke regime — will be stagflation.
Warren Buffett expressed his concerns about stagflation back in 2008, according to Bloomberg:
``We're right in the middle of it right now,'' said Buffett, chairman of Omaha, Nebraska-based Berkshire Hathaway Inc., in an interview on Bloomberg Television today. ``I think the `flation' part will heat up and I think the `stag' part will get worse.''
Though he was uncertain about its timing:
``It's not going to be tomorrow, it's not going to be next month, and may not even be next year,'' said Buffett, 77.
Stagflation involves two elements, slow growth and inflation. I understand the slow growth part of the stagflation forecast. The growth path of the American economy remains anemic, largely because this is not the typical recovery from an inventory recession, but a balance sheet recession that requires the deleveraging of household, corporate and government balance sheets. That process takes time.

I am not sure I get the inflation part of the forecast. Today, five years after the Lehman Crisis, we have see little signs of consumer price inflation and asset inflation, in the form of commodity price inflation, remains relatively tame. How long do we have to wait?


Is inflation purely a monetary phenomena?
It sounds like that that the model underlying the thinking of people like Rosenberg and Buffett is Milton Friedman's MV=PQ conceptual framework:

Where

M\, is the total amount of money in circulation on average in an economy during the period, say a year.
V_T\, is the transactions velocity of money, that is the average frequency across all transactions with which a unit of money is spent. This reflects availability of financial institutions, economic variables, and choices made as to how fast people turn over their money.
p_i\, and q_i\, are the price and quantity of the i-th transaction.
\mathbf{p} is a column vector of the p_i\,, and the superscript T is the transpose operator.
\mathbf{q} is a column vector of the q_i\,.


If you were to increase the money supply by expanding the Fed balance sheet, holding V (velocity) and Q (quantity produced in the economy) constant, price rises and you get inflation. That's why, it is said, that inflation is a monetary phenomena.

So far, despite the Fed's efforts to expand the monetary base, velocity has collapsed and we have seen little signs of inflation.


A demographic explanation
To resolve this conundrum, it might be useful to study the last episode of stagflation. Steve Randy Waldman recently proposed an alternative explanation of the stagflation of the 1970's based on age demographics, namely that stagflation was the result of stagnant productivity, not just money printing. Consider the chart below of US productivity. It was stagnant during the 1970's but it has soared to new highs in the current post-Lehman Crisis period.


Waldman wrote:
The “malaise” of the 1970s was not a problem with GDP growth. NGDP growth was off the charts (more on that below). But real GDP growth was strong as well, clocking in at 38%, compared to only 35% in the 1980s, 39% in the 1990s, and an abysmal 16% in the 2000s.

What was stagnant in the 1970s was productivity, which puts hours worked beneath GDP in the denominator. Boomers’ headlong rush into the labor force created a strong arithmetic headwind for productivity stats.
Simply put, there were too many Baby Boomers entering the workforce at that time and productivity lagged as a result:
The root cause of the high-misery-index 1970s was demographics, plain and simple. The deep capital stock of the economy — including fixed capital, organizational capital, and what Arnold Kling describes as “patterns of sustainable specialization and trade” — was simply unprepared for the firehose of new workers. The nation faced a simple choice: employ them, and accept a lower rate of production per worker, or insist on continued productivity growth and tolerate high unemployment. Wisely, I think, we prioritized employment. But there was a bottleneck on the supply-side of the economy. Employed people expect to enjoy increased consumption for their labors, and so put pressure on demand in real terms. The result was high inflation, and would have been under any scenario that absorbed the men, and the women, of the baby boom in so short a period of time. Ultimately, the 1970s were a success story, albeit an uncomfortable success story. Going Volcker in 1973 would not have worked, except with intolerable rates of unemployment and undesirable discouragement of labor force entry. By the early 1980s, the goat was mostly through the snake, so a quick reset of expectations was effective.
Policy makers, in effect, wanted to avoid more social tensions and unrest (remember the anti-Vietnam sentiment of the early 1970's) and paid the price in the form of slow growth and rising inflation. Karl Smith, writing in Forbes, quoted Arthur Burns in justifying the high inflation of the 1970's:
“Viewed in the abstract the Federal Reserve System had the power to abort the inflation in its incipient stage fifteen years ago or at any later point, and it has the power to end it today. At any time during that period, it could have restricted the money supply and created sufficient strains in financial and industrial markets to terminate inflation with little delay. It did no do so because the Federal Reserve was itself caught up in the philosophic and political currents that were transforming American life and culture.
Smith went on:
Put another way, high inflation can always be prevented if one is willing to tolerate recessions. Yet, recessions have consequences. Government budgets – at minimum – are redirected towards immediate relief, if not outright cut. Public investments in basic research, exploration and state-of-the-art infrastructure are postponed. In the private sector R&D budgets are slashed and new products put on hold. Small businesses, especially young start-ups, perish en masse. Families who are just beginning to climb the socioeconomic ladder and offer a better future to their children are knocked back down. Social tensions rise. Xenophobic and ethnocentric movements flourish. The adolescent generation, just on its way to the workforce, is permanently marred by a shortage of training and experience.
If demographics was the main cause of the stagflation of the 1970's, then stagflation may not be in our immediate future. In fact, a paper by IMF economist Patrick Imam (via Business Insider) suggests that an aging population is likely to make monetary policy less effective. Michael Mandel wrote a paper suggesting that productivity growth is likely to skyrocket in the near future because of technological innovations. As well, Izabella Kamanska chimed in and wrote on the likely deflationary effects of a global population peak.


Investment implications
Who is right? David Rosenberg and Warren Buffett in forecasting stagflation, or at least, rising inflation in our future? Or the likes of Waldman, who proposed a demographic and productivity explanation of the stagflation of the 1970's, whose implication is that rising productivity will act to contain inflation?

For policy makers, it presents a conundrum. Who do you believe? Policy makers have a much more difficult problem because policy is dependent on the underlying model of how the economy works.

For investors, the conundrum can be resolved easily because they don't have to adhere to any single point of view. The answer is model diversification.

I honestly don't know who is right. However, my inner investor believes that he should stay flexible and create a portfolio that diversifies between models.

For me, my investment lesson learned in the aftermath of the Lehman Crisis is not to be overly dogmatic about your economic and political beliefs. Stay flexible and learn to diversify your models.


Cam Hui is a portfolio manager at Qwest Investment Fund Management Ltd. (“Qwest”). The opinions and any recommendations expressed in the blog are those of the author and do not reflect the opinions and recommendations of Qwest. Qwest reviews Mr. Hui’s blog to ensure it is connected with Mr. Hui’s obligation to deal fairly, honestly and in good faith with the blog’s readers.”

None of the information or opinions expressed in this blog constitutes a solicitation for the purchase or sale of any security or other instrument. Nothing in this blog constitutes investment advice and any recommendations that may be contained herein have not been based upon a consideration of the investment objectives, financial situation or particular needs of any specific recipient. Any purchase or sale activity in any securities or other instrument should be based upon your own analysis and conclusions. Past performance is not indicative of future results. Either Qwest or I may hold or control long or short positions in the securities or instruments mentioned.

Thursday, August 8, 2013

A new secular bull? Don't count on it!

As the chart below shows, the Dow Jones Industrial Average, along with other the major US averages, have decisively made new all-time highs and broken out of its trading range, can we expect the launch of a new secular bull market for stocks?

Dow Jones Industrials Average from 1910

Zooming in, here is the 10-year monthly chart of the Dow. The upside breakout is clear on that chart as well.


Despite the technical evidence, I believe that the odds that this is the start of a secular bull market is low for three reasons. All of the are signals that valuations are elevated, which is what matters in the long-term.

First, private equity firms like Fortress and Blackstone are seeking to sell their equity positions, according to this Bloomberg report:
Private-equity managers from Fortress Investment Group LLC (FIG) to Blackstone Group LP (BX), which made billions by buying low and selling high, say now is the time to exit investments as stocks rally and interest rates start to rise...

“It’s almost biblical: there is a time to reap and there’s a time to sow,” Apollo’s Black said at a conference in April. “We think it’s a fabulous environment to be selling. We’re selling everything that’s not nailed down in our portfolio.” 
Black’s New York-based firm, which oversees assets worth $114 billion, generated $14 billion in proceeds from the sale of holdings between the first quarter of 2012 and the first quarter this year.
Where they can't exit their positions, private equity firms appear to be intent on extracting as much value as they can from issuing debt, according to this WSJ report. It seems that this class of investors just can't find good values in the market [emphasis added]:
The industry’s focus on exits has reduced volumes of leveraged buyouts this year, with the number of private-equity deals announced declining 20 percent to 3,047 worldwide from the same period last year, according to data compiled by Bloomberg. 
It’s a difficult environment to find really attractive things when the markets are robust as they are,” Fortress’s Edens said yesterday.
That seems to be the position taken by patient value fund managers, according to this other Bloomberg report [emphasis added]:
The $1.1 billion Weitz Value and $980 million Weitz Partners Value funds each have cash stakes that are close to 30 percent. At the $10.6 billion Yacktman Focused fund, cash has crept up from 14 percent a year ago to 19 percent. The $1.3 billion Westwood Income Opportunity has about 16 percent in cash, more than double what it had at the start of the year. Cash makes up about 28 percent of assets in the $8.9 billion IVA Worldwide Fund, up from 10 percent a year ago, and is 33 percent of the $508 million GoodHaven fund, up from 19 percent a year ago.

Those are some seriously contrarian positions. The average diversified U.S. stock fund has less than 5 percent in cash, according to Morningstar. For funds such as IVA Worldwide that fall into the "world allocation" fund category and invest globally across a wide range of asset classes, the average cash stake is below 15 percent. 
There’s no big macroeconomic prediction fueling the move of these value managers into cash. Just some simple investing discipline as managers pare positions in stocks they bought at deeply depressed prices. The Leuthold Group reports that the median price-earnings ratio for large-cap value stocks is 13 percent to 25 percent above its long-term historic norm; large-cap growth stocks trade at an 8 percent to 10 percent discount to their historic norm. 
After taking profits on stocks that have risen close to what we believe is their value, we aren’t finding enough mispriced securities to redeploy that cash into,” says IVA Worldwide co-manager Charles de Vaulx. He'd rather know with certainty that he'll lose a little by holding cash “than stay invested in stocks I don’t think offer enough value and lose a lot.”
In addition, the median appreciation potential of stocks tracked by Value Line is flashing a danger signal:
While not intended to be a market-prediction tool, it has worked nicely as one, especially for investors with a time horizon of a few years. Academic studies have ratified its value in this regard. The market-newsletter tracker Hulbert Financial Digest has ranked it first among market-timing services in forecasting four-year market performance. 
Since 1970, the VLMAP, as it is known, has flagged the tremendous buying opportunities at the bear-market lows in 1974, 1982 and 2009, each time suggesting the median return potential was an annualized 25% or more over the next five years. That’s almost exactly how the Standard and Poor’s 500 index has performed in the four-plus years since the March 2009 market low. 
Conversely, every time the number has fallen to its current 7% level – which is in the lowest 10% of all readings since 1970 – the broad market has been flat or down over the subsequent half-decade.

The combination of VLMAP, private-equity and value managers represent long-term patient money and modeling techniques. Private equity and value managers are not day-traders or swing traders, but their ticks are in months or quarters. So when patient money tells me that stocks are expensive, I have to sit up and take notice.

To be sure, short and medium term fundamental and technical indicators are still supportive of fresh highs in the major US equity indices. Market breadth remains positive and Street consensus forward earnings continue to grow, according to Ed Yardeni, and this is bullish for equities.


Regardless, long-term investors who put money to work in the stock market today are likely to be disappointed if they were to come back and examine their positions in three to five years.


Cam Hui is a portfolio manager at Qwest Investment Fund Management Ltd. ("Qwest"). This article is prepared by Mr. Hui as an outside business activity. As such, Qwest does not review or approve materials presented herein. The opinions and any recommendations expressed in this blog are those of the author and do not reflect the opinions or recommendations of Qwest.

None of the information or opinions expressed in this blog constitutes a solicitation for the purchase or sale of any security or other instrument. Nothing in this article constitutes investment advice and any recommendations that may be contained herein have not been based upon a consideration of the investment objectives, financial situation or particular needs of any specific recipient. Any purchase or sale activity in any securities or other instrument should be based upon your own analysis and conclusions. Past performance is not indicative of future results. Either Qwest or Mr. Hui may hold or control long or short positions in the securities or instruments mentioned.

Monday, July 15, 2013

What a regime shift looks like

When I first joined Merrill Lynch, I sat next to a young analyst named Savita Subramanian who was working for Rich Bernstein in strategy research. Though we worked in different groups, I can recall sharing with her everything from Factset data tricks to suggestions about her (then) boyfriend. I have the utmost respect for her as a person and as an analyst.

It was with interest that I read (via Business Insider) that Savita Subramanian, who is now BoAML's head of US equity strategy, raised her year-end SPX target to 1750. One of the key inputs is her estimate of the equity risk premium (ERP):
As such, we have lowered our normalized risk premium assumption in our fair value model for the end of 2013 from 600bp to 475bp, which assumes roughly another 25bp of ERP contraction by year-end. We have also raised our normalized real risk-free rate assumption for year-end from 1.0% to 1.5%. Not only have current and future inflation expectations declined since last fall, but long-term interest rates have also begun to rise recently. Meanwhile, our Rates Strategist Priya Misra also recently raised her interest rate forecasts.

Sorry, Savita. I respectfully disagree.

I hate to beat a dead horse here, but I am afraid that much of the Street still doesn't understand the global effects of the deleveraging cycle and subsequent Fed intervention on the perception of risk. Here is the same chart, with my annotations in red:


The first part of the chart from 1987 to 2009 represents an economic growth phase powered by rising credit growth and rising financial leverage. The latter part, post-Lehman Crisis, is the deleveraging phase of the long cycle. Just read Ray Dalio's explanation of the credit cycle using the Monopoly game analogy and you'll get the idea. If you accept the premise that the two phases of the cycle are different, then you can't apply the norms of an equity risk premium from one phase to another.

Now consider what the Fed did in the wake of the Lehman Crisis (see my previous posts It's the risk premium, stupid! and Regime shifts = Volatility). The Federal Reserve intervened with a series of quantitative easing programs, designed to lower interest rates and lower risk premiums. An artificially lower risk premium forces the market to take more risk, reach for yield, invest, etc. It was thought that such actions would kick start a virtuous cycle of more growth, employment and therefore recovery.

Fast forward to May 22, 2013. The Fed signals that it is thinking of tapering off its QE program. The longer term effect of tapering, regardless of its timing, is to allow risk premiums to find their own natural levels. Since they have been artificially depressed by QE, do you think that they would fall further as postulated by BoAML's analysis?

I recognize that the ERP shot up in the wake of the Lehman Crisis and the various versions of eurozone sovereign debt crisis in the last few years. As fear levels have faded, so should the equity risk premium. Nevertheless, to believe that the ERP will return to pre-crisis levels is to disregard the longer term nature of the deleveraging cycle and the net effects of the Fed's QE programs which depressed risk premiums globally.


Cam Hui is a portfolio manager at Qwest Investment Fund Management Ltd. ("Qwest"). This article is prepared by Mr. Hui as an outside business activity. As such, Qwest does not review or approve materials presented herein. The opinions and any recommendations expressed in this blog are those of the author and do not reflect the opinions or recommendations of Qwest.

None of the information or opinions expressed in this blog constitutes a solicitation for the purchase or sale of any security or other instrument. Nothing in this article constitutes investment advice and any recommendations that may be contained herein have not been based upon a consideration of the investment objectives, financial situation or particular needs of any specific recipient. Any purchase or sale activity in any securities or other instrument should be based upon your own analysis and conclusions. Past performance is not indicative of future results. Either Qwest or Mr. Hui may hold or control long or short positions in the securities or instruments mentioned.


Monday, February 27, 2012

We are all QEers now

Richard Nixon famously said in 1971 that we are all Keynesians now. Within a decade, the unintended effects of Keynesian stimulus were plain to see for everyone as inflation raced upwards and out of control.

Today, as the world holds its breath for the results of the ECB's LTRO2 auction later in the week, we are all Quantitative Easers. The Bank of Japan, Federal Reserve, the European Central Bank and Bank of England have all embraced quantitative easing, or money printing. Recently, both the BoE and BoJ have announced further rounds of quantitative easing.


In the short run, there are clear benefits to the US federal government of the Fed's ZIRP and quantitative easing. In 2011, the US paid $454 billion in interest payments under ZIRP and, despite skyrocketing debt, interest expect was less than it was in parts of the 1990's.

Moreover, L Randall Wray points out that the Federal Reserve holds assets equal to one-fifth of GDP. What's more, an astounding 50% of its assets have maturities of 10 years or more.

Governments of the developed world are trapped by their central bankers dual policies of ZIRP and QE. If central bankers were to raise rates, interest costs would spiral out of control and overwhelm budgets. Just read Reinhart and Rogoff to see what happens next.

This has resulted in a binary investment environment of risk on, when central bankers are engaged in QE, and risk off, when they are not. The endgame will either inflation or debt default - and I don't know what the result will be.

For investors, this means becoming more tactical in understanding the risk on/risk off backdrop and participating in the trend of the day. Right now, central bankers are engaged in another round of QE around the world. Despite what you may think of the ultimate costs of such policies, the right thing for an investor to do is to party and worry about the consequences later.


Cam Hui is a portfolio manager at Qwest Investment Fund Management Ltd. ("Qwest"). This article is prepared by Mr. Hui as an outside business activity. As such, Qwest does not review or approve materials presented herein. The opinions and any recommendations expressed in this blog are those of the author and do not reflect the opinions or recommendations of Qwest.

None of the information or opinions expressed in this blog constitutes a solicitation for the purchase or sale of any security or other instrument. Nothing in this article constitutes investment advice and any recommendations that may be contained herein have not been based upon a consideration of the investment objectives, financial situation or particular needs of any specific recipient. Any purchase or sale activity in any securities or other instrument should be based upon your own analysis and conclusions. Past performance is not indicative of future results. Either Qwest or Mr. Hui may hold or control long or short positions in the securities or instruments mentioned.

Monday, January 9, 2012

Distilling alpha with factor betas

One of the hardest questions any portfolio manager has to answer is, "What can go wrong with your strategy?" If he doesn't know, then it's a sign that he hasn't fully thought out all the nuances of his investment approach.


How to untangle alpha using factor betas
Here is one example of how I used to evaluate investment strategies when I worked at and with hedge funds.

A couple months ago, we were approached by an experienced bond portfolio manager with an idea for a bond strategy for the Canadian market. The idea involved overlaying a call option writing strategy on the US Treasury market on top of a Canadian bond portfolio. The resulting portfolio had the following benefits:
  • Same duration exposure as the benchmark, i.e. no significant interest rate directional bets;
  • Higher credit quality compared to the benchmark
  • Significantly higher realized return than the benchmark
I interviewed the portfolio manager and found out that the most significant risks of the strategy are, in no particular order:
  • Basis risk between the US and Canada yield curve
  • Currency risk
  • Volatility risk as it relates to option pricing

Disaggregating the alpha using factor betas
He had been running a "live" paper portfolio in real time for a little over a year. The backtest looked good as it added an alpha of over 3% in that period. Given my assessment of his risk exposures, I wanted to see whether the outperformance was the result of a favorable factor beta exposure, i.e. the strategy bet on a certain kind of exposure and it worked, or the alpha was relatively independent of factor beta.

We got the weekly returns of the paper portfolio and I made the following table:


I averaged the weekly alpha of the strategy under different scenarios. On the first line, I asked, "What is the average weekly alpha when the US long bond price is up, down or relatively flat?" In that case, the strategy underperformed when the long bond rallied, largely because it was selling call options at the long end of the yield curve and the premiums weren't enough to offset the gains in bond prices, and outperformed when the long bond price was either flat or falling.

Similarly, I performed other forms of scenario analysis. What happens to the alpha when the Canada and US curve diverge? What happens when implied stock volatility (I didn't have a good proxy for bond volatility) moved up or down?


Stress testing factor beta exposures
I used scenario analysis to project an annual alpha. The average case analysis assumes a Gaussian distribution where 50% of the time exposure to that factor beta is neutral, 25% of the time it is favorable and 25% of the time unfavorable. Using the example of the long bond price factor, I calculated an expected alpha assuming that 25% of the time, the bond price was falling, 25% of the time it was rising and 50% it was neutral. In this case, that came to an expected alpha of 3.90% per annum.

I wanted to stress test the strategy some more. What if the market gods aren't with us?

In the second column labelled "Adverse Case", I assigned weights of 50% neutral, 33% unfavorable and 16% favorable. Using the example of the long bond price factor, the expected alpha came to 0.80% per annum.

What happens if a catastrophic scenario? In the third column labelled "Worst Case", I assigned weights of 2/3 neutral, 1/3 unfavorable and 0 favorable. (Remember that these are weekly alphas and it would be difficult to believe that, in the case of the long bond price, it would fall for a single week in an entire year and would be rallying 17 weeks out of 52 weeks in the year.) The expected alpha in the worst case analysis for the long bond price factor came to -2.13%.


Conclusion
Putting it all together, the strategy looked pretty good. We could expect an alpha in the order of 3.0-3.6% a year - which is an astounding figure for a bond portfolio. In a typical bad year, we could still expect outperformance of 0.8% to 1.8%. If the roof caved in and everything went wrong, alpha deteriorated to between -2.1% and a positive 0.2%.

This is an example of a simple method of evaluating any investment strategy using scenario analysis with factor betas. This is another way of asking the question, "What can go wrong with the investment strategy and how badly could things fall apart?"

Ultimately, we passed on implementing the strategy not for investment reasons, but for business ones. If anyone is interested in further details or in funding such a bond strategy, please contact me at cam at hbhinvestments dot com and I will be happy to refer you to the bond manager.


Cam Hui is a portfolio manager at Qwest Investment Fund Management Ltd. ("Qwest"). This article is prepared by Mr. Hui as an outside business activity. As such, Qwest does not review or approve materials presented herein. The opinions and any recommendations expressed in this blog are those of the author and do not reflect the opinions or recommendations of Qwest.

None of the information or opinions expressed in this blog constitutes a solicitation for the purchase or sale of any security or other instrument. Nothing in this article constitutes investment advice and any recommendations that may be contained herein have not been based upon a consideration of the investment objectives, financial situation or particular needs of any specific recipient. Any purchase or sale activity in any securities or other instrument should be based upon your own analysis and conclusions. Past performance is not indicative of future results. Either Qwest or Mr. Hui may hold or control long or short positions in the securities or instruments mentioned.