I base my market analysis on different dimensions of analysis, which are summarized as follows:
- Technical analysis: The stock market has suffered much technical damage, which can be resolved with another leg down, or a sideways consolidation. Trend following models, as well as other projections, suggest considerable downside risk. Call the technical outlook neutral to bearish, with a tilt towards the bearish view.
- Sentiment analysis: Many sentiment models are showing off-the-charts levels of fear. It isn't any single measure of sentiment, but most sentiment measures an across the board basis. If there is so much fear, who is left to sell? Sentiment models are therefore very bullish.
- Macro analysis: Here, the outlook is mixed. The US economy is growing so well that the Fed is contemplating raising interest rates. There is no sign of a recession on the horizon, which is a bull market killer. However, there are concerns that the slowdown in China is leaking into other EM economies, which would pull down global growth. As we are mainly focused on the effects on US equities and the US economy remains robust, I would call this neutral to a mild positive.
- Fundamental momentum: One of the key driver of US equity valuation is earnings growth. Despite much angst over Q3 earnings, forward EPS are still rising, which is still supportive of stock prices. Looking into 2016, however, I do have some concerns about the pace of EPS growth, which could put a ceiling on stock prices. Call this a short-term positive, but medium term neutral to negative.
In short, the most bearish dimension is the technical picture. The other dimensions are either wildly bullish or mildly bullish. But let me go through each component of my analysis, one by one.
The charts look terrible
The long-term technical picture can be summarized by this chart. The SPX saw a violation of the uptrend that began in 2009. Moreover, it has fallen through its 50 and 200 day moving averages. Stock prices generally don`t see V-shaped recoveries when the major averages has suffered this much technical damage.

There are two scenarios to consider. The more optimistic one involves the market finds support somewhere and start to base through a period of sideways consolidation. The more bearish and seemingly consensus scenario among most chartists, is we are likely to see another downleg. The logical downside target would be a key support zone and Fibonacci retracement target at about 1570.
I see a lot of analysis indicating further downside risk. Here are just a few examples. Andrew Thrasher recently highlighted breadth deterioration indicating a bearish outlook.

Kirk Spano (via Marketwatch) pointed to heightened market risk (middle panel) and extreme downside risk (bottom panel):

Even Josh Brown is giving a nod to technical analysis during the current period of market turmoil:
So what can you go by to figure out the mood and psychology around a stock or a market? There’s only one thing: Price itself. And the numerous derivations of price – momentum, relative strength, volume, advancing vs declining issues, moving averages, historical levels of significance.These are just a few of the examples that came across my desk. I could go on, but you get the idea. Technically, the risk-reward of owning stocks right now is very unfavorable.
What you are seeing in price is market psychology writ large. The emotions and attitudes surrounding a given investment are being splattered before you on a canvas. All of the fundamental data that you and others could possibly be aware of is being reflected in the lines on the chart, all day every day.
When you look at these items, they don’t scream out a binary yes-or-no, buy-or-sell answer at you. But they tell you everything you need to know about how people feel. They give you clues to arrive at where the P in PE is headed. Some clues are more valid than others at different times and all clues can fool you. Something that was significant on Tuesday can be an utter red herring on Thursday.
Sentiment is contrarian bullish
I have demonstrated before (see A test for the bears) that sentiment models are showing a crowded short among several different groups of investors, namely retail (Rydex), US RIAs (NAAIM) and global institutions (BoAML Fund Manager Survey). With respect to sentiment models, I prefer metrics that reflect what people are actually doing with their money, instead of opinion surveys. That's why I give extra weight to measures like Rydex cash flows.

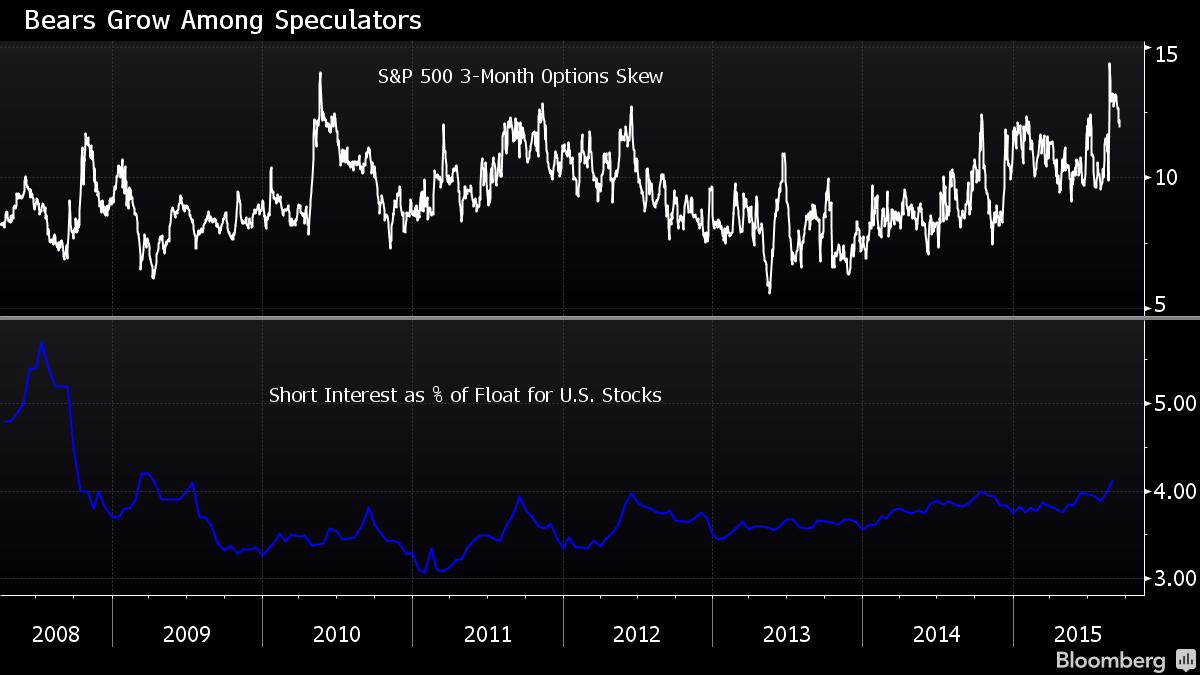
This chart (via Bloomberg) shows that option skew, or the cost of put option downside insurance compared to call option pricing, is elevated (top panel). In addition, short interest has been rising steadily (bottom panel). These are all signs of a contrarian bullish environment.

On the other hand, Barron's shows that "smart money" corporate insiders have been buying heavily since mid-August:
 To be sure, sentiment models don't work all the time and they are weak at pinpointing the exact date of a market bottom. I received a thoughtful email from an experienced trader, who highlighted this chart from Ed Yardeni. The green bars show periods when the II bull/bear ratio was under 1.0 (crowded short). To paraphrase Keynes, sentiment can get excessively fearful than the pain threshold of your portfolio.
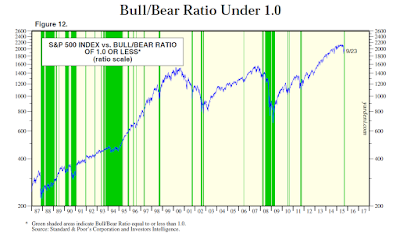
No indicator works all the time. That's why I rely different dimensions of market analysis.
A benign macro outlook
There are three ways that a bear market can begin:

This chart (via Bloomberg) shows that option skew, or the cost of put option downside insurance compared to call option pricing, is elevated (top panel). In addition, short interest has been rising steadily (bottom panel). These are all signs of a contrarian bullish environment.
On the other hand, Barron's shows that "smart money" corporate insiders have been buying heavily since mid-August:


No indicator works all the time. That's why I rely different dimensions of market analysis.
A benign macro outlook
There are three ways that a bear market can begin:
- Recession: There is no sign of a US recession on the horizon.
- Overly aggressive Fed tightening: You've got to be kidding me! Contrast the current Fed with 1987, when the Fed tightened twice in September to defend the Dollar.
- War or revolution leading to a permanent loss of capital: How are those Confederate bonds doing, or those Tsarist Russia railway bonds?
The last two causes are not an issue right now. So let me focus on the risks of a recession. Scott Grannis sees no signs of a recession from the credit markets. Here is his take:

The main source of market angst is the slowdown coming from China and its effects on global growth. There are signs that those concerns may be overstated (via Bloomberg):
EPS expectations holding up (for now)
The fourth major component that I use to analyze the stock market outlook is how EPS expectations are behaving (see my previous post The right and wrong way to analyze earnings for my analytical framework). Right now, forward 12 month EPS are still growing (via Factset, annotations in red are mine).

Ed Yardeni found that forward EPS is highly correlated with coincidental economic indicator and went on to guesstimate that the next recession would start in 2019

2015 = 1998 and 2011 (with a difference)
When I put it all together, my conclusion is that the template for the current corrective episode are 1998 and 2011. In both those cases, the US markets were spooked by the fear of contagion from abroad (Russia and Asia in 1998 and Europe in 2011), but the US was largely insulated from negative economic effects and life went on.
Using those episodes as rough roadmaps, the US equity market is likely to stay choppy for the next few weeks until the source of the market angst resolve themselves. It does mean that SPX downside projections of 1570 or lower are overblown. It does not mean, however, that the market will not decline and test the August lows or even the October 2014 lows at about 1820. In all likelihood, I believe we will see another minor leg down to test support in the 1820-1870 zone.
There is a key difference between 2015 and 1988 and 2011. Both of those previous corrective episodes saw the resumption of a bull trend in stock prices. This time, I have my concerns.
Given the excess fear in the markets, stocks are likely to see a reflex rally and a 2100 year-end SPX target is not unreasonable, but I have my doubts as to how much further it can go for fundamental reasons.
There is no question that the Federal Reserve is poised to raise interest rates, the only question is when, not if. When rates rise, it will start to compress the P/E ratio (because the inverse E/P is dependent on interest rates). That will put tremendous pressure on the E in that ratio to expand, which may be doubtful.
The economic cycle is maturing and the signs of a tightening labor market are everywhere. The key question as we look forward into 2016. How much can earnings grow in the face of margin pressure from rising labor costs? Jim Paulsen of Wells Capital Management recently voiced these worries, though he phrased his concerns in the context of an aging profit cycle (emphasis added):
Margins could unexpectedly improve should the USD weaken. Factset did show that there is a distinct difference in Q3 earnings and revenue growth for companies exposed to the domestic economy compared to foreign sourced sales (annotations in red are mine).

In conclusion, my base case scenario calls for the market to bounce around for the next few weeks, with a rally into year-end and January. Looking out into 2016, labor costs and the USD will be key drivers of SPX profit expectations - and stock prices. In the absence of a retreat in the USD, the SPX will likely become range-bound in 2016 with 2100-2200 as a ceiling and 1900-2000 as a floor, which would fit well with a resolution of the technical damage done through a period of basing and sideways consolidation.
One last word addressed to my bearish doubters. Before you start flaming me, just a reminder that this post is in effect a mirror image of what I wrote in May: Why I am bearish (and what would change my mind).
Today, money is abundant and resources are abundant. Even energy is abundant, because its price has fallen by over 50% in the past year or so. Corporate profits are near record highs, the supply of labor is virtually unconstrained, energy is suddenly cheap, and productive capacity is relatively abundant. This adds up to a lot of room for maneuver and very little reason for the economic engine of growth to shut down.New Deal democrat came to a similar, but more nuanced conclusion. He maintains a weekly watch on the high frequency economic indicators and he divides them into long leading, short leading and coincidental indicators. Here are his latest comments from last week:
This week like last week highlighted the difference between those portions of the US economy most exposed to global forces, which have all turned negative, and those most insulated from global problems, which are all positive, and even strengthening. I suspect that the globe, as a whole, is in recession. With good numbers in housing and vehicle sales, and especially with gas prices declining again, the US is still positive, and although I believe we are past the midpoint of this expansion, I still remain positive through the first half of next year.The American economy and consumer remains strong. Here is the relative returns of the Consumer Discretionary sector and some of its components relative to the SPX. With the exception of Media, which is underperforming, does this look like the market is worried about the consumer?

The main source of market angst is the slowdown coming from China and its effects on global growth. There are signs that those concerns may be overstated (via Bloomberg):
China’s economy isn’t as weak as it may look, according to a private survey from a New York-based research group that says it’s a myth the nation’s slowdown is intensifying.There are signs that all of the stimulus is paying off as the Chinese economy is starting to see a cyclical upturn. The South China Morning Post reported that the property market and land sales in first and second tier Chinese cities are perking up.
“No collapse is nigh” in the aftermath of the stock market plunge and currency devaluation, according to the third-quarter China Beige Book, published by CBB International and modeled on the survey compiled by the Federal Reserve on the U.S. economy. Capital expenditure rebounded slightly in the period and the services sector showed strength, the report said.
“Perceptions of China may be more thoroughly divorced from facts on the ground than at any time in our nearly five years of surveying the economy,” CBB President Leland Miller wrote in the report. “Global sentiment on China has veered sharply bearish--too bearish. While we have long cautioned clients against relying on rosy official views of the Chinese economy, we believe sentiment has swung substantially too far in the opposite direction.”
The report describes a mixed, rather than disastrous, picture of the world’s second-largest economy. Weakening exports, deepening factory-gate deflation and a manufacturing slowdown have highlighted the risk of this year’s expansion undershooting Premier Li Keqiang’s target for growth of about 7 percent.
Developers have begun to beef up their land banks as China's residential property market shows signs of steady recovery.If the US economy remains robust and China is turning up again, what are you so worried about?
Most of these land purchases are occurring in first- and second-tier cites but the resultant rise in land prices could squeeze some smaller players out of the market, say analysts.
"Land transactions, especially in the first-tier cities, have become very active," said David Ji, head of research and consultancy, Greater China, at international property consultant Knight Frank. "As property prices and transaction volumes rebound, developers have started bidding aggressively to replenish their land banks," he said.
EPS expectations holding up (for now)
The fourth major component that I use to analyze the stock market outlook is how EPS expectations are behaving (see my previous post The right and wrong way to analyze earnings for my analytical framework). Right now, forward 12 month EPS are still growing (via Factset, annotations in red are mine).

Ed Yardeni found that forward EPS is highly correlated with coincidental economic indicator and went on to guesstimate that the next recession would start in 2019
SP 500 forward earnings is highly correlated with the US index of coincident economic indicators (CEI). The latter rose to another new record high during August. Previously, I have observed that based on the past five cycles in the CEI, the next recession should start during March 2019. That’s not based on science, but rather on a simple average of the length of the previous expansions once the CEI had rebounded back to its previous cyclical peak. So it’s a benchmark of what could happen based on what happened in the past on average.
In any event, I’ve circled March 2019 as the possible date for the next recession. Given the Fed’s latest decision to do nothing, it’s safe to bet that the next recession won’t be caused by the tightening of monetary policy anytime soon. It could be caused by a severe downturn abroad, I suppose. More likely is that the US will continue to grow fast enough to keep the global economy growing as well, albeit at a pace that is best described as “secular stagnation.”

2015 = 1998 and 2011 (with a difference)
When I put it all together, my conclusion is that the template for the current corrective episode are 1998 and 2011. In both those cases, the US markets were spooked by the fear of contagion from abroad (Russia and Asia in 1998 and Europe in 2011), but the US was largely insulated from negative economic effects and life went on.
Using those episodes as rough roadmaps, the US equity market is likely to stay choppy for the next few weeks until the source of the market angst resolve themselves. It does mean that SPX downside projections of 1570 or lower are overblown. It does not mean, however, that the market will not decline and test the August lows or even the October 2014 lows at about 1820. In all likelihood, I believe we will see another minor leg down to test support in the 1820-1870 zone.
There is a key difference between 2015 and 1988 and 2011. Both of those previous corrective episodes saw the resumption of a bull trend in stock prices. This time, I have my concerns.
Given the excess fear in the markets, stocks are likely to see a reflex rally and a 2100 year-end SPX target is not unreasonable, but I have my doubts as to how much further it can go for fundamental reasons.
There is no question that the Federal Reserve is poised to raise interest rates, the only question is when, not if. When rates rise, it will start to compress the P/E ratio (because the inverse E/P is dependent on interest rates). That will put tremendous pressure on the E in that ratio to expand, which may be doubtful.
The economic cycle is maturing and the signs of a tightening labor market are everywhere. The key question as we look forward into 2016. How much can earnings grow in the face of margin pressure from rising labor costs? Jim Paulsen of Wells Capital Management recently voiced these worries, though he phrased his concerns in the context of an aging profit cycle (emphasis added):
Earnings performance is well past its best for this recovery and investors need to consider whether earnings growth will prove sufficient to support current stock market valuations. The rapidly aging earnings cycle is perhaps best illustrated by an economy nearing full employment with corporate profit margins near record highs. Should global growth remain tepid and overall sales results modest, since profit margins are unlikely to rise much, earnings trends will also likely prove disappointing. Conversely, should global growth and corporate sales results accelerate, because the U.S. is nearing full employment, companies may soon face cost-push pressures and margin erosion which will likely off set improved sales results.Indeed, the latest speech from Janet Yellen today indicated that the economy is nearing full employment (emphasis added):
Essentially, it is difficult to see how earnings growth will be adequate during the rest of this mature recovery to support current price/earnings multiples. Is a relatively modest earnings growth against a backdrop of rising inflation and higher interest rates sufficient to support the current 18 to 19 times price/earnings multiple?
Although other indicators suggest that the unemployment rate currently understates how much slack remains in the labor market, on balance the economy is no longer far away from full employment.In that case, wage pressures will surely start to pressure operating margins.
Margins could unexpectedly improve should the USD weaken. Factset did show that there is a distinct difference in Q3 earnings and revenue growth for companies exposed to the domestic economy compared to foreign sourced sales (annotations in red are mine).

In conclusion, my base case scenario calls for the market to bounce around for the next few weeks, with a rally into year-end and January. Looking out into 2016, labor costs and the USD will be key drivers of SPX profit expectations - and stock prices. In the absence of a retreat in the USD, the SPX will likely become range-bound in 2016 with 2100-2200 as a ceiling and 1900-2000 as a floor, which would fit well with a resolution of the technical damage done through a period of basing and sideways consolidation.
One last word addressed to my bearish doubters. Before you start flaming me, just a reminder that this post is in effect a mirror image of what I wrote in May: Why I am bearish (and what would change my mind).
17 comments:
Well reasoned post. But the last two recessions were triggered (or curiously coincident with) bursting financial bubbles. I happen to think there is that risk now (Glencore or Petrobras or some country or institution default for instance). These effects are not captured by LEIs. But you may still be right and these events may just knock down the averages as you suggest. LEIs aren't looking too good by the way but aren't recessionary (absent a shock, financial or otherwise).
There's good reason to think that most people won't predict the next recession.
I just checked and the LEIs did not successfully predict the 2001 and 2007 recessions. They predicted slowdown but not recession. Both recessions were caused by burst financial bubbles -- the stock market plunge in 2001 and the ongoing financial crisis in 2007. So far, there's no financial "event" yet, but I'm confident one is coming that will confound most prognosticators.
Hi Cam,
I would suggest the forward EPS outlook is weakening, not strengthening.
See http://us.spindices.com/indices/equity/sp-500 , go to Additional Info, Index Earnings, then lines 84-92 of the spreadsheet.
To summarize: 2015EST EPS has fallen from $137.19 in Mar 2014 to $111.26 currently and 2016EST EPS has fallen from $134.75 in Mar 2015 to $129.73 currently.
all the best
Anon - FYxx EPS almost always fall. You have to normalize with forward 12m EPS. See my previous post: http://humblestudentofthemarkets.blogspot.com/2015/09/why-you-shouldnt-freak-out-about.html
Doug - You are correct that most forecasters are not good at turning points. You are postulating a financial crisis, which is a tail-risk event and really a guess on your part. If I knew the future about a tail-risk event, e.g. California getting hit with THE BIG ONE and sliding into the Pacific, I would be able to make money too. I prefer not to bet on unknowable tail-risk, which, by definition, is a low probability event.
Cam,
Forward EPS is very lagging indicator. It was still rising in late 2007 as the economy was entering a recession. I don't think we can take it to the bank. Actual earnings have rolled over and earnings lead the business cycle, very reliably. Of course, earnings can turn back up again but the probabilities are more evenly placed here that "recession is remote" would suggest.
If the thesis is that the S&P goes weak after rates begin rising, you have to explain where the money will go. S&P still provides the best return.
Also note that from 1998-2000 unemployment was well below 5%. *THAT* is the standard for the US economy. And it was a great time to be in the market!
I'm also skeptical about the crazy bear cases being spread all over right now. If people really were scared about a China crash or currency liquidity crisis or a global recession or blah blah, they'd be buying gold hand over fist to protect against tail risk. The recent market crash was just VaR models acting screwy, and it'll take a while to develop and program new models.
Brief yet thorough analysis which I appreciate greatly. I see it similarly at present. The next few weeks will be telling and likely will hold that US economy continues to expand nicely, though not robustly.
Adding to this analysis, experience and history indicate that most market tops happen after significant EPS growth driven by capital shifting from interest bearing instruments into the equity markets which typically occurs at the initial start of rising rates. This final phase of the market reaches a zenith when those same rising rates become a perceived threat to continued economic expansion. This perception is based on real economic data indicating such.
WIth that said, we are at the initial stage of rising rates in the US, while much of the rest of the world is still focused on monetary stimulus. Are we 6 months, 12 months, 2 years from the point where rising US rates result in real economic slowdown. Hard to say, but it seems clear we are at the beginning of the final bull phase in this particular business cycle, not the end.
The only argument against this is to think China has no ammunition to stimulate it's economy and thus sees continued erosion leading to global deflation. This may be the long term scenario of our Supply Side Global Economic environment, but not quite there yet.
Cam. Many irresponsible things have happened, debt-wise, in the global economy thanks to central banks' continued munificence since 2008/2009. Expecting this fragile world to break in the near to intermediate term would not qualify as some random event like a California earthquake. It is as inevitable as the destruction of an antique vase in the middle of a room full of five year olds.
I think the big piece that is missing is the consumer. Namely, the debt consumers carry and even the smallest rise in interest cost is going to have a detrimental effect on spending. I would not be surprised if that fear has disproportionally skewed market behavior as of late more so than is being talked about.
But we have had 2 such 'low probability events' within the last 15 years! Don't you think that makes these tail-risk market crashes fairly common? The fact is that a lot of people have 401K's that are invested. The market has gone down about 10 percent from a peak that lasted several months. Some people will notice that. They will then go into cash. The market will go down some more. That will cause more people to go into cash. Yadda yadda.
Do people spend more, less or the same when their life savings have taken a 10 percent hit?
How will that spending cutback affect profits?
Forward earnings still rising? Where is 'factset' getting this data? When I see what is going on in the economy and I see this continual chart you post with never ending rising earnings expectations, I really start wondering if the whole world is going bonkers and not just the looney global warming crowd.
Here's what the reuters had to say this morning:
" Wall Street Braces For Grim Third Quarter Earnings Season (Reuters)
Wall Street is bracing for a grim earnings season, with little improvement expected anytime soon. Analysts have been cutting projections for the third quarter, which ends on Wednesday, and beyond. If the declining projections are realized, already costly stocks could become pricier and equity investors could become even more skittish. Forecasts for third-quarter S&P 500 earnings now call for a 3.9% decline from a year ago, based on Thomson Reuters data, with half of the S&P sectors estimated to post lower profits thanks to falling oil prices, a strong U.S. dollar and weak global demand. Expectations for future quarters are falling as well. A rolling 12-month forward earnings per share forecast now stands near negative 2%, the lowest since late 2009, when it was down 10.1%, according to Thomson Reuters I/B/E/S data."
Ah, yes, something a little bit more to the liking of my 'reality based' mind.
It is apparent that 'factset' is just some kind of purveyor of 'adjusted' facts.
And another reason why I tend to only use tech analysis, because it seems to me it is harder to make up stuff out of whole clothe and represent it as fact. (set)
Randy is right, we've had 2 low probability events in the past 15 years. Bubbles are bursting everywhere. Once one of the EM countries run into an even bigger crisis (Turkey, Malaysia, Brazil, Petrobras, Venezuela, Argentina,etc), it will have a knock-on effect on all the others. The dollar rises which further kills the EMs. It's a recipe for a very big decline. China is a house of cards. Europe is a house of cards. Deutsche Bank is a house of cards. Debt is higher than ever compared to 2007. Greenspan is pilloried for having rates too low for just 2 years but it set in motion the housing bubble that burst in 2007. We've had zero Fed Funds rates for nearly 7 years now. None of us even know how much hidden leverage is lurking due to zero rates. Cam, you may very well be right with regard to your targets. I actually think your reasoning is excellent. But no, I don't think it's a stretch to expect financial crises as a "base case". It's my base case, but we'll see how it plays out. It's unknowable as you rightly point out. Obviously I'm not "betting the farm" on such an unknowable scenario, but I've hedged my small portion of dividend paying stocks (utilities, telecom, tobacco, reits). As an early-retiree, I live on dividends, so with some preferred shares and muni bond funds, my 14% dividend-paying equity allocation is fully hedged at this time.
>> 1998 and 2011
The 1998 episode ended with a surprise rate cut which Greenspan timed to fall on opt. exp.
The similarities of the S&P chart with 2011 are actually quite interesting, however it ended with "operation twist" and more QE later on.
I assume the Fed will not help this October, so only a good earnings season could provide for enough enthusiasm to get this market out of its confusion, or a rebound in commodities.
I don't know enough about the nuances of a bear market definition to make a case.
So all's I will say is that this market has a bearish bias.
Meaning that rallies should be shorted.
And buying the dips should be avoided.
http://humblestudentofthemarkets.blogspot.com/2008/01/sentiment-models-going-to-more-bearish.html
Sentiment models are contrarian, until they aren't. Better for btfd buying, trouble is you don't know if it's a dip, correction, or something nastier. Pretty impossible to say right now. And while yes, A market crisis is a tail risk, butwe are also reaching the end of a natural cycle. National bureau of economic says since 1854, cycles have been 38.7 months on average! Crazy short. Luckily since 1945 they have grown to 58.4, just under five years from trough to peak. We are at what, 72-74 months? 4 of 11 cycles since 1945 were longer. (Also interesting, none before 1945 were longer than 50 months.) We have time, question is how much will going to cash today give up over the next 2-3 years if this isn't the big one, and how big will the next correction be. All impossible to answer, more important answering your own risk tolerance and liquidity profile for the next two to three years....and how much leverage people have (which is at or near all time highs, added risk I would certainly be removing, and people will, which will be a head wind).
Sentiment may be bearish but it is now in sync with the primary trend and must be judged accordingly.
Great blog There are two scenarios to consider. The more optimistic one involves the market finds support somewhere and start to base through a period of sideways consolidation.Thanks for sharing......
Get Fast Growth Business Consultancy | Fast Growth Business and Problems Solution Provider
Post a Comment