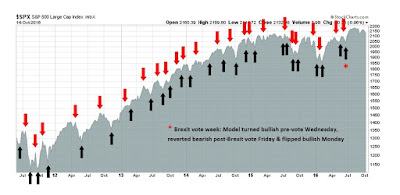
We maintain several market timing models, each with differing time horizons. The "Ultimate Market Timing Model" is a long-term market timing model based on the research outlined in our post, Building the ultimate market timing model. This model tends to generate only a handful of signals each decade.
The Trend Model is an asset allocation model which applies trend following principles based on the inputs of global stock and commodity price. This model has a shorter time horizon and tends to turn over about 4-6 times a year. In essence, it seeks to answer the question, "Is the trend in the global economy expansion (bullish) or contraction (bearish)?"
My inner trader uses the trading component of the Trend Model to look for changes in direction of the main Trend Model signal. A bullish Trend Model signal that gets less bullish is a trading "sell" signal. Conversely, a bearish Trend Model signal that gets less bearish is a trading "buy" signal. The history of actual out-of-sample (not backtested) signals of the trading model are shown by the arrows in the chart below. Past trading of the trading model has shown turnover rates of about 200% per month.
The latest signals of each model are as follows:
- Ultimate market timing model: Buy equities*
- Trend Model signal: Risk-on*
- Trading model: Bullish*
Update schedule: I generally update model readings on my site on weekends and tweet any changes during the week at @humblestudent. Subscribers will also receive email notices of any changes in my trading portfolio.
How will the Fed fight the next war?
In my last post (see A sentimental embrace of risk), I showed that risk appetite was starting to perk up. Investor interest is rising in both the reflation and cyclical investment themes. So far, this risk-on thesis is showing solid fundamental underpinnings.
The bearish strategists at Goldman Sachs and HSBC who had forecasted a disappointing Q3 earnings season have so far been wrong (see Q3 earnings season: Stud or dud?). With 23% of SPX companies having reported earnings, John Butters of Factset observed that both the EPS and sales beat are well above their 5-year historical averages. As a result, Street optimism continues to improve as forward 12-month EPS rose another 0.16% in the week (chart annotations are mine).
The stock market is on pace to rally on the back of a growth revival and the end of the earnings recession that began in late 2014. This party is just starting to going. The only question is when the Fed will act to take away the punch bowl. This issue is becoming a crucial question for investors, as speeches from Yellen and Fischer last week may indicate that the Fed is signaling the start of a shift in thinking of how it fights the next war, persistent low growth.
The full post can be found at our new site here.


No comments:
Post a Comment