We maintain several market timing models, each with differing time horizons. The "Ultimate Market Timing Model" is a long-term market timing model based on the research outlined in our post, Building the ultimate market timing model. This model tends to generate only a handful of signals each decade.
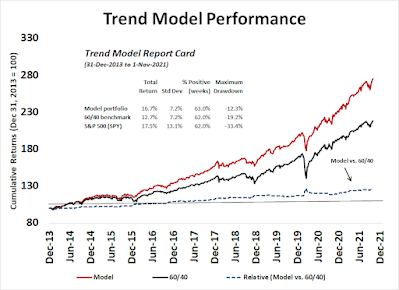
The Trend Asset Allocation Model is an asset allocation model that applies trend following principles based on the inputs of global stock and commodity price. This model has a shorter time horizon and tends to turn over about 4-6 times a year. The performance and full details of a model portfolio based on the out-of-sample signals of the Trend Model can be found here.
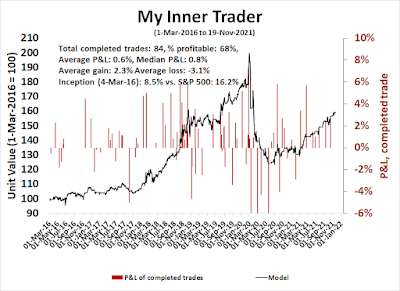
My inner trader uses a trading model, which is a blend of price momentum (is the Trend Model becoming more bullish, or bearish?) and overbought/oversold extremes (don't buy if the trend is overbought, and vice versa). Subscribers receive real-time alerts of model changes, and a hypothetical trading record of the email alerts is updated weekly here. The hypothetical trading record of the trading model of the real-time alerts that began in March 2016 is shown below.
The latest signals of each model are as follows:
- Ultimate market timing model: Buy equities*
- Trend Model signal: Bullish*
- Trading model: Bullish*
Update schedule: I generally update model readings on my site on weekends and tweet mid-week observations at @humblestudent. Subscribers receive real-time alerts of trading model changes, and a hypothetical trading record of those email alerts is shown here.
Subscribers can access the latest signal in real-time here.
Author's note: There will be no mid-week market update next week because of the holiday-shortened week.
Melt-up risk control
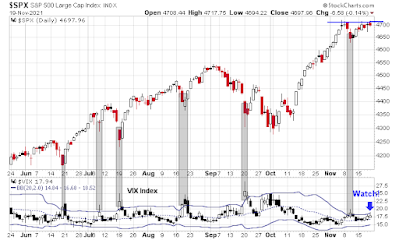
The good news is the S&P 500 is testing resistance and less than 1% from its all-time high. Moreover, the recent sideways consolidation has elevated the VIX Index to near its upper Bollinger Band. An upside breakout of the Bollinger Band would constitute an oversold reading for the stock market that carries with it the prospect of more price gains. The market is presenting investors with an unusual condition of a breakout test while exhibiting a near oversold condition.
The bad news is a number of negative divergences have appeared warning of near-term weakness ahead. Even though a melt-up into year-end remains my base case, investors need to practice some risk control in case the advance unravels.
The full post can be found here.
No comments:
Post a Comment