Showing posts with label quantitative analysis. Show all posts

Sunday, April 20, 2025

60/40 in an era of American Unexceptionalism


Preface: Explaining our market timing models 
We maintain several market timing models, each with differing time horizons. The "Ultimate Market Timing Model" is a long-term market timing model based on the research outlined in our post, Building the ultimate market timing model. This model tends to generate only a handful of signals each decade.

The Trend Asset Allocation Model is an asset allocation model that applies trend-following principles based on the inputs of global stock and commodity prices. This model has a shorter time horizon and tends to turn over about 4-6 times a year. The performance and full details of a model portfolio based on the out-of-sample signals of the Trend Model can be found here.

  
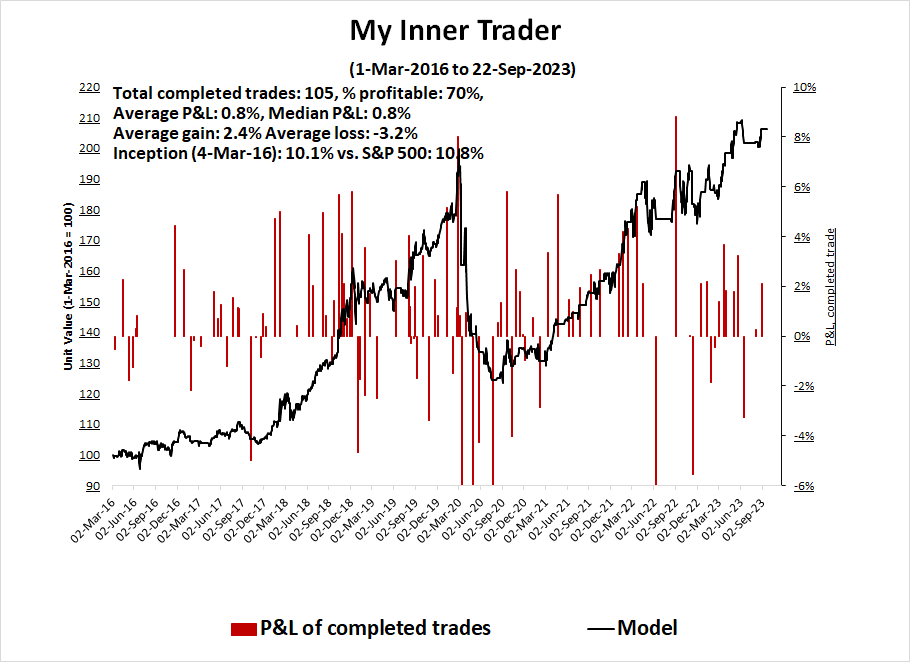
My inner trader uses a trading model, which is a blend of price momentum (is the Trend Model becoming more bullish, or bearish?) and overbought/oversold extremes (don't buy if the trend is overbought, and vice versa). Subscribers receive real-time alerts of model changes, and a hypothetical trading record of the email alerts is updated weekly here. The hypothetical trading record of the trading model of the real-time alerts that began in March 2016 is shown below.

 
The latest signals of each model are as follows:
  • Ultimate market timing model: Buy equities (Last changed from “sell” on 28-Jul-2023)*
  • Trend Model signal: Bearish (Last changed from “neutral” on 11-Apr-2025)*
  • Trading model: Bullish (Last changed from “neutral” on 28-Feb-2025)*
* The performance chart and model readings have been delayed by a week out of respect to our paying subscribers.

Update schedule: I generally update model readings on my site on weekends. I am also on X/Twitter at @humblestudent and on BlueSky at @humblestudent.bsky.social. Subscribers receive real-time alerts of trading model changes, and a hypothetical trading record of those email alerts is shown here.

Subscribers can access the latest signal in real time here.

Threats to the 60/40 Portfolio

The conventional asset mix of 60% equities and 40% bond is designed to maximize return and minimize volatility risk under a reasonable set of risk tolerance assumptions. The equity portion of the portfolio is meant to provide growth, while the bond portion is designed to provide portfolio stability as bond prices have low to negative correlation to stock prices. In addition, bonds have the additional benefit of a steady income and high assurance of capital preservation, or getting your money back.
 
What happens if the “getting your money back” assumption is shaken?
 
Investors saw that recently when Treasury yields rose (and Treasury prices fell) and the USD fell at the same time. The episode was interpreted as a possible end to the era of American Exceptionalism and the USD as a safe-haven asset. While we saw a similar episode in early 2018, it nevertheless underscores concerns about the 60/40 portfolio as stock bond correlations were rising in both instances. Rising correlation leads to greater portfolio volatility and a reduction in the diversification effects of the two asset classes, which can be worrisome during the current climate of elevated market stress.

What can investors do under such circumstances?
 

The full post can be found here.


Special announcement: Humble Student of the Markets will cease publication on March 31, 2026. See this announcement for more details and updates.  

Sunday, December 29, 2024

Contrarian bargains among Santa's discards


Preface: Explaining our market timing models 
We maintain several market timing models, each with differing time horizons. The "Ultimate Market Timing Model" is a long-term market timing model based on the research outlined in our post, Building the ultimate market timing model. This model tends to generate only a handful of signals each decade.

The Trend Asset Allocation Model is an asset allocation model that applies trend-following principles based on the inputs of global stock and commodity prices. This model has a shorter time horizon and tends to turn over about 4-6 times a year. The performance and full details of a model portfolio based on the out-of-sample signals of the Trend Model can be found here.

My inner trader uses a trading model, which is a blend of price momentum (is the Trend Model becoming more bullish, or bearish?) and overbought/oversold extremes (don't buy if the trend is overbought, and vice versa). Subscribers receive real-time alerts of model changes, and a hypothetical trading record of the email alerts is updated weekly here. The hypothetical trading record of the trading model of the real-time alerts that began in March 2016 is shown below.

 
The latest signals of each model are as follows:
  • Ultimate market timing model: Buy equities (Last changed from “sell” on 28-Jul-2023)*
  • Trend Model signal: Neutral (Last changed from “bullish” on 15-Nov-2024)*
  • Trading model: Bullish (Last changed from “neutral” on 19-Dec-2024)*
* The performance chart and model readings have been delayed by a week out of respect to our paying subscribers.

Update schedule: I generally update model readings on my site on weekends. I am also on X/Twitter at @humblestudent and on BlueSky at @humblestudent.bsky.social. Subscribers receive real-time alerts of trading model changes, and a hypothetical trading record of those email alerts is shown here.

Subscribers can access the latest signal in real time here.

If Santa should fail to call…

The Santa Claus rally window is the last four days of the year and the first two days of the new year, and it’s one of the seasonally bullish periods of the year. History shows that a failed Santa rally often leads to subpar returns for the remainder of the year. The first day of the window was December 24. So far, the market has performed well this year. 

There is an adage among traders: “If Santa should fail to call, the bears may come to Broad and Wall”. If the advance continues, the risk of a major bear market in 2025 is diminished though.

  
So far, the question of whether Santa Claus will appear this year is a toss-up. It is constructive that Friday’s S&P 500 decline bounced off the 50 dma. While the S&P 500 closed marginally below the December 23 close, which is the Santa Claus rally starting level, both the Dow and Russell 2000 closed above their respective Santa rally levels. 

 
The full post can be found here.

Sunday, November 10, 2024

How to trade the Trump euphoria rally

Preface: Explaining our market timing models 
We maintain several market timing models, each with differing time horizons. The "Ultimate Market Timing Model" is a long-term market timing model based on the research outlined in our post, Building the ultimate market timing model. This model tends to generate only a handful of signals each decade.

The Trend Asset Allocation Model is an asset allocation model that applies trend-following principles based on the inputs of global stock and commodity prices. This model has a shorter time horizon and tends to turn over about 4-6 times a year. The performance and full details of a model portfolio based on the out-of-sample signals of the Trend Model can be found here.


My inner trader uses a trading model, which is a blend of price momentum (is the Trend Model becoming more bullish, or bearish?) and overbought/oversold extremes (don't buy if the trend is overbought, and vice versa). Subscribers receive real-time alerts of model changes, and a hypothetical trading record of the email alerts is updated weekly here. The hypothetical trading record of the trading model of the real-time alerts that began in March 2016 is shown below.


The latest signals of each model are as follows:

  • Ultimate market timing model: Buy equities (Last changed from “sell” on 28-Jul-2023)*
  • Trend Model signal: Bullish (Last changed from “neutral” on 11-Oct-2024)*
  • Trading model: Bullish (Last changed from “neutral” on 15-Oct-2024)*
* The performance chart and model readings have been delayed by a week out of respect to our paying subscribers.

Update schedule: I generally update model readings on my site on weekends. I am also on X/Twitter at @humblestudent and on BlueSky at @humblestudent.bsky.social. Subscribers receive real-time alerts of trading model changes, and a hypothetical trading record of those email alerts is shown here.

Subscribers can access the latest signal in real time here.

A cloudy crystal ball

As a quantitative equity manager, I employed diversified and uncorrelated groups of factors to pick stocks, including technical analysis, earnings expectations, valuation, growth and growth at a reasonable price. During my tenure, different markets would experience external shocks, such as financial crises (Asian Crisis) and natural disasters (Fukushim). The quantitative factor response playbook would always follow the same script. 

It begins with a price shock as everyone scrambles to assess the market implications. During this period, none of the stock picking factors worked because of the new information that isn’t reflected in the factors. 
 
As the market begins to settle down, technical analysis factors would show alpha. This would be followed by estimate revision. That’s because company analysts don’t revise their earnings estimates until they can quantify the effects of the shock. This would be followed by the fundamental factors, such as value and growth. As an example, I flattened all my positions in an equity market-neutral portfolio in the wake of 9/11 as I knew I would only be trading on noise until there was greater clarity on fundamentals.

While the Trump victory doesn’t qualify as a disaster in the manner of Fukushima or 9/11, it does represent a discontinuous external shock to market expectations whose effects are difficult to quantify. While the direction of policy changes are known, the magnitude of their effects are difficult to estimate without knowing the exact details.

It is in that spirit I would assert the only guidance investors can rely on are market price signals, or technical analysis. That’s why it’s difficult to predict how the markets are likely to behave under the Trump Administration before he takes office.

My crystal ball is cloudy beyond a few weeks, but I can still take a look at the price response to the news.

 
The full post can be found here.

Saturday, November 2, 2024

A final update on the Trump Trade: Tail-risk assessment

Preface: Explaining our market timing models 
We maintain several market timing models, each with differing time horizons. The "Ultimate Market Timing Model" is a long-term market timing model based on the research outlined in our post, Building the ultimate market timing model. This model tends to generate only a handful of signals each decade.

The Trend Asset Allocation Model is an asset allocation model that applies trend-following principles based on the inputs of global stock and commodity prices. This model has a shorter time horizon and tends to turn over about 4-6 times a year. The performance and full details of a model portfolio based on the out-of-sample signals of the Trend Model can be found here.


My inner trader uses a trading model, which is a blend of price momentum (is the Trend Model becoming more bullish, or bearish?) and overbought/oversold extremes (don't buy if the trend is overbought, and vice versa). Subscribers receive real-time alerts of model changes, and a hypothetical trading record of the email alerts is updated weekly here. The hypothetical trading record of the trading model of the real-time alerts that began in March 2016 is shown below.


The latest signals of each model are as follows:

  • Ultimate market timing model: Buy equities (Last changed from “sell” on 28-Jul-2023)*
  • Trend Model signal: Bullish (Last changed from “neutral” on 11-Oct-2024)*
  • Trading model: Bullish (Last changed from “neutral” on 15-Oct-2024)*
* The performance chart and model readings have been delayed by a week out of respect to our paying subscribers.

Update schedule: I generally update model readings on my site on weekends. I am also on X/Twitter at @humblestudent. Subscribers receive real-time alerts of trading model changes, and a hypothetical trading record of those email alerts is shown here.

Subscribers can access the latest signal in real time here.
 

A Trump Trade update

Just ahead of the U.S. election, here is an update on the polls and the Trump trade. The polls show a very tight race. As a matter of perspective, here is a sensitivity analysis of what would happen if the polling errors were the same as they were in 2020 and 2022.

My view is that the election has been a referendum on Trump. Trump has always had a base support of about 40% of the electorate. Against that, the Democrats have their base and a coalition of never-Trumper Republicans. Opinions on both sides have been substantially dug in. What really matters in the end is the effectiveness of each side’s “get out the vote” efforts.
 
As a reminder, each of following charts of Trump factors is designed so that a rising line denotes rising favourability for a Trump victory. 
  • Trump Media & Technology Group: It’s a proxy for Trump enthusiasm as it’s the holding company for Truth Social, Trump’s social media vehicle.
  • Domestic Revenue Stock ETF vs. S&P 500: One of Trump’s main platforms is to use tariffs to bring manufacturing back to the U.S.
  • Inflation Expectations: Trump’s tariff policies are expected to be inflationary.
  • Poland vs. Euro STOXX 50: Poland has been a surprise growth engine in the EU, but it neighbours Ukraine and the relative performance of its market is a measure of Ukrainian anxiety.
  • Gasoline Price: Gasoline can be thought of as an anti-incumbent trade. Rising prices depress consumer sentiment and it’s negative for the incumbent.
Each has its idiosyncrasies. Even though Trump factors have taken a last-minute wobble, the general trend in the Trump trade has been up.

The full post can be found here.

Saturday, August 31, 2024

LBO insights: Why these deep value stocks have become even cheaper

Mark Hulbert recently published an ominous warning at MarketWatch about excessive valuation in the U.S. equity market. Most valuation ratios are in the top 90% since 2000 and “as overvalued as it was at the market top on Jan. 3, 2022”.


How worried should you be?
 
The full post can be found here.

Wednesday, August 28, 2024

Risk budgeting ahead of NVIDIA's earnings report

Mid-week market update: Several readers asked me for comments going into NVIDIA's earnings report Wednesday night, so I thought I would publish my mid-week update a little earlier than usual.
 
Bottom line, I have no idea about NVIDIA's fundamentals. You can study the chart pattern, but event-driven market moves are "roll the dice" moments. Instead of trying to focus on what how stock and the market will move after the earnings report, my inclination is to focus on portfolio risk during these binary events. How is your portfolio positioned relative to your risk budget?


Even though I can offer no insights on market direction, here are some thoughts on risk from the option market.

The full post can be found here.

Wednesday, August 7, 2024

Why the market panic may not be over

Mid-week market update: Is the worst of the Japanese risk-off episode over? The Nikkei formed a bullish harami pattern when it recovered on Tuesday, but the recovery candle formed an "inside day" compared to Monday's massive downdraft. As well, BOJ deputy governor Governor Shinichi Uchida calmed markets and struck a dovish tone when he said that the Bank would "refrain from hiking interest rates when the markets are unstable".
 

While I am hopeful that the worse of the panic is over, I have some nagging doubts. Here's why.

The full post can be found here.

Saturday, July 27, 2024

China slowdown = Reduce risk

It’s becoming harder and harder to avoid the cold hard facts. China is slowing. The PBOC unexpectedly cut interest rates last week. The central bank began by cutting the benchmark lending rate on overnight, 7-day and 1-month standing lending facility (SLF). The move was followed by another surprising 0.20% cut in its 1-year policy rate, which is more than its usual move of 0.10% cuts.

The Citi China Economic Surprise Index, which measures whether economic statistics are beating or missing expectations, peaked in Q1 and it has been falling ever since. The market had hoped for some signs of new direction or signals of stimulus from the Third Plenum, but the communiqué was uninspiring.
 
 
As China’s economy slows, there are signs that it’s starting to take a toll on global risk appetite.

The full post can be found here.

Saturday, May 25, 2024

How to buy a company with no money

Perhaps you remember the late-night television commercials selling tapes and courses on how to buy real estate with no money down. One memorable character from the early 1990s ran infomercials featuring him on a yacht surrounded by bikini-clad women to emphasize how he, a Vietnamese refugee, had made a fortune from nothing. You could do the same thing if you bought his course.

The Wall Street equivalent of buying a company with no money down is the leveraged buyout, or LBO. The LBO was made possible by the popularization of junk bond, or high yield bond, financings, which was a financial innovation from the 1980s.
 
Even though the LBO has gone mostly out of usage, it may be time to revisit LBO targets now that high yield spreads are narrowing. I screened non-financial stocks in the S&P 1500 for LBO candidates and came up with a number of interesting insights. 


It turns out that LBO candidates are relatively rare. They may be the modern deep value equivalent of Ben Graham’s formulation of stocks trading below net-net working capital or current assets minus all debt.
 
The full post can be found here.

Saturday, May 4, 2024

Value or growth? Here's an analytical framework for decision making

Should you be a value or growth investor?

The accompanying chart shows the historical record. In the last 20 years, growth has handily beaten value. The U.S. value/growth track record closely tracked the international developed value/growth record until 2023, when AI-related plays in the U.S. went on a tear. Such stocks weren’t readily available in non-U.S. markets.

Does that mean you should continue to bet on growth investing or are value stocks about to have their day? Here an analytical framework to think about the value/growth paradigm.
 
The full post can be found here.

Wednesday, March 13, 2024

Waiting for the recycle amidst an elevated tail-risk backdrop

Mid-week market update: Marketwatch recently highlighted analysis from NDR which concluded that sentiment was extended and while it may make sense to be cautious about adding risk, it's too early to turn tactically bearish until readings recycle from an overbought condition.
 

I agree. I've been saying the same thing for several weeks. A correction or pullback is on the horizon, but hasn't arrived yet. While signs of technical deterioration are appearing, a sideways consolidation marked by a rolling correction is very possible.
 
Here are the indicators that I've been watching, some of which have recycled and some have not.

The full post can be found here.

Saturday, February 3, 2024

How Trump's isolationism threatens long-term equity returns

Now that Donald Trump has become the presumptive Republican nominee for President, Wall Street is scrambling to model how a Trump White House may affect capital markets. A recent Bloomberg article summarized the consensus:
  • Bond market: Expect rising yields from upward pressures on term premium.
  • Currencies: Rising yields will put a bid under the USD.
  • Equities: Stocks in limbo as it’s difficult to form a consensus.
I wrote about the effects of a Trump victory about a month ago (see What the Politics of 2024 Tell Us About 2025) and highlighted the geopolitical risk from Trump’s foreign policy. Further analysis leads us to believe that Trump’s foreign policy could unravel the “Stocks for the Long Run” narrative popularized by Jeremy Siegel. This could have profound long-run implications for investors in their investment planning.


Here’s why.
 
The full post can be found here.

Sunday, September 24, 2023

Has the VIX lost its use as a fear gauge?

Preface: Explaining our market timing models 
We maintain several market timing models, each with differing time horizons. The "Ultimate Market Timing Model" is a long-term market timing model based on the research outlined in our post, Building the ultimate market timing model. This model tends to generate only a handful of signals each decade.

The Trend Asset Allocation Model is an asset allocation model that applies trend-following principles based on the inputs of global stock and commodity prices. This model has a shorter time horizon and tends to turn over about 4-6 times a year. The performance and full details of a model portfolio based on the out-of-sample signals of the Trend Model can be found here.
 
 
My inner trader uses a trading model, which is a blend of price momentum (is the Trend Model becoming more bullish, or bearish?) and overbought/oversold extremes (don't buy if the trend is overbought, and vice versa). Subscribers receive real-time alerts of model changes, and a hypothetical trading record of the email alerts is updated weekly here. The hypothetical trading record of the trading model of the real-time alerts that began in March 2016 is shown below.


The latest signals of each model are as follows:

  • Ultimate market timing model: Buy equities (Last changed from “sell” on 28-Jul-2023)*
  • Trend Model signal: Bullish (Last changed from “neutral” on 28-Jul-2023)*
  • Trading model: Neutral (Last changed from “bearish” on 03-Aug-2023)*
* The performance chart and model readings have been delayed by a week out of respect to our paying subscribers.

Update schedule: I generally update model readings on my site on weekends. I am also on X/Twitter at @humblestudent. Subscribers receive real-time alerts of trading model changes, and a hypothetical trading record of those email alerts is shown here.

Subscribers can access the latest signal in real time here.
 

VIX as fear gauge

There have been a series of recent articles highlighting the subdued level of the VIX Index and the seasonal tendency for equity volatility to spike this time of year (see this Barron’s article as an example). Other analysts have speculated that the VIX Index is failing as a fear gauge.

I have few opinions on the seasonality of the VIX, though last week has historically been a weak one for S&P 500 returns. However, I beg to differ on the use of the VIX as a fear gauge.
 
That’s because the VIX Index was not designed to be a fear indicator. It was designed to measure the implied volatility of a series of at-the-money options with a 1-month time horizon. While some analysts have seized upon implied volatility for use as a fear gauge, the index was never intended for use that way.
Indeed, the current explosion in 0DTE trading, or options that expire the same day, makes a 1-month implied volatility have less utility as a sentiment indicator. Arguably, VXST, or the 9-day VIX, is more useful to measure short-term sentiment. The accompanying chart shows that VXST was faster to spike in the current instance than VIX. The term structure of the VIX-VXST curve shows an inversion, which is an indication of fear appearing in the market.


The key question for investors is whether fear levels are high enough for a short-term bottom.
 
The full post can be found here.

Sunday, July 16, 2023

The soft landing vs. slowdown debate

Preface: Explaining our market timing models 
We maintain several market timing models, each with differing time horizons. The "Ultimate Market Timing Model" is a long-term market timing model based on the research outlined in our post, Building the ultimate market timing model. This model tends to generate only a handful of signals each decade.

The Trend Asset Allocation Model is an asset allocation model that applies trend-following principles based on the inputs of global stock and commodity prices. This model has a shorter time horizon and tends to turn over about 4-6 times a year. The performance and full details of a model portfolio based on the out-of-sample signals of the Trend Model can be found here.


My inner trader uses a trading model, which is a blend of price momentum (is the Trend Model becoming more bullish, or bearish?) and overbought/oversold extremes (don't buy if the trend is overbought, and vice versa). Subscribers receive real-time alerts of model changes, and a hypothetical trading record of the email alerts is updated weekly here. The hypothetical trading record of the trading model of the real-time alerts that began in March 2016 is shown below.


The latest signals of each model are as follows:
  • Ultimate market timing model: Sell equities (Last changed from “buy” on 26-Mar-2023)*
  • Trend Model signal: Neutral (Last changed from “bullish” on 17-Mar-2023)*
  • Trading model: Neutral (Last changed from “bearish” on 15-Jun-2023)*
* The performance chart and model readings have been delayed by a week out of respect to our paying subscribers.

Update schedule: I generally update model readings on my site on weekends. I am also on Twitter at @humblestudent and on Mastodon at @humblestudent@toot.community. Subscribers receive real-time alerts of trading model changes, and a hypothetical trading record of those email alerts is shown here.

Subscribers can access the latest signal in real time here.
 

A fragile consensus

It’s remarkable how swiftly the consensus narrative can change. Two weeks ago, the 2-year Treasury yield spike above 5% when the ADP Non-farm Employment report came in at a blowout 497K, which was well ahead of expectations of 228K. The news prompted speculation that the Fed would have to tighten more than expected and send the economy into recession.


Last week, the softer-than-expected CPI report abruptly shifted the tone of the consensus to a soft landing and sparked a risk-on rally in risk assets and yields retreated. This matters because the 2-year Treasury yield is a proxy for market expectations of the Fed Funds rate. Past peaks in the 2-year rate have either been coincidental or led peaks in Fed Funds.


The current environment illustrates the fragile nature of the market consensus. If the narrative can flip from bear to bull in a week, it may not take much for it to flip back. The market is at a critical juncture. Team Soft Landing is locked in a cage match with Team Slowdown. Who wins?

The full post can be found here.


Saturday, July 8, 2023

Why our Ultimate Market Timing Model is cautious

How would you like to take greater equity risk while reducing the worst of the downside risk of owning equities? That's my Ultimate Market Timing Model (UMTM) is designed to do.
 
I recently had a discussion with a reader about the details of my UMTM. The UMTM is an extremely low turnover model that flashes signals once every few years and is designed to limit the extremes of the downside tail-risk of owning equities. When extreme downside risk is minimized, investors can afford to take greater equity risk. Instead of, say, a conventional 60% stocks/40% bonds asset mix, an investor could be more aggressive and move to a 70/30 or even 80/20 asset mix and revert to a more defensive posture such as a 40/60 or 30/70 asset mix under risk-off conditions.

In that context, the reader asked why the UMTM flashed a buy signal in February and flipped back to sell in March, even as the S&P 500 rallied to a new recovery high.


As it turns out, the UMTM was whipsawed by a trend-following model, which is an unfortunate feature of trend-following strategies. To explain further, let’s unpack the details of the model, which is based on a blend of trend-following strategies and a macro overlay.
 

The full post can be found here.


Saturday, June 10, 2023

Can AI stocks lead the market to a new bull?


NASDAQ stocks have been on a tear lately, led by AI-related plays. The relative performance of the NASDAQ 100 has begun to depart from macro factors such as the inverse relationship with the 10-year Treasury yield. 


I have had a number of discussions with investors and the question keeps coming up. Can the AI frenzy, which appears to be in its early stages, carry the stock market to a new bull?

The full post can be found here.


Sunday, May 7, 2023

What market structure tells us about where we are in the cycle

Preface: Explaining our market timing models 
We maintain several market timing models, each with differing time horizons. The "Ultimate Market Timing Model" is a long-term market timing model based on the research outlined in our post, Building the ultimate market timing model. This model tends to generate only a handful of signals each decade.

The Trend Asset Allocation Model is an asset allocation model that applies trend-following principles based on the inputs of global stock and commodity prices. This model has a shorter time horizon and tends to turn over about 4-6 times a year. The performance and full details of a model portfolio based on the out-of-sample signals of the Trend Model can be found here.

 
My inner trader uses a trading model, which is a blend of price momentum (is the Trend Model becoming more bullish, or bearish?) and overbought/oversold extremes (don't buy if the trend is overbought, and vice versa). Subscribers receive real-time alerts of model changes, and a hypothetical trading record of the email alerts is updated weekly here. The hypothetical trading record of the trading 
model of the real-time alerts that began in March 2016 is shown below.


 The latest signals of each model are as follows:
  • Ultimate market timing model: Sell equities*
  • Trend Model signal: Neutral*
  • Trading model: Neutral*
* The performance chart and model readings have been delayed by a week out of respect to our paying subscribers.

Update schedule: I generally update model readings on my site on weekends. I am also on Twitter at @humblestudent and on Mastodon at @humblestudent@toot.community. Subscribers receive real-time alerts of trading model changes, and a hypothetical trading record of those email alerts is shown here.

Subscribers can access the latest signal in real time here.
 
 
Sell in May?
It’s that time of the year again. As April turns into May, market prognosticators everywhere ponder the wisdom of the “sell in May and go away” adage. In reality, history shows that the six months that begin in May only experienced subpar returns and it isn’t actually bearish. In fact, the May to October period has shown relatively strong returns since 2009.


Rather than obsess over the implications of May seasonality, a more practical focus is the analysis of market structure and what it’s telling us about where we are in the cycle.
 

The full post can be found here.


Monday, February 27, 2023

Is this the next FANG-style market darling?

I don't comment about individual stocks very often, but I came upon this chart. It has been steadily rising for the last few years and it has been quietly beating its sector peers. Could this be the next Amazon or Apple?

The full post can be found here.


Saturday, February 11, 2023

Why you should fade the NASDAQ surge

The recent market rally has been led by a resurgence in large-cap NASDAQ stocks. This leadership has become overly extended, as evidenced by the rising divergence between their relative performance and the 10-year Treasury yield. A detailed factor and sector performance analysis reveals an underlying trend in favor of cyclical exposure.


The full post can be found here.


Sunday, January 1, 2023

A 2022 report card

Preface: Explaining our market timing models 
We maintain several market timing models, each with differing time horizons. The "Ultimate Market Timing Model" is a long-term market timing model based on the research outlined in our post, Building the ultimate market timing model. This model tends to generate only a handful of signals each decade.

The Trend Asset Allocation Model is an asset allocation model that applies trend-following principles based on the inputs of global stock and commodity prices. This model has a shorter time horizon and tends to turn over about 4-6 times a year. The performance and full details of a model portfolio based on the out-of-sample signals of the Trend Model can be found here.


My inner trader uses a trading model, which is a blend of price momentum (is the Trend Model becoming more bullish, or bearish?) and overbought/oversold extremes (don't buy if the trend is overbought, and vice versa). Subscribers receive real-time alerts of model changes, and a hypothetical trading record of the email alerts is updated weekly here. The hypothetical trading record of the trading model of the real-time alerts that began in March 2016 is shown below.


The latest signals of each model are as follows:
  • Ultimate market timing model: Sell equities*
  • Trend Model signal: Neutral*
  • Trading model: Neutral*
* The performance chart and model readings have been delayed by a week out of respect to our paying subscribers.

Update schedule: I generally update model readings on my site on weekends. I am also on Twitter at @humblestudent and on Mastodon at @humblestudent@toot.community. Subscribers receive real-time alerts of trading model changes, and a hypothetical trading record of those email alerts is shown here.

Subscribers can access the latest signal in real time here.


Some hope for the future
Every market cycle is different, but all bear markets share some common elements, namely that asset prices fall. 2022 was unusual inasmuch as both stock and safe haven Treasury prices fell together. Nevertheless, there is some hope for the future.

Nine years ago, Jesse Livermore found that forward 10-year equity returns were inversely correlated to household equity positioning. The equity bear market has sent household equity exposure skidding. I would further argue that the normalized position is actually lower. Normally, bond prices rise during equity bear markets, which raise bond allocations and depress stock allocations. When stock and bond prices fell in tandem in 2022, the diversification effect was lost. Household equity allocations should have been lower in a "normal" bear market (see The hidden story of investor capitulation).


As investors bid goodbye to 2022, here is how my models performed during a difficult year.

The full post can be found here.