Saturday, June 22, 2024

Why the November election matters to gold

I am reiterating my bullish outlook on gold. The yellow metal staged an upside breakout from a cup and handle pattern in March. As well, the long-term inflation expectations of ETF (RINF) has been in a steady uptrend. The only question is how far and how fast can gold run?

The future may be bright as gold prices respond to unexpected inflation. The non-partisan Congressional Budget Office (CBO) recently updated its projection of the U.S. fiscal path by raising its FY 2024 estimate of the deficit from $1.5 trillion to $1.9 trillion, driven by emergency spending on foreign assistance to Israel, Ukraine and Taiwan, as well as student loan relief. The long-term picture also deteriorated, the deficit rises to $2.8 trillion by 2034 and debt is expected to grow to 122% of GDP by 2034. 

 
For investors, much of its intermediate-term outlook depends on the outcome of the U.S. November elections and the trajectory of White House policies.

The full post can be found here.

Wednesday, June 19, 2024

What's different this time

Mid-week market update: I am publishing this earlier than usual as the U.S. markets are closed for the Juneteenth holiday.
 
The S&P 500 has gone on another upper Bollinger Band ride, accompanied by a severely overbought reading on the 5-day RSI, which is over 90%. Overbought conditions are often not bearish, but a manifestation of strong price momentum, otherwise known as a "good overbought" signal. That's bullish, right?


Here is what's different this time. The overbought condition occurred along with signs of weak breadth, as evidenced by a series of negative net highs-lows on both the NYSE and the NASDAQ even as the index made new all-time highs.
 
The full post can be found here.

Sunday, June 16, 2024

Tactically cautious but not bearish

Preface: Explaining our market timing models 
We maintain several market timing models, each with differing time horizons. The "Ultimate Market Timing Model" is a long-term market timing model based on the research outlined in our post, Building the ultimate market timing model. This model tends to generate only a handful of signals each decade.

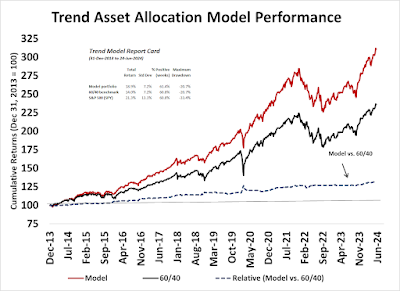
The Trend Asset Allocation Model is an asset allocation model that applies trend-following principles based on the inputs of global stock and commodity prices. This model has a shorter time horizon and tends to turn over about 4-6 times a year. The performance and full details of a model portfolio based on the out-of-sample signals of the Trend Model can be found here.
 

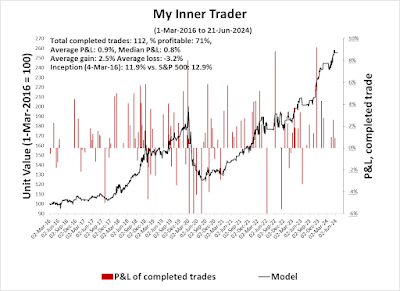
My inner trader uses a trading model, which is a blend of price momentum (is the Trend Model becoming more bullish, or bearish?) and overbought/oversold extremes (don't buy if the trend is overbought, and vice versa). Subscribers receive real-time alerts of model changes, and a hypothetical trading record of the email alerts is updated weekly here. The hypothetical trading record of the trading model of the real-time alerts that began in March 2016 is shown below.
 

The latest signals of each model are as follows:

  • Ultimate market timing model: Buy equities (Last changed from “sell” on 28-Jul-2023)*
  • Trend Model signal: Bullish (Last changed from “neutral” on 28-Jul-2023)*
  • Trading model: Neutral (Last changed from “bullish” on 23-May-2024)*
* The performance chart and model readings have been delayed by a week out of respect to our paying subscribers.

Update schedule: I generally update model readings on my site on weekends. I am also on X/Twitter at @humblestudent. Subscribers receive real-time alerts of trading model changes, and a hypothetical trading record of those email alerts is shown here.

Subscribers can access the latest signal in real time here.
 

Time for cheap protection?

Last week, I suggested that the stock market was susceptible to a setback (see A Time For Tactical Caution). Even though the pullback never appeared, I reiterate my cautious view, though I am not outright bearish.

In light of the market’s vulnerable position, it may be time to exploit the low VIX and buy some cheap downside protection in the form of protective put options. The S&P 500 achieved a fresh all-time high while exhibiting a negative 5-week RSI divergence. As well, the VVIX/VIX ratio is showing a negative divergence. Such episodes have tended to resolve bearishly in the past. As well, the VIX Index is low and testing its lower boundary at 12, indicating low option premium and cheap cost of downside protection.

 
The full post can be found here.

Saturday, June 15, 2024

The market gods present patient investors with three gifts

Remember that equity investors tend to enjoy strong returns in the absence of recession, which dents returns, or war and revolution, which can result in a permanent loss of capital. With those caveats in mind, the market gods are presenting patient investors with three gifts from the three economic blocs in the world: the U.S., Europe, and China.


 The full post can be found here.

Wednesday, June 12, 2024

The market is fighting the Fed, should you?

Mid-week market update: The option market was pricing in a daily equity market swing of 1.6% ahead of today's events, namely the May CPI report and the FOMC decision. Even though the S&P 500 gained strongly today, the move could be said to be disappointing in volatility terms.
 
The bullish tone was set this morning by the softer than expected CPI report. Stocks gained but didn't react much to the FOMC decision, despite the hawkish tone of the Summary of Economic Projections. Bond prices held above a key resistance level, and the USD weakened, indicating a risk-on tone.
 
 
The market is fighting the Fed, should you?
 
The full post can be found here.

Sunday, June 9, 2024

A time for tactical caution

Preface: Explaining our market timing models 
We maintain several market timing models, each with differing time horizons. The "Ultimate Market Timing Model" is a long-term market timing model based on the research outlined in our post, Building the ultimate market timing model. This model tends to generate only a handful of signals each decade.

The Trend Asset Allocation Model is an asset allocation model that applies trend-following principles based on the inputs of global stock and commodity prices. This model has a shorter time horizon and tends to turn over about 4-6 times a year. The performance and full details of a model portfolio based on the out-of-sample signals of the Trend Model can be found here.
 

My inner trader uses a trading model, which is a blend of price momentum (is the Trend Model becoming more bullish, or bearish?) and overbought/oversold extremes (don't buy if the trend is overbought, and vice versa). Subscribers receive real-time alerts of model changes, and a hypothetical trading record of the email alerts is updated weekly here. The hypothetical trading record of the trading model of the real-time alerts that began in March 2016 is shown below.


The latest signals of each model are as follows:

  • Ultimate market timing model: Buy equities (Last changed from “sell” on 28-Jul-2023)*
  • Trend Model signal: Bullish (Last changed from “neutral” on 28-Jul-2023)*
  • Trading model: Neutral (Last changed from “bullish” on 23-May-2024)*
* The performance chart and model readings have been delayed by a week out of respect to our paying subscribers.

Update schedule: I generally update model readings on my site on weekends. I am also on X/Twitter at @humblestudent. Subscribers receive real-time alerts of trading model changes, and a hypothetical trading record of those email alerts is shown here.

Subscribers can access the latest signal in real time here.
 

The bull isn’t done

Make no mistake, I am intermediate-term bullish on U.S. equities. The monthly MACD buy signal remains in force and there are no signs of any negative divergence that signals a major market top.


Beneath the hood, however, disturbing signs of that not all is well in the short run. Here are bull and bear cases.

The full post can be found here.

Saturday, June 8, 2024

Is good news good news, or bad news?

Is good economic news good news for equities or bad news? We know how to interpret macro news for the bond market. The Citi Economic Surprise Index (ESI), which measures whether top-down economic releases are beating or missing expectations, has been a bit weak. Historically, a weak ESI has meant lower bond yields.


What does it mean for equities? Investors saw a string of weaker-than-expected macro prints last week, starting with an anemic ISM PMI on Monday, followed by a miss on job openings in JOLTS Tuesday and another miss on ADP employment Wednesday. In each of those cases, bond prices rallied and equities initially weakened, followed by price recoveries later in the day.

I interpret events from the perspective of three trading desks: bonds, commodities and equities.

The full post can be found here.

Wednesday, June 5, 2024

A well-telegraphed market advance

Mid-week market update: The S&P 500 has risen to a new all-time high, and this move was well-telegraphed. I wrote on the weekend and characterized conditions "half-hearted buy signals that indicate low downside risk".

The S&P 500 subsequently staged an upside breakout from a bull flag to a fresh all-time high.


The full post can be found here.

Sunday, June 2, 2024

The market's dance of thrusts and dips

Preface: Explaining our market timing models 
We maintain several market timing models, each with differing time horizons. The "Ultimate Market Timing Model" is a long-term market timing model based on the research outlined in our post, Building the ultimate market timing model. This model tends to generate only a handful of signals each decade.

The Trend Asset Allocation Model is an asset allocation model that applies trend-following principles based on the inputs of global stock and commodity prices. This model has a shorter time horizon and tends to turn over about 4-6 times a year. The performance and full details of a model portfolio based on the out-of-sample signals of the Trend Model can be found here.
 

My inner trader uses a trading model, which is a blend of price momentum (is the Trend Model becoming more bullish, or bearish?) and overbought/oversold extremes (don't buy if the trend is overbought, and vice versa). Subscribers receive real-time alerts of model changes, and a hypothetical trading record of the email alerts is updated weekly here. The hypothetical trading record of the trading model of the real-time alerts that began in March 2016 is shown below.

The latest signals of each model are as follows:

  • Ultimate market timing model: Buy equities (Last changed from “sell” on 28-Jul-2023)*
  • Trend Model signal: Bullish (Last changed from “neutral” on 28-Jul-2023)*
  • Trading model: Neutral (Last changed from “bullish” on 23-May-2024)*
* The performance chart and model readings have been delayed by a week out of respect to our paying subscribers.

Update schedule: I generally update model readings on my site on weekends. I am also on X/Twitter at @humblestudent. Subscribers receive real-time alerts of trading model changes, and a hypothetical trading record of those email alerts is shown here.

Subscribers can access the latest signal in real time here.
 

A failed breadth thrust?

Is the Triple 70 breadth thrust that triggered on May 6 in trouble? As a reminder, a Triple 70 breadth thrust occurs when the percentage of NYSE advances exceed 70% for three consecutive days, which is a bullish momentum signal. If history is any guide, Rob Hanna’s study of such events has seen strong bullish momentum follow through.


On the other hand, the short-term warning signs have been appearing everywhere. Even as the S&P 500 advanced to new all-time highs, the 5-week RSI flashed a negative divergence, and so did the VVIX/VIX ratio.


Is this evidence of a failed breadth thrust? How should investors react to the simultaneous appearance of bullish price momentum signals like a breadth thrust and the risk of dips from negative technical divergences?

The full post can be found here.
Saturday, June 1, 2024

Transitory disinflation in 2025?

The closely watched April PCE moderated as expected. Headline PCE came in 0.3%, in line with expectations, while core PCE was 0.2% (blue bars), which was softer than expectations. Supercore PCE, or services ex-energy and housing, also decelerated (red bars). This latest print represents useful progress, but won’t significantly move the needle on Fed policy.


The worrisome development is the global trend of transitory disinflation. The Citi Inflation Surprise Index, which measures whether incoming inflation data is beating or missing expectations, is bottoming in most countries and rising again. If this continues, any expectations of ongoing rate cuts are likely to be pulled back.


Now that 2024 is nearly half over, it’s time to peer into 2025 to see the upside and downside factors that are expected to affect inflation and the Fed’s interest rate trajectory. The three main factors to consider are changes in immigration policy and how they affect employment; the evolution in productivity; and the possible political effects of the election on inflation.
 

The full post can be found here.