Wednesday, December 13, 2023
Get ready for the year-end rally
Here is a framework for thinking about the Fed’s monetary policy.
The full post can be found here.
Sunday, December 10, 2023
The animal spirits are still alive
The Trend Asset Allocation Model is an asset allocation model that applies trend-following principles based on the inputs of global stock and commodity prices. This model has a shorter time horizon and tends to turn over about 4-6 times a year. The performance and full details of a model portfolio based on the out-of-sample signals of the Trend Model can be found here.
The latest signals of each model are as follows:
- Ultimate market timing model: Buy equities (Last changed from “sell” on 28-Jul-2023)*
- Trend Model signal: Bullish (Last changed from “neutral” on 28-Jul-2023)*
- Trading model: Bullish (Last changed from “neutral” on 20-Nov-2023)*
Update schedule: I generally update model readings on my site on weekends. I am also on X/Twitter at @humblestudent. Subscribers receive real-time alerts of trading model changes, and a hypothetical trading record of those email alerts is shown here.
Subscribers can access the latest signal in real time here.
A healthy consolidation
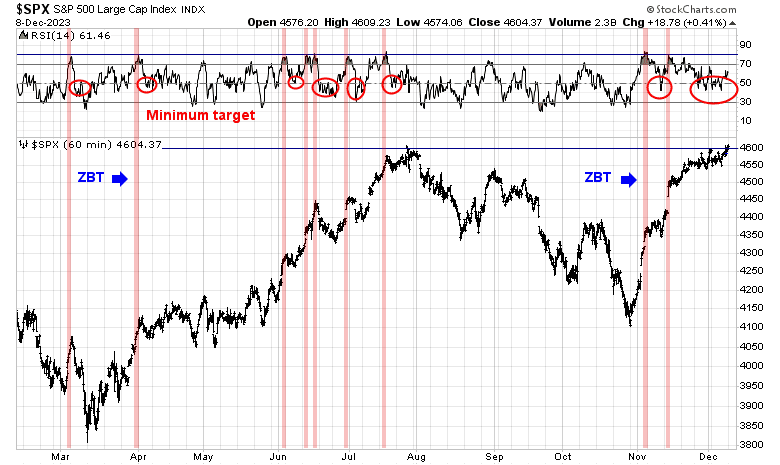
The S&P 500 staged a late Friday breakout above 4600 out of a narrow consolidation range. The accompanying hourly chart shows that whenever the 14-hour RSI reaches an overbought extreme of 90 or more, it has retreated to a minimum level of 50, which it has in the latest episode. In light of the powerful momentum exhibited by the Zweig Breadth Thrust buy signal in early November, the market has met the conditions for another bull run in the near future.I continue to believe that stocks are poised for a rally into year-end. My analysis of market internals shows that the market’s animal spirits are still alive.
Saturday, December 9, 2023
What happens after the momentum chase?
Wednesday, December 6, 2023
More sideways consolidation before the Big Event
Mid-week market update: Another day, another sideways consolidation price action in the S&P 500, which is typical of seasonal pattern in the first half of December.
Beneath the surface, I am seeing numerous signs that the market is still poised for the year-end rally.
Sunday, December 3, 2023
Sell signal set-ups are appearing, but don't panic
The Trend Asset Allocation Model is an asset allocation model that applies trend-following principles based on the inputs of global stock and commodity prices. This model has a shorter time horizon and tends to turn over about 4-6 times a year. The performance and full details of a model portfolio based on the out-of-sample signals of the Trend Model can be found here.
The latest signals of each model are as follows:
- Ultimate market timing model: Buy equities (Last changed from “sell” on 28-Jul-2023)*
- Trend Model signal: Bullish (Last changed from “neutral” on 28-Jul-2023)*
- Trading model: Bullish (Last changed from “neutral” on 20-Nov-2023)*
Update schedule: I generally update model readings on my site on weekends. I am also on X/Twitter at @humblestudent. Subscribers receive real-time alerts of trading model changes, and a hypothetical trading record of those email alerts is shown here.
Subscribers can access the latest signal in real time here.
Don’t overstay the party
Two weeks ago, I set out a number of bearish trigger warnings for investors (see How Far Can This Market Run?). Two signals have been triggered.The NYSE McClellan Summation Index saw its weekly stochastic (bottom panel) edge into overbought territory. The NASDAQ McClellan Summation Index, which is not pictured, also reached a similar reading.
Don’t panic. These readings are only bearish set-ups and not immediate take-profit signals. Current conditions are consistent with a rally into year-end and possibly early January, but it is a warning not to overstay the party.
Saturday, December 2, 2023
The market meaning of a gold breakout
Wednesday, November 29, 2023
A correction in price, or time?
Mid-week market update: I recently pointed out that the S&P 500 was becoming overbought and poised for a consolidation or pullback. The 14-day RSI had reached the overbought zone and the percentage of S&P 500 stocks above their 20 dma exceeded 90%. The market tried to rally today, but failed. Is this the correction?
Corrections can occur in price or time. The market could pull back (price) or the market could consolidate sideways (time).
The full post can be found here.
Sunday, November 26, 2023
7 reasons to embrace the melt-up into year-end
The Trend Asset Allocation Model is an asset allocation model that applies trend-following principles based on the inputs of global stock and commodity prices. This model has a shorter time horizon and tends to turn over about 4-6 times a year. The performance and full details of a model portfolio based on the out-of-sample signals of the Trend Model can be found here.
The latest signals of each model are as follows:
- Ultimate market timing model: Buy equities (Last changed from “sell” on 28-Jul-2023)*
- Trend Model signal: Bullish (Last changed from “neutral” on 28-Jul-2023)*
- Trading model: Neutral (Last changed from “neutral” on 14-Nov-2023)*
Update schedule: I generally update model readings on my site on weekends. I am also on X/Twitter at @humblestudent. Subscribers receive real-time alerts of trading model changes, and a hypothetical trading record of those email alerts is shown here.
Subscribers can access the latest signal in real time here.
A cup and handle breakout
Saturday, November 25, 2023
How a global leadership review reveals opportunities
Much has happened since my last global market review. Investors saw a bond market tantrum, followed by a down yield reversal and a risk-on rally in asset prices. Willie Delwiche at Hi Mount Research put the equity price surge into perspective when he observed that 94% of global markets in the MSCI All-Country World Index (ACWI) had exceeded their 50 dma. This is a sign of strong global breadth that shouldn’t be ignored.
Drilling down, let’s take a quick trip around the world to spot investing opportunities.
The full post can be found here.
Wednesday, November 22, 2023
Three white soldiers lead the way
Mid-week market update: The “three white soldiers” candlestick pattern is made up of three long white candles, and typically occurs after a falling price trend. It is indicative of strong price momentum after a price reversal. This pattern is evident in the weekly S&P 500 chart shown below. Usually, the market consolidates sideways after the “three white soldiers”, but the market has continued to advance on the back of the strength of the recent breadth thrust signals. As well, the index faces initial resistance at about 4600, which should be overwhelmed in light of a combination of strong price momentum and the lack of volume resistance (see side bars).
This is a timely gift to all investors and traders who observe U.S. Thanksgiving.
The full post can be found here.
Sunday, November 19, 2023
How far can this rally run?
The Trend Asset Allocation Model is an asset allocation model that applies trend-following principles based on the inputs of global stock and commodity prices. This model has a shorter time horizon and tends to turn over about 4-6 times a year. The performance and full details of a model portfolio based on the out-of-sample signals of the Trend Model can be found here.
The latest signals of each model are as follows:
- Ultimate market timing model: Buy equities (Last changed from “sell” on 28-Jul-2023)*
- Trend Model signal: Bullish (Last changed from “neutral” on 28-Jul-2023)*
- Trading model: Bullish (Last changed from “neutral” on 27-Oct-2023)*
Update schedule: I generally update model readings on my site on weekends. I am also on X/Twitter at @humblestudent. Subscribers receive real-time alerts of trading model changes, and a hypothetical trading record of those email alerts is shown here.
Subscribers can access the latest signal in real time here.
An extraordinary price surge
The S&P 500 rally off the bottom in late October has been extraordinary. It resolved itself in a Zweig Breadth Thrust buy signal and four price gaps that likely won’t be filled. Classical chartists would characterize them as breakaway gaps indicating strong price momentum.
How far can this rally run?
The full post can be found here.
Saturday, November 18, 2023
Assessing economic risk through the Biden-Xi meeting lens
The markets took a risk-on tone in the wake of a softer-than-expected CPI report, followed by a tame PPI report and strong retail sales print. Even before these reports, Mohamed El-Erian issued a warning about the goldilocks scenario of lower oil prices and falling bond yields.
Is market psychology in a “bad news is good news” mode that’s discounting weakness ahead? To answer that question, one useful way of seeing the world is through the lens of last week’s meeting between Joe Biden and Xi Jinping on the sidelines of the APEC Summit in San Francisco. The U.S. and China met to stabilize their relationship, but each is coming to the table with deep wounds, which are useful in evaluating potential weakness that could affect the global economy. The actual progress made at the meeting was modest, but it’s less important inasmuch as what it revealed about the vulnerabilities of each economy to the growth risks highlighted by El-Erian.
The full post can be found here.
Wednesday, November 15, 2023
Too many people are fighting the rally
Mid-week market update: Until yesterday’s market melt-up, it seemed that individual investors were fighting the rally, which is a contrarian bullish sign. I noticed it on the weekend when the level of engagement on my bearish tweets were an order of magnitude higher than my bullish ones. In addition, the New York Fed’s recent consumer expectations survey was having trouble finding equity bulls.
The full post can be found here.
Sunday, November 12, 2023
Will narrow leadership unravel the ZBT buy signal?
The Trend Asset Allocation Model is an asset allocation model that applies trend-following principles based on the inputs of global stock and commodity prices. This model has a shorter time horizon and tends to turn over about 4-6 times a year. The performance and full details of a model portfolio based on the out-of-sample signals of the Trend Model can be found here.
The latest signals of each model are as follows:
- Ultimate market timing model: Buy equities (Last changed from “sell” on 28-Jul-2023)*
- Trend Model signal: Bullish (Last changed from “neutral” on 28-Jul-2023)*
- Trading model: Bullish (Last changed from “neutral” on 27-Oct-2023)*
Update schedule: I generally update model readings on my site on weekends. I am also on X/Twitter at @humblestudent. Subscribers receive real-time alerts of trading model changes, and a hypothetical trading record of those email alerts is shown here.
Subscribers can access the latest signal in real time here.
A narrow advance
The recent Zweig Breadth Thrust signal should have been unconditionally bullish. This is a rare signal that has only been generated eight times since Marty Zweig first wrote about it in 1986. The stock market has been up 6 and 12 months later after every single signal. In some cases, stocks continue to rise like a runaway freight train. In three instances, which include the buy signal generated in late March, the market rose but pulled back several months later to re-test the buy signal level.What category will the latest buy signal fall in?
Saturday, November 11, 2023
Five bullish reversals you may have missed
In addition to this obvious bullish price reversal on the weekly chart, here are five other risk reversal factors that you may have missed.
Wednesday, November 8, 2023
Time for a ZBT price reset?
In almost instance, the market cools off for a few days after the ZBT buy signal. Is it time for a temporary ZBT price reset?
The full post can be found here.
Monday, November 6, 2023
Zweig Breadth Thrust: From caution to YOLO
As a reminder, the ZBT is a price momentum signal. It is triggered when breadth indicators rise from oversold to overbought within 10 trading days. Breadth thrust price momentum signals usually resolve in a surge. The market triggered a ZBT buy signal on March 31, 2023 and my reaction was cautious (see Why I am fading the latest breadth thrust). This time, the tone is far more bullish and I am inclined to adopt a YOLO (You Only Live Once) to portfolio positioning.
I wrote in early April that I was cautious, but not outright bearish. I was mostly correct. Instead of a price surge, the S&P 500 traded sideways for two months after the buy signal, rallied and topped out in late July, and pulled back to the approximate level of the buy signal in late October.
Saturday, November 4, 2023
Nine reason why this rally has legs
The Trend Asset Allocation Model is an asset allocation model that applies trend-following principles based on the inputs of global stock and commodity prices. This model has a shorter time horizon and tends to turn over about 4-6 times a year. The performance and full details of a model portfolio based on the out-of-sample signals of the Trend Model can be found here.
The latest signals of each model are as follows:
- Ultimate market timing model: Buy equities (Last changed from “sell” on 28-Jul-2023)*
- Trend Model signal: Bullish (Last changed from “neutral” on 28-Jul-2023)*
- Trading model: Bullish (Last changed from “neutral” on 27-Oct-2023)*
Update schedule: I generally update model readings on my site on weekends. I am also on X/Twitter at @humblestudent. Subscribers receive real-time alerts of trading model changes, and a hypothetical trading record of those email alerts is shown here.
Subscribers can access the latest signal in real time here.
This rally has legs
How the U.S. could be in both a bull and bear market
Wednesday, November 1, 2023
The anticipation can be worse than the pain
Mid-week market update: I told you so. As I recently pointed out, psychology had become too stressed to the downside, which opened the door to a relief rally. The NAAIM Exposure Index, which measures the sentiment of RIAs who manage individual investors’ funds, fell sharply last week and below its 26-week Bollinger Band. Historically, theses signals have resolved in a tactical rally in stock prices.
Sometimes the anticipation can be worse than the event itself. Coming into the weekend, the market was focused on three sources of possible stress: geopolitical tensions from the Israel-Hamas war, excess supply putting upward pressure on Treasury yields, and Fed policy. Here’s how those fears have resolved themselves.


