I have spent a fair amount of time pondering that question (see my recent post Sell in May?). My conclusion is where you come down on the question of whether this is the start of a new secular bull market where stocks move to new highs or whether we are just seeing the top of a range-bound secular bear.
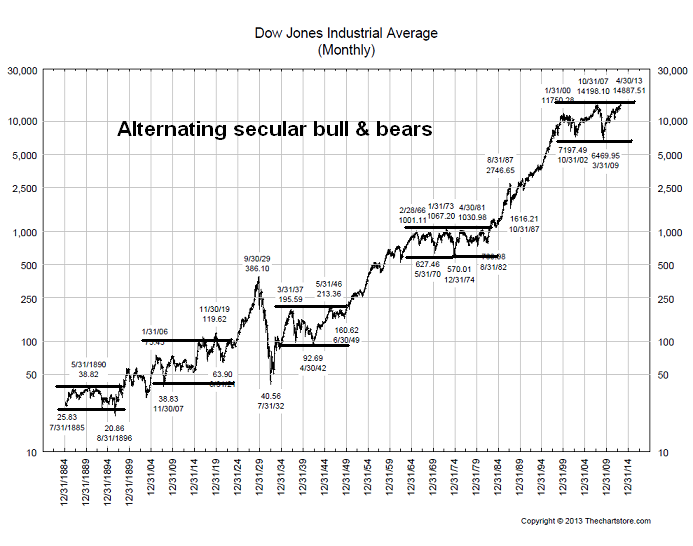
To explain, consider this long-term chart of the Dow, where the market has seen alternating secular bulls, where stocks rally to multi-decade highs, and secular bears, where the market remains range-bound for years.
My main belief is that we remain in a secular bear for two main reasons: demographics and valuation. I have written about the demographics issue before (see Demographics and stock returns and A stock market bottom at the end of this decade). For stocks to go up, there has to be more buyers than sellers at a given price. The propensity of Baby Boomers, as they move into retirement, is to take money out of stocks. In order for equities to rise, those negative fund flows have to be met by the retirement savings of their children, the Echo Boomers. Two research groups looked into this topic (see papers here and here). Their conclusion - the inflection point at which the fund flows of Echo Boomers moving into stocks start to overwhelm the Baby Boomers taking money out is somewhere between 2017 and 2021.
In addition, long-term valuations don't appear compelling. I have long considered the market cap to GDP ratio as a proxy for an aggregate Price to Sales ratio for the stock market. The chart below from Bianco Research via Barry Ritholz, shows this metric, whose history goes all they way back to 1925, to be well above its long-term average. In addition, note that instances of falling market cap to GDP ratios correspond with secular range-bound bear markets.

Another reason for the long-term secular bear case comes from John Hussman, an investor for whom I have much respect. His latest 10-year return projections for the SPX is about 3.5% (see My answer to John Hussman). Even with bonds yields at microscope levels, a 3.5% return expectation for US equities is nothing to get overly excited about.
The bull case (and it's always important for investors to consider opinions contrary to his own) is represented by Ray Dalio's "beautiful deleveraging" concept (see my post Falling tail risk = new secular bull?). Dalio believes that the United States has undergone a "beautiful deleveraging" process in the wake of the financial crisis of 2008. A "beautiful deleveraging" involves just the right amount of austerity, debt restructuring and money printing. He went on to observe that, by contrast, Europe has gotten it all wrong and that region is likely to be mired in a Lost Decade.
If Dalio is correct, then the rotation that we are observing from defensive to cyclical sectors is another sign of a new upleg in equity prices and therefore the start of a new secular bull.
The intermediate term outlook
While my analysis of the secular bull vs. bear is based on a long-term multi-year investment time frame, what about the intermediate term time frame for the next several weeks to months?
Here's what's bothering me about the emergence of the cyclical leadership. First of all, commodities look positively sick. Here is a chart of the industrial metals. Does this look like the basis for a cyclical rebound?

In addition, the Citigroup Surprise Index has been turning down, both in the US and globally. Despite Friday's NFP upside surprise, the internals of the employment report appeared to be negative and it was before long that there were a cacophony of voices pointing out the weaknesses in the report (for examples, see here, here and here).

I agree with the blogger MicroFundy when he pointed out the divergences between the macro picture and US stocks:
I think we are getting real close to a major inflection point. It seems like every macro-economic data point I come across is saying one thing – the same thing. There is an extremely high correlation between all the varying data points and indicators. Data like the 10yr treasury yields, PMI manufacturing, durable goods orders, copper prices, international (ex Japan) stock markets, inflation expectation, margin levels etc – are all saying that the (global &) US economy is slowing, and that the risks of deflation/contraction/recession are growing.His conclusion is "something's gotta give":
The only thing diverging from this pattern in all of the charts below is the US equity markets.
There are two extreme scenarios that can “correct” the above divergence, although I believe it will be a combination of the two.With Europe mired in recession, commodity markets signaling that Chinese growth is stalling, the US is once again holding up the world. If the American economy is holding up the world, then why is US equity performance faltering against global equities? The chart below shows the relative performance of SPY against ACWI (All-Country World Index). If we are indeed seeing a launch of a new secular bull, shouldn't the US, which has been the beneficiary of the "beautiful deleveraging", be leading?
1 – We could see a correction of 15-20% that would put the US equity markets back in line with most of the charts above. It would then be priced closer to fair value based on most of the recent economic data.If these scenarios were mutually exclusive, I would bet the farm on #1. A realistic base case assumption though, is a combination of the two. I am anticipating a good 10% correction combined with a small pickup in some of the macro data.
2 – The economic data can pop back up. Whether it was because of the payroll tax increase, sequestration, or some other seasonal event(s)… maybe this is/was just a blip on the radar these last few months, and the economic data will “catch up” to the US equity markets.
Either way, something’s gotta give. The level of divergence here is bordering historical, and the relative and absolute over-valuation of some of these high-yield names are frightening.

A bearish bias
While I have outlined my bias for the bear case, investing is about probabilities and I honestly don't know how this market is going to resolve itself. While the bear case is compelling, Street earnings and revenue estimates continue to get revised upwards (as per Ed Yardeni).

Until we see some sort of negative macro surprise that cause estimates to get revised downwards, the stock market is likely to grind higher. As I wrote last week, there is no catalyst yet for a bearish impulse for stocks yet.
Cam Hui is a portfolio manager at Qwest Investment Fund Management Ltd. ("Qwest"). This article is prepared by Mr. Hui as an outside business activity. As such, Qwest does not review or approve materials presented herein. The opinions and any recommendations expressed in this blog are those of the author and do not reflect the opinions or recommendations of Qwest.
None of the information or opinions expressed in this blog constitutes a solicitation for the purchase or sale of any security or other instrument. Nothing in this article constitutes investment advice and any recommendations that may be contained herein have not been based upon a consideration of the investment objectives, financial situation or particular needs of any specific recipient. Any purchase or sale activity in any securities or other instrument should be based upon your own analysis and conclusions. Past performance is not indicative of future results. Either Qwest or Mr. Hui may hold or control long or short positions in the securities or instruments mentioned.
6 comments:
Cam,
A couple of weeks ago, I was wondering about your chart that shows Secular bulls and bears, and what it is showing currently? Thanks for the update. Great posts as always.
Thank you for this very informative post, I am fascinated how a stock can be bullish and bearish regardless of what outside factor could do. Now I can enjoy binary options and be able to relate your topic with anyoption review ouranyoptionreview.com that I have read last time, all this for the improvement of my trade with binary options.
Sorry to say FerraWilson, but I think Binary Options are exactly the same thing as going to play Roulette in a Casino. You sit at a table, and simply put your money on RED or BLACK. The odds are 50-50... Binary Options is err... binary! Either red or black.
It's pure gambling, unless you want to show me otherwise!
but with out the house advantage of 5.6 percent.
This is cool!
Excellent analysis. At the very least we are reminded that while markets go up in the long term, they NEVER do so in a straight line. In fact, contrary to the prevailing mantra "buy now" and the corollary "it's time in the market; not timing the market," the facts DO tend to suggest that we are currently at the top of a cyclical bull and in the middle of a secular bear.
Post a Comment