Trend Model signal: Risk-on
Trading model: Bullish
The Trend Model is an asset allocation model which applies trend following principles based on the inputs of global stock and commodity price. In essence, it seeks to answer the question, "Is the trend in the global economy expansion (bullish) or contraction (bearish)?"
My inner trader uses the trading model component of the Trend Model seeks to answer the question, "Is the trend getting better (bullish) or worse (bearish)?" The history of actual (not backtested) signals of the trading model are shown by the arrows in the chart below. In addition, I have a trading account which uses the signals of the Trend Model. The last report card of that account can be found here.

The uptrend continues
US equity markets paused last week and continued to consolidate their gains. I interpret the fact that the sideways consolidation occurred above the upside breakout level as a bullish signal. In addition, the Trend Model dashboard of global equity and commodity markets continues to point to a risk-on environment.
Consider these charts of US, UK and eurozone equities, which have all staged upside breakouts. All markets are above their breakout levels. Eurozone equities, as measured by the Euro STOXX 50, have strengthened to further highs.

Over in China, Beijing has announced a series of stimulative measures. On Saturday, the PBoC announced another round of interest rate cuts. In addition, Bloomberg reported that other steps are being prepared to revive growth:

Key commodity prices, such as the CRB Index and industrial metals, have begun to bottom:

From a global inter-market analytical perspective, these developments are bullish.
US equity fundamental improving
Further, I had expressed concerns in the past that in order for stock prices to advance, either the E in the PE ratio has to grow or the PE ratio has to expand. The latest analysis from Ed Yardeni and John Butters of Factset indicate that Street consensus forward 12-month EPS, after a prolong period of decline, have bottomed and stared to improve again.
The top panel of the chart below, which comes from Ed Yardeni, shows that forward EPS for the SPX rose from 122.77 to 122.80 for the week ending February 19. The bottom chart, which comes from Factset, also shows that forward EPS have stopped their decline (annotation in purple are mine).

The evolution of forward EPS is an analysis of the US equity market from a bottom-up perspective. There are also signs of stabilization and upturn from a top-down perspective as well. The Citigroup US Economic Surprise Index, which measures whether economic releases are beating or missing expectations, appear to be making a bottom just as I suggested last week (see The 2011 pattern continues).
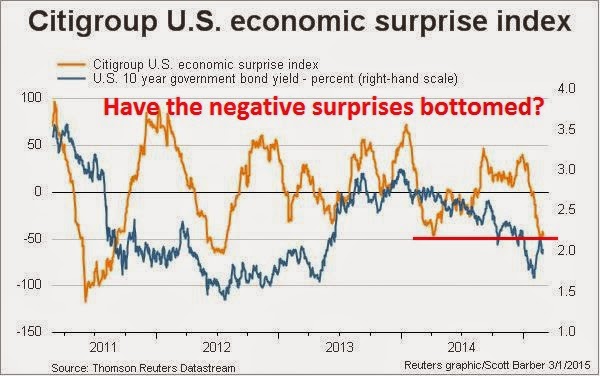
Similarly, New Deal democrat, who monitors high frequency economic releases, wrote this week that while coincidental indicators were weak, short and long leading indicators are generally positive. Presumably coincidental indicators accounted for much of the weakness seen in the Citigroup US Economic Surprise Index.
There are also some positive developments on the PE front. The inverse of the PE ratio is the EP ratio, which is a function of interest rates. Reuters reported last week that Bill Dudley favors a policy of erring on the side of caution when it comes to the timing of the first interest rate hike (emphasis added):
One of the key metrics that I will be watching is the Employment Report, which is due out on Friday. Instead of just watching the headline Non-Farm Payroll figure, I will be paying close attention to Average Hourly Earnings, just as I did last month (see The ONE NUMBER to watch in Friday's NFP report). No doubt, the Fed will also be closely monitoring this data point for signs of wage pressures. Average Hourly Earnings came in at 0.5% for January, but the consensus expectation is for a rise of 0.2%.

More consolidation ahead?
All these factors indicate that the intermediate term trend is up. Tactically, however, the markets may need a bit more time to consolidate their gains. The chart below of the SPX shows that the 5-day RSI, which is useful for swing trading, has descended from an overbought condition. Such reading often signal a market pullback. However, a glance at the SPX chart in the bottom panel shows that the index remains above its breakout levels and support is nearby at 2090-2100, which is less than 1% below the current level of 2105.

I would therefore anticipate further consolidation and minor weakness in the week ahead. As long as the market does not violate that support zone, the path of least resistance should be upward.
My inner trader is long the market and regards any minor pullback as a buying opportunity, but he has stop losses placed just below the aforementioned support levels. My inner investor is shifting to a more risk-on profile with his portfolio and allocating a greater portion to equities.
Disclosure: Long SPXL, TNA
US equity markets paused last week and continued to consolidate their gains. I interpret the fact that the sideways consolidation occurred above the upside breakout level as a bullish signal. In addition, the Trend Model dashboard of global equity and commodity markets continues to point to a risk-on environment.
Consider these charts of US, UK and eurozone equities, which have all staged upside breakouts. All markets are above their breakout levels. Eurozone equities, as measured by the Euro STOXX 50, have strengthened to further highs.
Over in China, Beijing has announced a series of stimulative measures. On Saturday, the PBoC announced another round of interest rate cuts. In addition, Bloomberg reported that other steps are being prepared to revive growth:
China is preparing measures to counter a housing market slump and will roll them out if the economy needs support, people with knowledge of the matter said.Possibly in anticipation of these measures, the stock markets of China’s major Asian trading partners are in solid uptrends and the Shanghai Composite is in rally mode.
The government could reduce down-payment requirements for second-home purchases, the people said, asking not to be identified as the information isn’t public. Another possible step: removing the sales tax after homeowners hold their property for two years -- down from a five-year minimum now.
Key commodity prices, such as the CRB Index and industrial metals, have begun to bottom:
From a global inter-market analytical perspective, these developments are bullish.
US equity fundamental improving
Further, I had expressed concerns in the past that in order for stock prices to advance, either the E in the PE ratio has to grow or the PE ratio has to expand. The latest analysis from Ed Yardeni and John Butters of Factset indicate that Street consensus forward 12-month EPS, after a prolong period of decline, have bottomed and stared to improve again.
The top panel of the chart below, which comes from Ed Yardeni, shows that forward EPS for the SPX rose from 122.77 to 122.80 for the week ending February 19. The bottom chart, which comes from Factset, also shows that forward EPS have stopped their decline (annotation in purple are mine).
The evolution of forward EPS is an analysis of the US equity market from a bottom-up perspective. There are also signs of stabilization and upturn from a top-down perspective as well. The Citigroup US Economic Surprise Index, which measures whether economic releases are beating or missing expectations, appear to be making a bottom just as I suggested last week (see The 2011 pattern continues).
Similarly, New Deal democrat, who monitors high frequency economic releases, wrote this week that while coincidental indicators were weak, short and long leading indicators are generally positive. Presumably coincidental indicators accounted for much of the weakness seen in the Citigroup US Economic Surprise Index.
There are also some positive developments on the PE front. The inverse of the PE ratio is the EP ratio, which is a function of interest rates. Reuters reported last week that Bill Dudley favors a policy of erring on the side of caution when it comes to the timing of the first interest rate hike (emphasis added):
Raising interest rates too late is safer than acting too early, an influential Federal Reserve official said on Friday, endorsing a high-profile research paper that argues that the U.S. economy, given time, can rebound to normal growth.No doubt a June liftoff is still on the table, but how likely is it when Bill Dudley, who is part of the inner circle triumvirate of Yellen, Fischer and Dudley at the Fed, urges caution?
The paper by four top U.S. economists, presented on Friday to a roomful of powerful central bankers in New York, argues the Fed would be wise to keep rates at rock bottom for longer than planned and then tighten monetary policy more aggressively.
New York Fed President William Dudley, who offered a critique of the paper, cited currently low inflation and warned against being too anxious to tighten monetary policy.
The risks of hiking rates "a bit early are higher than the risks of lifting off a bit late," he told a forum hosted by the University of Chicago's Booth School of Business. "This argues for a more inertial approach to policy."
One of the key metrics that I will be watching is the Employment Report, which is due out on Friday. Instead of just watching the headline Non-Farm Payroll figure, I will be paying close attention to Average Hourly Earnings, just as I did last month (see The ONE NUMBER to watch in Friday's NFP report). No doubt, the Fed will also be closely monitoring this data point for signs of wage pressures. Average Hourly Earnings came in at 0.5% for January, but the consensus expectation is for a rise of 0.2%.
More consolidation ahead?
All these factors indicate that the intermediate term trend is up. Tactically, however, the markets may need a bit more time to consolidate their gains. The chart below of the SPX shows that the 5-day RSI, which is useful for swing trading, has descended from an overbought condition. Such reading often signal a market pullback. However, a glance at the SPX chart in the bottom panel shows that the index remains above its breakout levels and support is nearby at 2090-2100, which is less than 1% below the current level of 2105.
I would therefore anticipate further consolidation and minor weakness in the week ahead. As long as the market does not violate that support zone, the path of least resistance should be upward.
My inner trader is long the market and regards any minor pullback as a buying opportunity, but he has stop losses placed just below the aforementioned support levels. My inner investor is shifting to a more risk-on profile with his portfolio and allocating a greater portion to equities.
Disclosure: Long SPXL, TNA
3 comments:
Do you only trade the bull and bear etf's based on the trend model. Just curious as I have no business playing with them.
I do trade the bull and bear signals. Here is the report card for January:
http://humblestudentofthemarkets.blogspot.com/2015/02/trend-model-jan-2015-report-card-19-in.html
I will post a February report card soon.
Thanks Mr. Hui.
Post a Comment