Saturday, November 30, 2024

2025 outlook: Cautious but not bearish

This is the season when investment strategists publish their outlooks and forecasts for the coming year. This year, the message from investment banks is mostly the same: “We are bullish for stocks in 2025, but there are these policy risks of the new Trump Administration.”

This time last year, I expected returns of about 12% for the S&P 500, which is the average return during an election year. The S&P 500 has more than doubled that figure on a YTD basis. This year, I am expecting equity returns to be flat or in the low single-digits. I am cautious for 2025, but not bearish. 

The main headwind facing stocks is valuation. The S&P 500 is trading at a forward P/E of 22, which is highly elevated by historical standards and ahead of the P/E valuation when Trump first took office in 2017. This doesn’t mean that the stock market can’t rise, but earnings growth will have to be the driver of price growth. Investors shouldn’t expect P/E expansion to boost stock prices. The combination of elevated valuation and no recession on the horizon that craters earnings expectations translates into a roughly flat stock market in 2025.


The full post can be found here.

Wednesday, November 27, 2024

All-time highs are bullish

Mid-week market update: It is said that there is nothing more bullish than a stock or a market making a new high. The S&P 500 made a marginal all-time high yesterday and pulled back today. Yesterday's high was more convincing as both the Dow and equal-weighted S&P 500 decisively broke out to all-time highs. This is an indication of strong breadth and bullish price momentum.


 The bull post can be found here.

Monday, November 25, 2024

An insightful interview with Scott Bessent

RenMac hosted an interview with Scott Bessent, who is Trump's announced nominee for Treasury Secretary, in early 2021. While Bessent did not talk about policy or politics, I found it highly insightful as he described his career path and his investment process.
 

The interview is useful to listen to in its entirety, but here are some highlights.
 
The full post can be found here.

Sunday, November 24, 2024

All hail the bullish reversal

Preface: Explaining our market timing models 
We maintain several market timing models, each with differing time horizons. The "Ultimate Market Timing Model" is a long-term market timing model based on the research outlined in our post, Building the ultimate market timing model. This model tends to generate only a handful of signals each decade.

The Trend Asset Allocation Model is an asset allocation model that applies trend-following principles based on the inputs of global stock and commodity prices. This model has a shorter time horizon and tends to turn over about 4-6 times a year. The performance and full details of a model portfolio based on the out-of-sample signals of the Trend Model can be found here.


My inner trader uses a trading model, which is a blend of price momentum (is the Trend Model becoming more bullish, or bearish?) and overbought/oversold extremes (don't buy if the trend is overbought, and vice versa). Subscribers receive real-time alerts of model changes, and a hypothetical trading record of the email alerts is updated weekly here. The hypothetical trading record of the trading model of the real-time alerts that began in March 2016 is shown below.


The latest signals of each model are as follows:

  • Ultimate market timing model: Buy equities (Last changed from “sell” on 28-Jul-2023)*
  • Trend Model signal: Bullish (Last changed from “neutral” on 11-Oct-2024)*
  • Trading model: Bullish (Last changed from “neutral” on 15-Oct-2024)*
* The performance chart and model readings have been delayed by a week out of respect to our paying subscribers.

Update schedule: I generally update model readings on my site on weekends. I am also on X/Twitter at @humblestudent and on BlueSky at @humblestudent.bsky.social. Subscribers receive real-time alerts of trading model changes, and a hypothetical trading record of those email alerts is shown here.

Subscribers can access the latest signal in real time here.

The bulls seize control

The S&P 500 printed a bullish reversal last week. It began with a decline that was halted at the 20 dma and that’s just above a large price gap, followed by an outside reversal day when it exhibited a bullish engulfing pattern. The bullish reversal was confirmed when the index rose and filled a price gap that was acting as resistance. 

The market action was a test for both bulls and bears. Gap fills, and how quickly they are filled, are a sign of the strength of the underlying trend. The filled upper gap is a signal that the bulls are seizing control of the tape once again.
 
The full post can be found here.

Saturday, November 23, 2024

2025 outlook: Cautious, but not bearish

This is the season when investment strategists publish their outlooks and forecasts for the coming year. This year, the message from investment banks is mostly the same: “We are bullish for stocks in 2025, but there are these policy risks of the new Trump Administration.”

This time last year, I expected returns of about 12% for the S&P 500, which is the average return during an election year. The S&P 500 has more than doubled that figure on a YTD basis. This year, I am expecting equity returns to be flat or in the low single-digits. I am cautious for 2025, but not bearish.
 
The main headwind facing stocks is valuation. The S&P 500 is trading at a forward P/E of 22, which is highly elevated by historical standards and ahead of the P/E valuation when Trump first took office in 2017. This doesn’t mean that the stock market can’t rise, but earnings growth will have to be the driver of price growth. Investors shouldn’t expect P/E expansion to boost stock prices. The combination of elevated valuation and no recession on the horizon that craters earnings expectations translates into a roughly flat stock market in 2025.

The full post can be found here.

Deciphering Trumponomics 2.0

The year is nearly over and the U.S. will see Donald Trump in the White House in 2025. Ryan Detrick’s analysis of historical equity returns found that stocks historically do better in the first two years of a president who was re-elected versus a new president in office. The key question is whether Trump 2.0 represents a re-election or a new term.


I unpack that question by focusing on the economic effects of Trump’s key initiatives, namely the TCJA tax cut extension, tariffs and immigration.

The full post can be found here.


Wednesday, November 20, 2024

Waiting for the gap fill

Mid-week market update: The decline in the S&P 500 seems to have been arrested at its 20 dma (blue line). The next question is which price gap gets filled first. A fill of the upside gap (in grey) would be positive for the bull case, while a fill of the downside gap (in pink) would indicate that the bears have seized control of the tape.
 
 
As investors await the market's verdict, here are some clues on how the future may develop.

The full post can be found here.

Sunday, November 17, 2024

2025 high conviction idea: Gold

Preface: Explaining our market timing models 
We maintain several market timing models, each with differing time horizons. The "Ultimate Market Timing Model" is a long-term market timing model based on the research outlined in our post, Building the ultimate market timing model. This model tends to generate only a handful of signals each decade.

The Trend Asset Allocation Model is an asset allocation model that applies trend-following principles based on the inputs of global stock and commodity prices. This model has a shorter time horizon and tends to turn over about 4-6 times a year. The performance and full details of a model portfolio based on the out-of-sample signals of the Trend Model can be found here.


My inner trader uses a trading model, which is a blend of price momentum (is the Trend Model becoming more bullish, or bearish?) and overbought/oversold extremes (don't buy if the trend is overbought, and vice versa). Subscribers receive real-time alerts of model changes, and a hypothetical trading record of the email alerts is updated weekly here. The hypothetical trading record of the trading model of the real-time alerts that began in March 2016 is shown below.


The latest signals of each model are as follows:

  • Ultimate market timing model: Buy equities (Last changed from “sell” on 28-Jul-2023)*
  • Trend Model signal: Bullish (Last changed from “neutral” on 11-Oct-2024)*
  • Trading model: Bullish (Last changed from “neutral” on 15-Oct-2024)*
* The performance chart and model readings have been delayed by a week out of respect to our paying subscribers.

Update schedule: I generally update model readings on my site on weekends. I am also on X/Twitter at @humblestudent and on BlueSky at @humblestudent.bsky.social. Subscribers receive real-time alerts of trading model changes, and a hypothetical trading record of those email alerts is shown here.

Subscribers can access the latest signal in real time here.

Why gold will beat stocks

Looking ahead to 2025, I am reiterating my bullish call on gold from a long-term viewpoint. The recent pullback represents a buying opportunity in the metal from an asset allocation perspective.

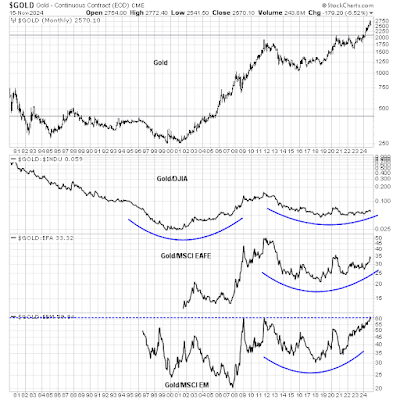
Going back to 1980, we can see several distinct gold bull-bear cycles. Gold topped out at 850 in early 1980 and began a bear market that bottomed in 1985. It traded sideways and made a second bottom in 1999 and broke out to new recovery highs in 2004 and topped in 2011. It subsequently broke out again at 2,100 in early 2024. More importantly, it is tracing out saucer-shaped multi-year bases against different regional equity indices. The gold/Dow ratio is the weakest owing to the strength of U.S. stocks, but it is nevertheless distinctive. The Gold/EAFE ratio (all ratios are in USD) is about to stage a relative breakout, and the gold/EM ratio has marginally broken out of a 12-year base.

These technical patterns argue for a bullish commitment to gold for 2025 and beyond for all investors in all major currencies from an asset allocation perspective.


 The full post can be found here.

Saturday, November 16, 2024

Can Trump Make Equities Great Again?

U.S. equity prices rose strongly in the wake of Trump’s victory. As the accompanying shows, both the S&P 500 and NASDAQ 100 surged on a relative basis, while other regions tanked.


Donald Trump promised to Make America Great Again. While he may have accomplished that task in the short run for U.S. stocks, can he do the same for all equities?
 

The full post can be found here.

Wednesday, November 13, 2024

How far can the post-election rally run?

Mid-week market update: The latest BoA Global Manager Survey shows that institutions have stampeded into U.S. equities in the wake of Trump's victory. The apparent crowded long position is concerning from a contrarian viewpoint.

I had suggested on the weekend that it was time for the S&P 500 to pause and take a breather. The market duly consolidated and trade sideways this week. How far can the post-election rally run?

The full post can be found here.

Sunday, November 10, 2024

How to trade the Trump euphoria rally

Preface: Explaining our market timing models 
We maintain several market timing models, each with differing time horizons. The "Ultimate Market Timing Model" is a long-term market timing model based on the research outlined in our post, Building the ultimate market timing model. This model tends to generate only a handful of signals each decade.

The Trend Asset Allocation Model is an asset allocation model that applies trend-following principles based on the inputs of global stock and commodity prices. This model has a shorter time horizon and tends to turn over about 4-6 times a year. The performance and full details of a model portfolio based on the out-of-sample signals of the Trend Model can be found here.


My inner trader uses a trading model, which is a blend of price momentum (is the Trend Model becoming more bullish, or bearish?) and overbought/oversold extremes (don't buy if the trend is overbought, and vice versa). Subscribers receive real-time alerts of model changes, and a hypothetical trading record of the email alerts is updated weekly here. The hypothetical trading record of the trading model of the real-time alerts that began in March 2016 is shown below.


The latest signals of each model are as follows:

  • Ultimate market timing model: Buy equities (Last changed from “sell” on 28-Jul-2023)*
  • Trend Model signal: Bullish (Last changed from “neutral” on 11-Oct-2024)*
  • Trading model: Bullish (Last changed from “neutral” on 15-Oct-2024)*
* The performance chart and model readings have been delayed by a week out of respect to our paying subscribers.

Update schedule: I generally update model readings on my site on weekends. I am also on X/Twitter at @humblestudent and on BlueSky at @humblestudent.bsky.social. Subscribers receive real-time alerts of trading model changes, and a hypothetical trading record of those email alerts is shown here.

Subscribers can access the latest signal in real time here.

A cloudy crystal ball

As a quantitative equity manager, I employed diversified and uncorrelated groups of factors to pick stocks, including technical analysis, earnings expectations, valuation, growth and growth at a reasonable price. During my tenure, different markets would experience external shocks, such as financial crises (Asian Crisis) and natural disasters (Fukushim). The quantitative factor response playbook would always follow the same script. 

It begins with a price shock as everyone scrambles to assess the market implications. During this period, none of the stock picking factors worked because of the new information that isn’t reflected in the factors. 
 
As the market begins to settle down, technical analysis factors would show alpha. This would be followed by estimate revision. That’s because company analysts don’t revise their earnings estimates until they can quantify the effects of the shock. This would be followed by the fundamental factors, such as value and growth. As an example, I flattened all my positions in an equity market-neutral portfolio in the wake of 9/11 as I knew I would only be trading on noise until there was greater clarity on fundamentals.

While the Trump victory doesn’t qualify as a disaster in the manner of Fukushima or 9/11, it does represent a discontinuous external shock to market expectations whose effects are difficult to quantify. While the direction of policy changes are known, the magnitude of their effects are difficult to estimate without knowing the exact details.

It is in that spirit I would assert the only guidance investors can rely on are market price signals, or technical analysis. That’s why it’s difficult to predict how the markets are likely to behave under the Trump Administration before he takes office.

My crystal ball is cloudy beyond a few weeks, but I can still take a look at the price response to the news.

 
The full post can be found here.

Saturday, November 9, 2024

Europe, alone?

Perhaps it is fitting that this report is being published just before November 11, Remembrance Day, the day commemorating the end of World War I. It was on the 11th hour of the 11th day of the 11th month the guns fell silent. 

Lest we forget the sacrifices of many and the terrible carnage of both World Wars.
 
As a reminder, it was the American-led geopolitical architecture in the wake of World War II, backed by an American nuclear umbrella, which contained the Soviet Union and ensured no major wars erupted after 1945. Now Trump’s America First isolationist policies are dismantling U.S. security guarantees and the possible removal of the nuclear umbrella. How U.S. allies react from the viewpoint of foreign and economic policy will be of enormous consequence for the world for the next generation.
 
A major issue in the current geopolitical environment is the Russo-Ukraine War. As Trump has shown a high degree of antipathy to NATO, Europe is becoming increasingly alone. How the EU reacts to U.S. isolationism and Ukraine will be of utmost importance to the outlook for Europe.


Here are the bull and bear cases.
 
The full post can be found here.

Wednesday, November 6, 2024

How to trade the post-election melt-up

Mid-week market update: I pointed out on the weekend (see A final update on the Trump Trade: Tail-risk assessment) that the term structure of the VIX had inverted, indicating high levels of market anxiety. The market was hedging for a catastrophic outcome that turned out to be nothing. Today's post-election rally is mainly attributable to a positioning unwind of an over-hedged position. "Bloomberg reported that "Wall Street Quants Set to Buy $50 Billion in Stocks as Volatility Falls".


What's next?

The full post can be found here.


Saturday, November 2, 2024

A final update on the Trump Trade: Tail-risk assessment

Preface: Explaining our market timing models 
We maintain several market timing models, each with differing time horizons. The "Ultimate Market Timing Model" is a long-term market timing model based on the research outlined in our post, Building the ultimate market timing model. This model tends to generate only a handful of signals each decade.

The Trend Asset Allocation Model is an asset allocation model that applies trend-following principles based on the inputs of global stock and commodity prices. This model has a shorter time horizon and tends to turn over about 4-6 times a year. The performance and full details of a model portfolio based on the out-of-sample signals of the Trend Model can be found here.


My inner trader uses a trading model, which is a blend of price momentum (is the Trend Model becoming more bullish, or bearish?) and overbought/oversold extremes (don't buy if the trend is overbought, and vice versa). Subscribers receive real-time alerts of model changes, and a hypothetical trading record of the email alerts is updated weekly here. The hypothetical trading record of the trading model of the real-time alerts that began in March 2016 is shown below.


The latest signals of each model are as follows:

  • Ultimate market timing model: Buy equities (Last changed from “sell” on 28-Jul-2023)*
  • Trend Model signal: Bullish (Last changed from “neutral” on 11-Oct-2024)*
  • Trading model: Bullish (Last changed from “neutral” on 15-Oct-2024)*
* The performance chart and model readings have been delayed by a week out of respect to our paying subscribers.

Update schedule: I generally update model readings on my site on weekends. I am also on X/Twitter at @humblestudent. Subscribers receive real-time alerts of trading model changes, and a hypothetical trading record of those email alerts is shown here.

Subscribers can access the latest signal in real time here.
 

A Trump Trade update

Just ahead of the U.S. election, here is an update on the polls and the Trump trade. The polls show a very tight race. As a matter of perspective, here is a sensitivity analysis of what would happen if the polling errors were the same as they were in 2020 and 2022.

My view is that the election has been a referendum on Trump. Trump has always had a base support of about 40% of the electorate. Against that, the Democrats have their base and a coalition of never-Trumper Republicans. Opinions on both sides have been substantially dug in. What really matters in the end is the effectiveness of each side’s “get out the vote” efforts.
 
As a reminder, each of following charts of Trump factors is designed so that a rising line denotes rising favourability for a Trump victory. 
  • Trump Media & Technology Group: It’s a proxy for Trump enthusiasm as it’s the holding company for Truth Social, Trump’s social media vehicle.
  • Domestic Revenue Stock ETF vs. S&P 500: One of Trump’s main platforms is to use tariffs to bring manufacturing back to the U.S.
  • Inflation Expectations: Trump’s tariff policies are expected to be inflationary.
  • Poland vs. Euro STOXX 50: Poland has been a surprise growth engine in the EU, but it neighbours Ukraine and the relative performance of its market is a measure of Ukrainian anxiety.
  • Gasoline Price: Gasoline can be thought of as an anti-incumbent trade. Rising prices depress consumer sentiment and it’s negative for the incumbent.
Each has its idiosyncrasies. Even though Trump factors have taken a last-minute wobble, the general trend in the Trump trade has been up.

The full post can be found here.