Monday, November 15, 2021

The inflation challenge

Inflation fears have been rising in the wake of the hot October CPI report. Barry Ritholz, the CEO of Ritholz Wealth Management, recently issued an open challenge to the inflationistas.


Which side of that bet would you take?

The full post can be found here.
Sunday, November 14, 2021

The seasonal rally is intact

Preface: Explaining our market timing models 
We maintain several market timing models, each with differing time horizons. The "Ultimate Market Timing Model" is a long-term market timing model based on the research outlined in our post, Building the ultimate market timing model. This model tends to generate only a handful of signals each decade.

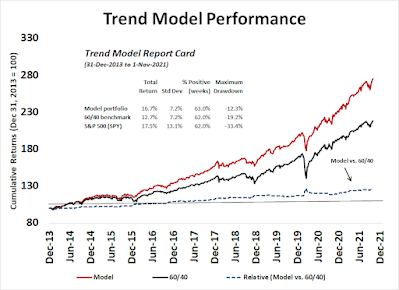
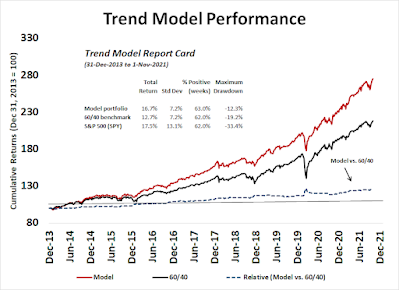
The Trend Asset Allocation Model is an asset allocation model that applies trend following principles based on the inputs of global stock and commodity price. This model has a shorter time horizon and tends to turn over about 4-6 times a year. The performance and full details of a model portfolio based on the out-of-sample signals of the Trend Model can be found here.


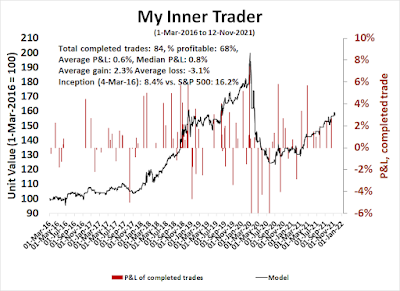
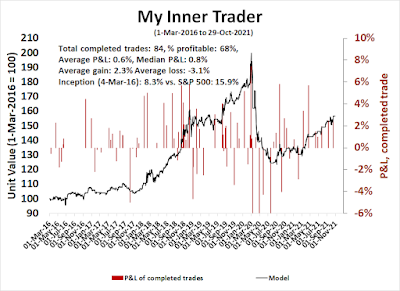
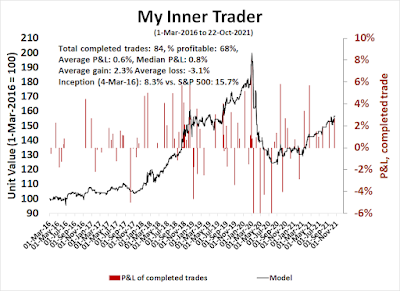
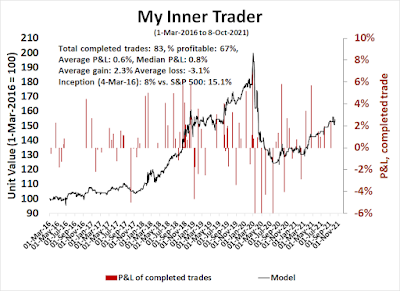
My inner trader uses a trading model, which is a blend of price momentum (is the Trend Model becoming more bullish, or bearish?) and overbought/oversold extremes (don't buy if the trend is overbought, and vice versa). Subscribers receive real-time alerts of model changes, and a hypothetical trading record of the email alerts is updated weekly here. The hypothetical trading record of the trading model of the real-time alerts that began in March 2016 is shown below.


The latest signals of each model are as follows:
  • Ultimate market timing model: Buy equities*
  • Trend Model signal: Bullish*
  • Trading model: Bullish*
* The performance chart and model readings have been delayed by a week out of respect to our paying subscribers.

Update schedule: I generally update model readings on my site on weekends and tweet mid-week observations at @humblestudent. Subscribers receive real-time alerts of trading model changes, and a hypothetical trading record of those email alerts is shown here.

Subscribers can access the latest signal in real-time here.


The most wonderful time of the year?
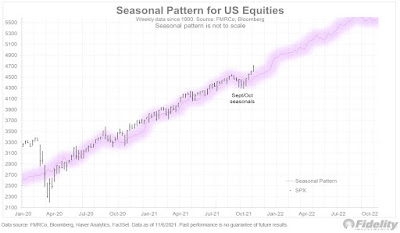
Jurrien Timmer at Fidelity observed that the S&P 500 is roughly following the pattern of a seasonal rally into year-end and beyond. In light of last week's market weakness, what's the health of the seasonal rally in 2021?


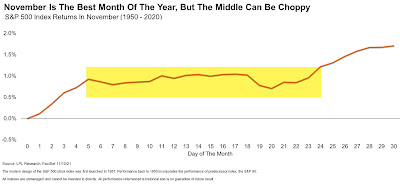
However, traders who rely on seasonality should be cautious as Ryan Detrick pointed out the middle of November can be choppy.


The full post can be found here.

Friday, November 12, 2021

Commodity weakness = Global slowdown?

My Trend Asset Allocation Model has performed well by beating a 60/40 benchmark on an out-of-sample basis in the last few years. The early version of the Trend Model relied exclusively on commodity prices for signals of global reflation and deflation. While the inputs have changed to include global equity prices, this nevertheless raises some concerns for equity investors. 


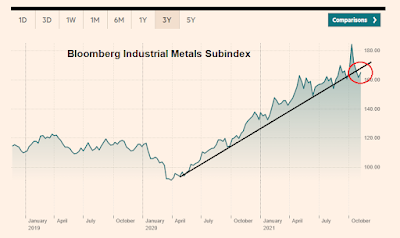
Commodity prices are weakening, which could be a signal of global economic deceleration. In particular, the cyclically sensitive industrial metals are losing momentum and showing signs of violating a rising trend line.


The full post can be found here.

Wednesday, November 10, 2021

Bullish and bearish signals from volatility

Mid-week market update: Volatility indexes are flashing a number of signals of interest. In the past few weeks, a yawning gap has opened out between MOVE, which measures bond volatility, and VIX, which measures equity volatility. The divergence has begun to close in the last couple of days as the VIX has risen and the spread has narrowed.


The full post can be found here.

Sunday, November 7, 2021

A question of leadership

Preface: Explaining our market timing models 
We maintain several market timing models, each with differing time horizons. The "Ultimate Market Timing Model" is a long-term market timing model based on the research outlined in our post, Building the ultimate market timing model. This model tends to generate only a handful of signals each decade.

The Trend Asset Allocation Model is an asset allocation model that applies trend following principles based on the inputs of global stock and commodity price. This model has a shorter time horizon and tends to turn over about 4-6 times a year. The performance and full details of a model portfolio based on the out-of-sample signals of the Trend Model can be found here.


My inner trader uses a trading model, which is a blend of price momentum (is the Trend Model becoming more bullish, or bearish?) and overbought/oversold extremes (don't buy if the trend is overbought, and vice versa). Subscribers receive real-time alerts of model changes, and a hypothetical trading record of the email alerts is updated weekly here. The hypothetical trading record of the trading model of the real-time alerts that began in March 2016 is shown below.


The latest signals of each model are as follows:
  • Ultimate market timing model: Buy equities*
  • Trend Model signal: Bullish*
  • Trading model: Neutral*
* The performance chart and model readings have been delayed by a week out of respect to our paying subscribers.

Update schedule: I generally update model readings on my site on weekends and tweet mid-week observations at @humblestudent. Subscribers receive real-time alerts of trading model changes, and a hypothetical trading record of those email alerts is shown here.

Subscribers can access the latest signal in real-time here.


Nagging questions of leadership
It is said that the most bullish thing a market could do is to make fresh highs. An even more bullish development is to see the market break out to fresh highs across all spectrums. Indeed, the large-cap S&P 500, mid-cap S&P 400, small-cap S&P 600, and the NASDAQ Composite has achieved all-time highs.


However, discussions with several readers revealed nagging questions about the quality of the leadership in this advance.

The full post can be found here.

Saturday, November 6, 2021

A Dow Theory buy signal, but...

Jack Schannep at DowTheory.com described a classic Dow Theory buy signal this way:
The classic Buy signal is developed as follows: After the low point of a primary downtrend in a Bear market is established, a secondary uptrend (this is the most often debated part of the Theory) bounce will occur. After that, a pullback on one of the averages must exceed 3%, according to Robert Rhea in his 1930's The Dow Theory,  must then, ideally, hold above the prior lows on both the Industrial and the Transportation Averages. Finally, a breakout above the previous rally high by both, constitutes a BUY Signal for the developing Bull market.

The chart represents how the Dow Jones Industrial Average and the Transportation Average might look under the most usual BUY signal (B-1):


Both the Dow and the Transports made all-time highs last week, aided by a surge in the shares of Avis. The technical pattern is consistent with the description of a Dow Theory buy signal.


While the Dow Theory buy signal is bullish for stock prices, a number of key risks are lurking as I look forward to 2022.

The full post can be found here.

Wednesday, November 3, 2021

A no-surprise Federal Reserve

Mid-week market update: I told you so. Earlier in the week, I wrote that the market had become overly hawkish about interest rate expectations (see Hawkish expectations). Leading up to the November FOMC meeting, the Fed had signaled that a QE taper is about to begin and, if everything goes along with projections, the first rate hike would occur in late 2022.

Fed watcher Tim Duy added (before the meeting) that the Fed had unveiled its spanking new FAIT framework and it was unlikely to abandon it so quickly.
The Fed doesn't want to drop the new framework at the first sign of trouble. The issue of full employment still obstructs the path to rate hikes. If the Fed were to pull tapering forward, the implication would be either the Fed is abandoning its new shiny new framework or that it has redefined full employment. Remember, there is institutional inertia at play here...The new framework sets the Fed apart from its central banking peers that are quickly pivoting in a hawkish direction. Indeed, the new framework is intended to prevent such a pivot, which means that if the Fed were to move in the BoC/BoE/RBA/RBNZ direction, it would amount to abandoning the new framework.

We got a dovish taper, which is what I expected. The 2-year Treasury yield eased in reaction to the FOMC decision and the yield curve steepened.


The full post can be found here.


Monday, November 1, 2021

Hawkish expectations

Short-term rates are freaking out. 2-year yields are rising based on the expectation of a tightening bias by global central bankers.


The market should gain greater clarity on central bank intentions soon. Both the Fed and the BoE will announce their interest rate decisions this week and the BLS will report Non-Farm Payroll Friday.

The full post can be found here.

Sunday, October 31, 2021

Waiting for the FOMC

Preface: Explaining our market timing models 
We maintain several market timing models, each with differing time horizons. The "Ultimate Market Timing Model" is a long-term market timing model based on the research outlined in our post, Building the ultimate market timing model. This model tends to generate only a handful of signals each decade.

The Trend Asset Allocation Model is an asset allocation model that applies trend following principles based on the inputs of global stock and commodity price. This model has a shorter time horizon and tends to turn over about 4-6 times a year. The performance and full details of a model portfolio based on the out-of-sample signals of the Trend Model can be found here.


My inner trader uses a trading model, which is a blend of price momentum (is the Trend Model becoming more bullish, or bearish?) and overbought/oversold extremes (don't buy if the trend is overbought, and vice versa). Subscribers receive real-time alerts of model changes, and a hypothetical trading record of the email alerts is updated weekly here. The hypothetical trading record of the trading model of the real-time alerts that began in March 2016 is shown below.


The latest signals of each model are as follows:
  • Ultimate market timing model: Buy equities*
  • Trend Model signal: Bullish*
  • Trading model: Neutral*
* The performance chart and model readings have been delayed by a week out of respect to our paying subscribers.

Update schedule: I generally update model readings on my site on weekends and tweet mid-week observations at @humblestudent. Subscribers receive real-time alerts of trading model changes, and a hypothetical trading record of those email alerts is shown here.

Subscribers can access the latest signal in real-time here.


An asset rotation review
A review of the asset returns on an RRG chart and found a possible inflection point for both equity market leadership and bond prices. As a reminder, I use the Relative Rotation Graphs, or RRG charts, as the primary tool for the analysis of sector and style leadership. As an explanation, RRG charts are a way of depicting the changes in leadership in different groups, such as sectors, countries or regions, or market factors. The charts are organized into four quadrants. The typical group rotation pattern occurs in a clockwise fashion. Leading groups (top right) deteriorate to weakening groups (bottom right), which then rotates to lagging groups (bottom left), which change to improving groups (top left), and finally completes the cycle by improving to leading groups (top right) again.


Here are the main takeaways from the analysis of daily asset returns using a 60/40 US stock/bond mix as a benchmark for USD investors.
  • The S&P 500 is in the leading quadrant and shows no signs of weakness. The market is on track for a rally into year-end. The open question is whether value or growth stocks will lead the charge.
  • EAFE, or developed market international stocks, is in the improving quadrant, but price momentum is weakish.
  • MSCI China is also in the leading quadrant, but it is showing some signs of weakness. Investors are returning to Chinese equities but face considerable risks.
  • EM xChina has fallen into the lagging quadrant.
  • Bond prices are in the lagging quadrant but showing signs of improvement. In particular, long Treasuries (TLT) is on the verge on rising into the improving quadrant. Much depends on the language from the FOMC meeting in the coming week.
The full post can be found here.

Saturday, October 30, 2021

Making sense of the Great Resignation

An unusual labor market shift has occurred since the onset of the pandemic. Employers everywhere are complaining about a lack of quality employees. The Beveridge Curve, which describes the relationship between the unemployment rate and the job opening rate, has steepened considerably. 


Workers are not returning to their jobs, at least not without considerably more incentives. Some factors that affected labor supply are temporary and should moderate over time, such as the fear of catching COVID-19 and childcare availability, but many people are reassessing their priorities in the wake of the pandemic. They call it the "Great Resignation".

The full post can be found here.

Wednesday, October 27, 2021

A brief pause in the advance

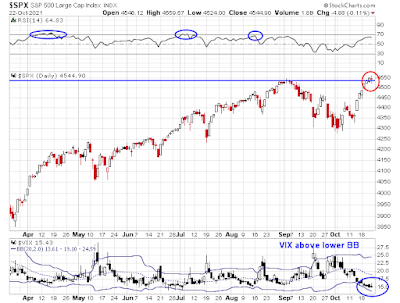
Mid-week market update: The S&P 500 had been on an upper Bollinger Band ride, but the ride may be over. In the past year, such events have resolved themselves in either a sideways consolidation or pullback. As well, the 14-day RSI has reached levels consistent with a pause in the advance. 


Based on recent history, we should know about the magnitude of the pullback within a week. Initial support can be found at the breakout level of about 4540.

The full post can be found here.

Sunday, October 24, 2021

What more could the bulls ask for?

Preface: Explaining our market timing models 
We maintain several market timing models, each with differing time horizons. The "Ultimate Market Timing Model" is a long-term market timing model based on the research outlined in our post, Building the ultimate market timing model. This model tends to generate only a handful of signals each decade.

The Trend Asset Allocation Model is an asset allocation model that applies trend following principles based on the inputs of global stock and commodity price. This model has a shorter time horizon and tends to turn over about 4-6 times a year. The performance and full details of a model portfolio based on the out-of-sample signals of the Trend Model can be found here.


My inner trader uses a trading model, which is a blend of price momentum (is the Trend Model becoming more bullish, or bearish?) and overbought/oversold extremes (don't buy if the trend is overbought, and vice versa). Subscribers receive real-time alerts of model changes, and a hypothetical trading record of the email alerts is updated weekly here. The hypothetical trading record of the trading model of the real-time alerts that began in March 2016 is shown below.


The latest signals of each model are as follows:
  • Ultimate market timing model: Buy equities*
  • Trend Model signal: Bullish*
  • Trading model: Neutral*
* The performance chart and model readings have been delayed by a week out of respect to our paying subscribers.

Update schedule: I generally update model readings on my site on weekends and tweet mid-week observations at @humblestudent. Subscribers receive real-time alerts of trading model changes, and a hypothetical trading record of those email alerts is shown here.

Subscribers can access the latest signal in real-time here.


An all-time high
It is said that there is nothing more bullish that an all-time high. The S&P 500 did just that on Thursday. Neither of my warning signals have sounded warnings just yet. The 14-day RSI is not overbought. As well, the VIX Index has not fallen below its lower Bollinger Band.


What more could the bulls ask for?

The full post can be found here.

Saturday, October 23, 2021

Where are we in the market cycle?

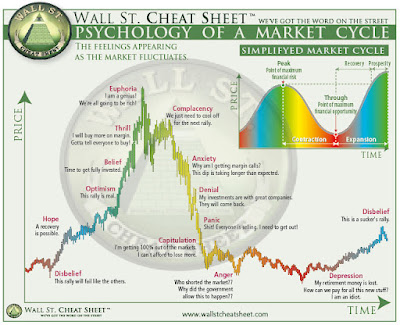
Where are we in the market cycle? The accompanying chart shows a stylized market cycle and changes in sector leadership.
  • Bear markets are characterized by the leadership of defensive sectors such as healthcare, consumer staples and utilities.
  • Early-cycle markets are sparked by the monetary stimulus or the promise of monetary stimulus. The market leaders in this phase are the interest-sensitive sectors such as financials and real estate.
  • Mid-cycle markets are characterized by economic expansion. Expect rotation into consumer discretionary stocks, followed by capital-intensive industrials and technology.
  • Late-cycle markets will find investors become increasingly concerned about inflation. Inflation hedge sectors such as energy and materials lead during this phase.
  • In response to rising inflation expectations, either the central bank or the market tightens monetary policy, which resolves in a market top and a bear market.


Please be aware that while the psychology of a market cycle parallels an economic cycle, they are not the same. Since Wall Street's attention span approximates that of a 16-year-old, it is not unusual at all to find several market cycles compressed within a single economic cycle.

What I have described is an idealized market cycle. This economic and market cycle is very different from others. The last bear market was not sparked by monetary tightening, but the exogenous effect of a pandemic. The market leaders of the 2020 bear were not the usual defensive names. Instead, investors piled into work-from-home beneficiaries consisting mostly of Big Tech stocks.

With that preface in mind, where are we in the psychology of the market cycle?

The full post can be found here.
Wednesday, October 20, 2021

Another upper BB ride

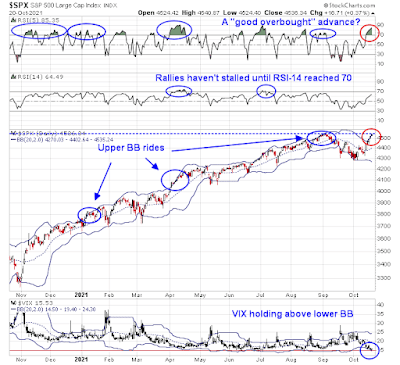
Mid-week market update: The S&P 500 has been undergoing a ride on its upper Bollinger Band (BB), which historically has been a bullish sign of price momentum. The bigger question is how the tape will behave when the upper BB ride ends.


The full post can be found here.

Monday, October 18, 2021

Opportunities in energy and gold

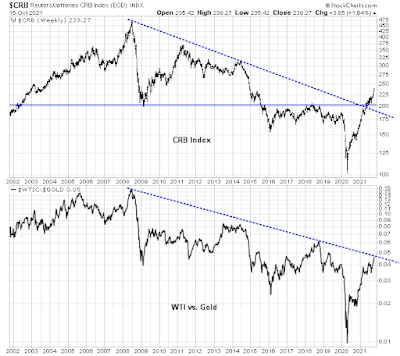
As the CRB Index decisively broke out to a new recovery high while breaking through both a horizontal resistance level and a falling downtrend that began in 2008, a divergence is appearing between crude oil and gold. The oil to gold ratio has strengthened to test a falling trend line. 


This test of trend line resistance could present some opportunities for traders.

The full post can be found here.

Sunday, October 17, 2021

Market liftoff?

Preface: Explaining our market timing models 
We maintain several market timing models, each with differing time horizons. The "Ultimate Market Timing Model" is a long-term market timing model based on the research outlined in our post, Building the ultimate market timing model. This model tends to generate only a handful of signals each decade.

The Trend Asset Allocation Model is an asset allocation model that applies trend following principles based on the inputs of global stock and commodity price. This model has a shorter time horizon and tends to turn over about 4-6 times a year. The performance and full details of a model portfolio based on the out-of-sample signals of the Trend Model can be found here.


My inner trader uses a trading model, which is a blend of price momentum (is the Trend Model becoming more bullish, or bearish?) and overbought/oversold extremes (don't buy if the trend is overbought, and vice versa). Subscribers receive real-time alerts of model changes, and a hypothetical trading record of the email alerts is updated weekly here. The hypothetical trading record of the trading model of the real-time alerts that began in March 2016 is shown below.


The latest signals of each model are as follows:
  • Ultimate market timing model: Buy equities*
  • Trend Model signal: Bullish*
  • Trading model: Bullish*
* The performance chart and model readings have been delayed by a week out of respect to our paying subscribers.

Update schedule: I generally update model readings on my site on weekends and tweet mid-week observations at @humblestudent. Subscribers receive real-time alerts of trading model changes, and a hypothetical trading record of those email alerts is shown here.

Subscribers can access the latest signal in real-time here.


To boldly go?
Last week, I characterized the stock market as like a rocket on a launch pad. Last week's events also featured William Shatner, the actor who played Captain Kirk in the original Star Trek series, being blasted into space. Now that Captain Kirk has gone into space, will equities follow?

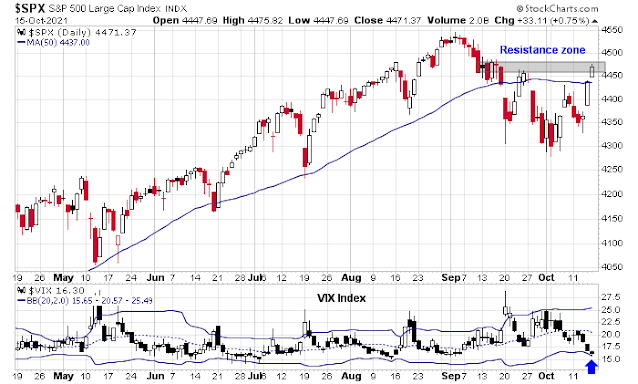
Let's take a look. One of the bullish tripwires I outlined was for the S&P 500 to decisively regain its 50 dma. The index convincingly breached the 50 dma and it is now testing a resistance zone, which is positive.


However, traders are cautioned to monitor the VIX Index. In the past, VIX breaches of the lower Bollinger Band have been overbought signals when market rallies have temporarily stalled in the past.

The full post can be found here.

Saturday, October 16, 2021

Team Stagflation, or Team Transitory?

Stagflation fears are rising again. It's a natural reaction to the short-term data. September headline CPI came in hot, though the core CPI print was in line with expectations and PPI was soft. Inflation expectations are spiking...


...while the Atlanta Fed's GDP nowcast is plummeting. Consumer confidence is dropping, driven by supply chain bottlenecks and rising costs. The combination of these factors is becoming a threat to corporate profits.


As a QE taper is more or less baked in for November, these worries have unsettled markets as the narrative is that the Fed could be making a policy mistake. Should investors cast their lot with Team Stagflation, or Team Transitory?

The full post can be found here.
Wednesday, October 13, 2021

An excess of caution?

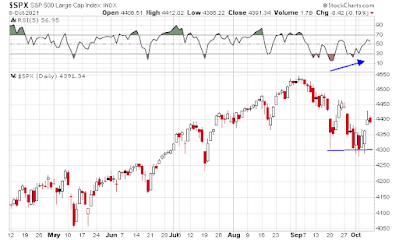
Mid-week market update: Is market psychology cautious enough? A recent Deutsche Bank survey of investors reveals that not only is a correction the consensus, correction sentiment rose between September and October.


The full post can be found here.

Sunday, October 10, 2021

What rhymes with 2011?

Preface: Explaining our market timing models 
We maintain several market timing models, each with differing time horizons. The "Ultimate Market Timing Model" is a long-term market timing model based on the research outlined in our post, Building the ultimate market timing model. This model tends to generate only a handful of signals each decade.

The Trend Asset Allocation Model is an asset allocation model that applies trend following principles based on the inputs of global stock and commodity price. This model has a shorter time horizon and tends to turn over about 4-6 times a year. The performance and full details of a model portfolio based on the out-of-sample signals of the Trend Model can be found here.


My inner trader uses a trading model, which is a blend of price momentum (is the Trend Model becoming more bullish, or bearish?) and overbought/oversold extremes (don't buy if the trend is overbought, and vice versa). Subscribers receive real-time alerts of model changes, and a hypothetical trading record of the email alerts is updated weekly here. The hypothetical trading record of the trading model of the real-time alerts that began in March 2016 is shown below.


The latest signals of each model are as follows:
  • Ultimate market timing model: Buy equities*
  • Trend Model signal: Bullish*
  • Trading model: Bullish*
* The performance chart and model readings have been delayed by a week out of respect to our paying subscribers.

Update schedule: I generally update model readings on my site on weekends and tweet mid-week observations at @humblestudent. Subscribers receive real-time alerts of trading model changes, and a hypothetical trading record of those email alerts is shown here.

Subscribers can access the latest signal in real-time here.


The 2011 template
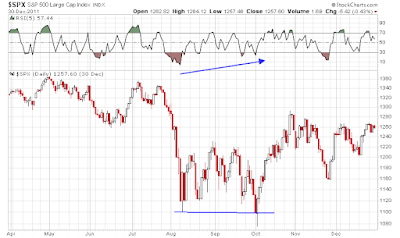
The market action today is somewhat reminiscent of 2011. Then, the macro backdrop was characterized by a debt ceiling impasse in Washington and a Greek Crisis in Europe that threatened the very existence of the eurozone. I can remember endless European summits and plans to make plans for Greece. The news flow worsened and it seemed like no one was in charge in Europe, but the S&P 500 tested support multiple times while exhibiting a series of positive RSI divergences. The logjam was finally broken when the ECB stepped in and announced its LTRO program. Stocks bottomed and never looked back.


History doesn't repeat itself, but rhymes. Today, the market has been beset by a debt ceiling impasse in Washington and concerns over inflationary pressures which may or may not be transitory from supply chain bottlenecks. The logjam appears to have been temporarily broken when the Democrats and Republicans agreed to kick the can down the road and revisit the debt ceiling question in December. Stock prices duly staged a relief rally.


Does 2011 rhyme with 2021?

The full post can be found here.

Saturday, October 9, 2021

Will the energy price surge cause a recession?

As energy prices surged around the world, I had an extensive discussion with a reader about whether the latest price spike could cause a recession. This is an important consideration for investors as recessions are equity bull market killers.

The evidence isn't clear. On one hand, every recession in the post-War period (shaded grey zones) has been accompanied by rising oil prices. On the other hand, interest rates were also rising in virtually all of the cases.


The full post can be found here.