Sunday, March 3, 2024

How to trade the YOLO and FOMO market

Preface: Explaining our market timing models 
We maintain several market timing models, each with differing time horizons. The "Ultimate Market Timing Model" is a long-term market timing model based on the research outlined in our post, Building the ultimate market timing model. This model tends to generate only a handful of signals each decade.

The Trend Asset Allocation Model is an asset allocation model that applies trend-following principles based on the inputs of global stock and commodity prices. This model has a shorter time horizon and tends to turn over about 4-6 times a year. The performance and full details of a model portfolio based on the out-of-sample signals of the Trend Model can be found here.


My inner trader uses a trading model, which is a blend of price momentum (is the Trend Model becoming more bullish, or bearish?) and overbought/oversold extremes (don't buy if the trend is overbought, and vice versa). Subscribers receive real-time alerts of model changes, and a hypothetical trading record of the email alerts is updated weekly here. The hypothetical trading record of the trading model of the real-time alerts that began in March 2016 is shown below.
 

The latest signals of each model are as follows:

  • Ultimate market timing model: Buy equities (Last changed from “sell” on 28-Jul-2023)*
  • Trend Model signal: Bullish (Last changed from “neutral” on 28-Jul-2023)*
  • Trading model: Neutral (Last changed from “bullish” on 24-Jan-2024)*
* The performance chart and model readings have been delayed by a week out of respect to our paying subscribers.

Update schedule: I generally update model readings on my site on weekends. I am also on X/Twitter at @humblestudent. Subscribers receive real-time alerts of trading model changes, and a hypothetical trading record of those email alerts is shown here.

Subscribers can access the latest signal in real time here.
 

A YOLO and FOMO market

Another week, another all-time high for the S&P 500 and NASDAQ Composite. The U.S. market has been infected with the FOMO (You Only Live Once) and FOMO (Fear of Missing Out) sentiment viruses while numerous macro and technical warnings have appeared.

As an example, Bitcoin prices have soared. Historically, Bitcoin has been correlated with the relative performance of the ARK Innovation ETF (ARKK), which is a bellwether for speculative growth stocks. This time, ARKK hasn’t risen as much. Is this a positive or negative divergence?

 
The full post can be found here.

Saturday, March 2, 2024

Are you ready to be a contrarian cigar butt investor?

How would you feel about a star value manager with the track record shown in the chart below. While he beat the market in the wake of the dot-com bubble, he has only matched the performance of the S&P 500 since 2011. To be sure, he did beat his style benchmark (second panel).
 
The star manager is none other than the legendary Warren Buffett and the chart shows the relative performance of Berkshire Hathaway’s stock price relative to the S&P 500 and the Russell 1000 Value Index. Buffett’s best known recent win was his purchase of Apple in 2016 which became his largest holding, and whose relative returns are shown in the bottom panel.

 
I examine how he achieved his results, and offer studies of sources of alpha as examples of different investing styles.

The full post can be found here.

Wednesday, February 28, 2024

How extended is this market?

Mid-week market update: I have said before that the stock market is extended in its advance and it could pull back at any time. How extended? Here is another metric.
 
Bollinger Bands (BB) are overbought/oversold indicators. If a stock or index rises above its 2 standard deviation BB. it is said to be overbought. Standard calculations of BBs are based on a 20 dma. It's unusual to see the market rise up above its upper 200 dma BB. The S&P 500 recently reached 110% above of its upper BB. The history of such episodes (pink bars) show that it usually pulls back soon afterwards. There were only two exceptions since 1997 when the market experienced a sustained uptrend (shown by arrows).


The full post can be found here.

Sunday, February 25, 2024

Did the NVIDIA-fueled rally exhaust the bulls?

Preface: Explaining our market timing models 
We maintain several market timing models, each with differing time horizons. The "Ultimate Market Timing Model" is a long-term market timing model based on the research outlined in our post, Building the ultimate market timing model. This model tends to generate only a handful of signals each decade.

The Trend Asset Allocation Model is an asset allocation model that applies trend-following principles based on the inputs of global stock and commodity prices. This model has a shorter time horizon and tends to turn over about 4-6 times a year. The performance and full details of a model portfolio based on the out-of-sample signals of the Trend Model can be found here.


My inner trader uses a trading model, which is a blend of price momentum (is the Trend Model becoming more bullish, or bearish?) and overbought/oversold extremes (don't buy if the trend is overbought, and vice versa). Subscribers receive real-time alerts of model changes, and a hypothetical trading record of the email alerts is updated weekly here. The hypothetical trading record of the trading model of the real-time alerts that began in March 2016 is shown below.
 

The latest signals of each model are as follows:

  • Ultimate market timing model: Buy equities (Last changed from “sell” on 28-Jul-2023)*
  • Trend Model signal: Bullish (Last changed from “neutral” on 28-Jul-2023)*
  • Trading model: Neutral (Last changed from “bullish” on 24-Jan-2024)*
* The performance chart and model readings have been delayed by a week out of respect to our paying subscribers.

Update schedule: I generally update model readings on my site on weekends. I am also on X/Twitter at @humblestudent. Subscribers receive real-time alerts of trading model changes, and a hypothetical trading record of those email alerts is shown here.

Subscribers can access the latest signal in real time here.


NVIDIA’s week

The main market focus of last week was NVIDIA. Anticipation was building ahead of the company’s earnings report and option positioning was extremely bullish. In the end, the bulls were rewarded by a blowout report. NVIDIA’s stock surged and pulled the market up with it.

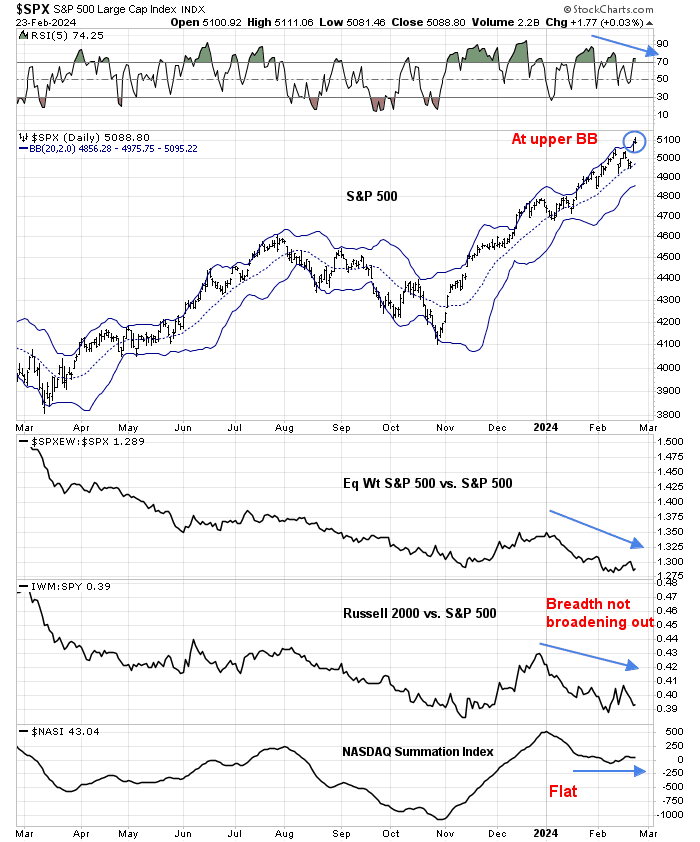
However, the advance was marred by poor internals. The rally in the S&P 500 took it to the top of its Bollinger Band, but it’s rare that upper BB rides are accompanied by negative RSI divergences and poor participation. Moreover, it’s unusual to see the market rally to an all-time high with the NASDAQ Summation Index flat when it should have been a source of strength.
 
 
The full post can be found here.

Saturday, February 24, 2024

The path to Magnificent Exuberance

Signs of technical deteriorations had been appearing last week, but NVIDIA’s earnings report saved the day. The earnings report can best be described as a blowout. The results beat Street expectations on all metrics and the company guided upwards. There wasn’t anything not to dislike about the report. As a consequence, the Semiconductor Index, which is a bellwether for artificial intelligence (AI) related plays, rallied strongly after briefly testing the lower bound of its absolute and relative return rising channels.


Even though some excesses are appearing, I reiterate my view that the AI bubble has far more room to run before it reaches the phase of Magnificent Exuberance (see Why this AI bull is nothing like the NASDAQ in 2000).

The full post can be found here.

Wednesday, February 21, 2024

NVIDIA at the bat

Mid-week market update: The poem "Casey at the Bat" may represent an apt analogy for today's stock market (see Wikipedia entry if you're unfamiliar with it). Technical warnings signs had been appearing. The S&P 500, the NASDAQ 100, and the Semiconductors Index, which is a bellwether for AI-related plays, had all weakened and violated their 10 dma. Even the Russell 2000 small cap index, which is largely unrelated to AI market factors, weakened below its 10 dma. 


Much like the story in the poem, it was up to Casey (NVDIA), mighty Casey (NVIDIA) to pull the team out at the end.
 
The full post can be found here.

Sunday, February 18, 2024

Are negative divergences necessarily bearish?

Preface: Explaining our market timing models 
We maintain several market timing models, each with differing time horizons. The "Ultimate Market Timing Model" is a long-term market timing model based on the research outlined in our post, Building the ultimate market timing model. This model tends to generate only a handful of signals each decade.

The Trend Asset Allocation Model is an asset allocation model that applies trend-following principles based on the inputs of global stock and commodity prices. This model has a shorter time horizon and tends to turn over about 4-6 times a year. The performance and full details of a model portfolio based on the out-of-sample signals of the Trend Model can be found here.


My inner trader uses a trading model, which is a blend of price momentum (is the Trend Model becoming more bullish, or bearish?) and overbought/oversold extremes (don't buy if the trend is overbought, and vice versa). Subscribers receive real-time alerts of model changes, and a hypothetical trading record of the email alerts is updated weekly here. The hypothetical trading record of the trading model of the real-time alerts that began in March 2016 is shown below.

The latest signals of each model are as follows:

  • Ultimate market timing model: Buy equities (Last changed from “sell” on 28-Jul-2023)*
  • Trend Model signal: Bullish (Last changed from “neutral” on 28-Jul-2023)*
  • Trading model: Neutral (Last changed from “bullish” on 24-Jan-2024)*
* The performance chart and model readings have been delayed by a week out of respect to our paying subscribers.

Update schedule: I generally update model readings on my site on weekends. I am also on X/Twitter at @humblestudent. Subscribers receive real-time alerts of trading model changes, and a hypothetical trading record of those email alerts is shown here.

Subscribers can access the latest signal in real time here.


Divergences everywhere

From a technical perspective, divergences may not matter in the short term, but long-term divergences are particularly worrisome. 

The accompanying chart shows a series of long-term divergences that are concerning. Even as the S&P 500 rallied to all-time highs, the NYSE Advance-Decline Line did not confirm the fresh high. The relative performance of high beta to low volatility stocks, which is an indicator of equity risk appetite, is barely testing its overhead resistance. In the meantime, the 10-year Treasury yield (inverted scale) has been climbing and higher yields offer an increasingly more attractive alternative for investors. And the USD, which is historically inversely correlated to the S&P 500, has been rallying and creating headwinds for stock prices.
 
 
How concerned should investors be about these divergences?
 
The full post can be found here.

Saturday, February 17, 2024

Is transitory disinflation here to stay?

I’ve discussed the risk of transitory disinflation before, and it manifested itself in the form of hotter-than-expected January CPI and PPI reports. The reports rattled the bond market and expectations of the first quarter-point rate cut has been pushed out from May to June and a slower rate cut trajectory for the remainder of year.


As a reminder, here is Fed Chair Powell reply in to a question about the timing of rate cuts in his 60 Minutes interview: “We just want to see more good [inflation] data along those lines. It doesn't need to be better than what we've seen, or even as good. It just needs to be good. And so, we do expect to see that.” 
 
The hot CPI report was undoubtedly a shock to Fed officials who had watching a series of tame inflation reports.

The latest BoA Global Fund Manager Survey showed that only 4% of respondents expect higher rates and 7% expect higher inflation. It was therefore no surprise that bond prices skidded badly in the wake of the CPI report.
 

Do the stronger-than-inflation reports mean a pivot to a “higher for longer” narrative? Here are bull and bear cases.
 
The full post can be found here.
Wednesday, February 14, 2024

A hiccup, or the start of a correction?

Mid-week market update: The hot CPI print on Tuesday spark a massive risk-off episode. The S&P 500 staged a partial recovery today. The key question is, "Is this just a hiccup in the bull run, or the start of a correction?"
 
The stock market has been ripe for a correction for some time. The percentage of bullish stocks on P&F charts has flashed a negative divergence, which has usually resolved in a market downdraft.

 
The full post can be found here.

Sunday, February 11, 2024

Why this AI bull is nothing like the NASDAQ in 2000

Preface: Explaining our market timing models 
We maintain several market timing models, each with differing time horizons. The "Ultimate Market Timing Model" is a long-term market timing model based on the research outlined in our post, Building the ultimate market timing model. This model tends to generate only a handful of signals each decade.

The Trend Asset Allocation Model is an asset allocation model that applies trend-following principles based on the inputs of global stock and commodity prices. This model has a shorter time horizon and tends to turn over about 4-6 times a year. The performance and full details of a model portfolio based on the out-of-sample signals of the Trend Model can be found here.


My inner trader uses a trading model, which is a blend of price momentum (is the Trend Model becoming more bullish, or bearish?) and overbought/oversold extremes (don't buy if the trend is overbought, and vice versa). Subscribers receive real-time alerts of model changes, and a hypothetical trading record of the email alerts is updated weekly here. The hypothetical trading record of the trading model of the real-time alerts that began in March 2016 is shown below.


The latest signals of each model are as follows:

  • Ultimate market timing model: Buy equities (Last changed from “sell” on 28-Jul-2023)*
  • Trend Model signal: Bullish (Last changed from “neutral” on 28-Jul-2023)*
  • Trading model: Neutral (Last changed from “bullish” on 24-Jan-2024)*
* The performance chart and model readings have been delayed by a week out of respect to our paying subscribers.

Update schedule: I generally update model readings on my site on weekends. I am also on X/Twitter at @humblestudent. Subscribers receive real-time alerts of trading model changes, and a hypothetical trading record of those email alerts is shown here.

Subscribers can access the latest signal in real time here.


Priced to the point of insanity?

You may have seen the charts of the relative performance of the NASDAQ 100 to S&P 500. The ratio has already exceeded the dot-com peak in 2000. In addition, NYU professor Aswath Damodaran, who is regarded as the dean of company valuations, went on CNBC to say that Nvidia is priced “to the point of insanity”, while the other Magnificent Seven stocks are roughly fairly priced.


While the latest AI-driven mania may seem stretched by historical standards, we would argue that it has a lot further to run before the AI bull is done.
 
The full post can be found here.

Saturday, February 10, 2024

How investable is China? (Revisited)

About a year ago, when China emerged out of its zero-COVID lockdowns, I rhetorically asked, “How investable is China?”. I concluded, “Long-term investors in China are likely to face subpar returns coupled with high volatility”.

Now that China’s troubles have returned, it’s time to revisit the China investability question. The accompanying chart shows that China’s debt has exploded over the past decades, driven by a regime of growth-at-any-cost malinvestment. Similar credit cycles in other economies have resolved in financial crises. Will China be any different and how should investors react?

 The full post can be found here.

Wednesday, February 7, 2024

Correction imminent?

Mid-week market update: I am sure everyone has seen the breadth divergences. Even as the S&P 500 rises to all-time highs, different versions of the Advance-Decline Line are struggling. Breadth deterioration is evident the further down you go in market capitalization.
 
 
The full post can be found here.

Sunday, February 4, 2024

Get ready to buy in May...

Preface: Explaining our market timing models 
We maintain several market timing models, each with differing time horizons. The "Ultimate Market Timing Model" is a long-term market timing model based on the research outlined in our post, Building the ultimate market timing model. This model tends to generate only a handful of signals each decade.

The Trend Asset Allocation Model is an asset allocation model that applies trend-following principles based on the inputs of global stock and commodity prices. This model has a shorter time horizon and tends to turn over about 4-6 times a year. The performance and full details of a model portfolio based on the out-of-sample signals of the Trend Model can be found here.


My inner trader uses a trading model, which is a blend of price momentum (is the Trend Model becoming more bullish, or bearish?) and overbought/oversold extremes (don't buy if the trend is overbought, and vice versa). Subscribers receive real-time alerts of model changes, and a hypothetical trading record of the email alerts is updated weekly here. The hypothetical trading record of the trading model of the real-time alerts that began in March 2016 is shown below.


The latest signals of each model are as follows:

  • Ultimate market timing model: Buy equities (Last changed from “sell” on 28-Jul-2023)*
  • Trend Model signal: Bullish (Last changed from “neutral” on 28-Jul-2023)*
  • Trading model: Neutral (Last changed from “bullish” on 24-Jan-2024)*
* The performance chart and model readings have been delayed by a week out of respect to our paying subscribers.

Update schedule: I generally update model readings on my site on weekends. I am also on X/Twitter at @humblestudent. Subscribers receive real-time alerts of trading model changes, and a hypothetical trading record of those email alerts is shown here.

Subscribers can access the latest signal in real time here.


A 2024 Roadmap

A combination of factors is converging to draw a stock market roadmap for 2024. Instead of the more familiar seasonal pattern of “sell in May and go away”, I would advocate a strategy of buying in May. The main factors that affect this roadmap are election year seasonality and the timing of the first rate cut.

Historically, the market has traced out a choppy pattern until May, followed by a rally into September, a pause and a rally into year-end. The market has so far outrun its seasonal pattern in 2024, with the warning that February has historically been weak during election years, according to Nautilus Investment Research.

The full post can be found here.

Saturday, February 3, 2024

How Trump's isolationism threatens long-term equity returns

Now that Donald Trump has become the presumptive Republican nominee for President, Wall Street is scrambling to model how a Trump White House may affect capital markets. A recent Bloomberg article summarized the consensus:
  • Bond market: Expect rising yields from upward pressures on term premium.
  • Currencies: Rising yields will put a bid under the USD.
  • Equities: Stocks in limbo as it’s difficult to form a consensus.
I wrote about the effects of a Trump victory about a month ago (see What the Politics of 2024 Tell Us About 2025) and highlighted the geopolitical risk from Trump’s foreign policy. Further analysis leads us to believe that Trump’s foreign policy could unravel the “Stocks for the Long Run” narrative popularized by Jeremy Siegel. This could have profound long-run implications for investors in their investment planning.


Here’s why.
 
The full post can be found here.

Wednesday, January 31, 2024

I told you there would be volatility

Mid-week market update: I told you that there would be volatility (see Numerous wildcards add up to ST volatility). In light of signs of stretched positioning, the prudent course of action for traders is to step to the sidelines.
 

Here are the different sources of volatility that are buffeting the markets.
 
The full post can be found here.

Sunday, January 28, 2024

Numerous wildcards add up to ST volatility

Preface: Explaining our market timing models 
We maintain several market timing models, each with differing time horizons. The "Ultimate Market Timing Model" is a long-term market timing model based on the research outlined in our post, Building the ultimate market timing model. This model tends to generate only a handful of signals each decade.

The Trend Asset Allocation Model is an asset allocation model that applies trend-following principles based on the inputs of global stock and commodity prices. This model has a shorter time horizon and tends to turn over about 4-6 times a year. The performance and full details of a model portfolio based on the out-of-sample signals of the Trend Model can be found here.


My inner trader uses a trading model, which is a blend of price momentum (is the Trend Model becoming more bullish, or bearish?) and overbought/oversold extremes (don't buy if the trend is overbought, and vice versa). Subscribers receive real-time alerts of model changes, and a hypothetical trading record of the email alerts is updated weekly here. The hypothetical trading record of the trading model of the real-time alerts that began in March 2016 is shown below.


The latest signals of each model are as follows:

  • Ultimate market timing model: Buy equities (Last changed from “sell” on 28-Jul-2023)*
  • Trend Model signal: Bullish (Last changed from “neutral” on 28-Jul-2023)*
  • Trading model: Bullish (Last changed from “neutral” on 17-Jan-2024)*
* The performance chart and model readings have been delayed by a week out of respect to our paying subscribers.

Update schedule: I generally update model readings on my site on weekends. I am also on X/Twitter at @humblestudent. Subscribers receive real-time alerts of trading model changes, and a hypothetical trading record of those email alerts is shown here.

Subscribers can access the latest signal in real time here.


A time for caution

As the S&P 500 tests the 4900 level, it faces a number of key technical, top-down macro and fundamental challenges. These challenges are wildcards to the near-term path of stock prices and form the potential for volatility in the coming week.

From a technical perspective, some caution is warranted. We recently highlighted a short-term buy signal when NYSE McClellan Oscillator (NYMO) recycled from oversold to neutral. The “take profits” tripwire for this trading signal occurs when NYMO reaches a positive reading, which occurred last Thursday. If you were tactically long the market, it’s time to reduce risk. Don’t try to be a hero.
 
 
The full post can be found here.

Beat the price increase

We are announcing a 5% price increase on subscriptions, effective February 1, 2024. Existing subscribers will be grandfathered at their current rates.

If you haven't subscribed, click this link to beat the price increase.

Saturday, January 27, 2024

What are the contagion effects of China's wipeout?

The problems keep piling up in China. Weakening demographics, as her population shrank for a second consecutive year. Weak consumer spending. A record property downturn. Rising trade tensions.

The drip-drip-drip of these glitches culminated in a massive stock market wipeout as over US$6 trillion has been wiped from the combined capitalization of the Chinese and Hong Kong markets since the 2021 market peak. As an illustration of the depth of the carnage, the Hang Seng Index fell to test levels seen at the 1997 handover to China. Beijing responded with a plan to order State Owned Enterprises to use its offshore currency reserves, which is estimated to be 2-trillion yuan, or US$278 billion, to buy Chinese stocks to prop up the market. In addition, the PBoC announced a half-point cut to the required reserve ratio on February 5 to provide greater liquidity to the financial system.
 
 
For investors, the key question is what’s the effect of skidding stock prices in China and nearby Hong Kong on the rest of the world?

The full post can be found here.


Beat the price increase

We are announcing a 5% price increase on subscriptions, effective February 1, 2024. Existing subscribers will be grandfathered at their current rates.

If you haven't subscribed, click this link to beat the price increase.

Wednesday, January 24, 2024

The market's upper BB roller coaster ride

Mid-week market update: The S&P 500 has been riding its upper Bollinger Band. Historically, upper BB rides haven't been all that bearish, but the current episode is occurring against a backdrop of negative RSI divergences.
 
 
While the S&P 500 may be on an upper BB ride, it promises to be a roller coaster.

The full post can be found here.


Beat the price increase

We are announcing a 5% price increase on subscriptions, effective February 1, 2024. Existing subscribers will be grandfathered at their current rates.

If you haven't subscribed, click this link to beat the price increase.

Sunday, January 21, 2024

Exhausted bears, tiring bulls

Preface: Explaining our market timing models 
We maintain several market timing models, each with differing time horizons. The "Ultimate Market Timing Model" is a long-term market timing model based on the research outlined in our post, Building the ultimate market timing model. This model tends to generate only a handful of signals each decade.

The Trend Asset Allocation Model is an asset allocation model that applies trend-following principles based on the inputs of global stock and commodity prices. This model has a shorter time horizon and tends to turn over about 4-6 times a year. The performance and full details of a model portfolio based on the out-of-sample signals of the Trend Model can be found here.


My inner trader uses a trading model, which is a blend of price momentum (is the Trend Model becoming more bullish, or bearish?) and overbought/oversold extremes (don't buy if the trend is overbought, and vice versa). Subscribers receive real-time alerts of model changes, and a hypothetical trading record of the email alerts is updated weekly here. The hypothetical trading record of the trading model of the real-time alerts that began in March 2016 is shown below.


 The latest signals of each model are as follows:

  • Ultimate market timing model: Buy equities (Last changed from “sell” on 28-Jul-2023)*
  • Trend Model signal: Bullish (Last changed from “neutral” on 28-Jul-2023)*
  • Trading model: Neutral (Last changed from “bullish” on 02-Jan-2024)*
* The performance chart and model readings have been delayed by a week out of respect to our paying subscribers.

Update schedule: I generally update model readings on my site on weekends. I am also on X/Twitter at @humblestudent. Subscribers receive real-time alerts of trading model changes, and a hypothetical trading record of those email alerts is shown here.

Subscribers can access the latest signal in real time here.


Bearish capitulation

Last week, I suggested that the current market environment “argues for a buy the dip and sell the rip posture in trading”. When the S&P 500 fell a miniscule -1.8% on an peak-to-trough intraday basis, my models were registering signs of bearish exhaustion, which was a sign to buy the dip.
How could a -1.8% intraday drawdown spark such oversold extremes? One inter-market clue came from Asia, where Chinese and Hong Kong stocks cratered on bad news out of China. The Hang Seng Index skidded -4.1% on Wednesday to a new 52-week low, and there wasn’t a single advancing issue.

 
Jason Goepfert of SentimenTrader found that such episodes tended to resolve bullishly. It was therefore no surprise that the Hong Kong market rebounded the next day, and so did the S&P 500.

 The full post can be found here.


Beat the price increase

We are announcing a 5% price increase on subscriptions, effective February 1, 2024. Existing subscribers will be grandfathered at their current rates.

If you haven't subscribed, click this link to beat the price increase.

Saturday, January 20, 2024

At least 29 reasons to be bullish

Exhibitions of powerful price momentum are rare. Since the market bottom in 2002, there have been eight occasions when the percentage of S&P 500 above their 50 dma has surged from below 15% to over 90% in a brief period. That latest episode occurred when stock prices soared off the bottom in October 2023. These price surges were usually resolved in either a short-term consolidation or setback, but the S&P 500 was invariably higher a year later with a 100% success rate.

I conducted a bottom-up scan of stock charts to look for technical uptrends and strong breakout formations. The scan isn’t meant to create a complete list of stocks with bullish technical outlooks. 

My evaluation framework is based on two components: the simple analysis of a weekly chart of the stock in the top panel, and the relative performance of the stock against the S&P 500 in the bottom panel. U chose the weekly chart as a way of filtering out the noise from daily price movements and better show the intermediate price trend. Ideally, both should be either in uptrends or breaking out on both an absolute and relative basis.
 
I found at least 29 charts with bullish technical patterns, none of which should be considered to be buy recommendations without further individual fundamental due diligence. Taken together, I came away with a stronger conviction of intermediate bullishness for the stock market, sector and industries. As well, this bottom-up analysis also pointed to bullish macro conclusions about the economy.
 

The full post can be found here.


Beat the price increase

We are announcing a 5% price increase on subscriptions, effective February 1, 2024. Existing subscribers will be grandfathered at their current rates.

If you haven't subscribed, click this link to beat the price increase.