Saturday, September 30, 2023

Time to reconsider the equity bull case?

I highlighted a long-term buy signal in late July and early August when the monthly MACD of the NYSE Composite turned positive (see On the verge of a long-term buy signal and Trust (the bull), but verify (there’s no recession)). Historically, such buy signals have resolved in a bullish fashion with no bearish episodes and only normal equity-risk corrections. 
 
The recent pullback has changed the MACD reading from positive to negative (circled). There were two other instances since 1995 when this has happened – in August 1999 and in May 2012. Both turned out to be false warnings and the stock market continued to rise soon afterward. Nevertheless, is it time to reconsider the equity bull case?

 
The full post can be found here.

Wednesday, September 27, 2023

Bull-bear battleground at S&P 4200

Mid-week market update: On the weekend, I stated that my base case was the S&P 500 decline would stop at August low support of 4350, but there was a 25% chance that it would test the next trend line support at roughly 4200, or the 200 dma. Now that we are nearing that level, what’s the prognosis?


 The full post can be found here.

Sunday, September 24, 2023

Has the VIX lost its use as a fear gauge?

Preface: Explaining our market timing models 
We maintain several market timing models, each with differing time horizons. The "Ultimate Market Timing Model" is a long-term market timing model based on the research outlined in our post, Building the ultimate market timing model. This model tends to generate only a handful of signals each decade.

The Trend Asset Allocation Model is an asset allocation model that applies trend-following principles based on the inputs of global stock and commodity prices. This model has a shorter time horizon and tends to turn over about 4-6 times a year. The performance and full details of a model portfolio based on the out-of-sample signals of the Trend Model can be found here.
 
 
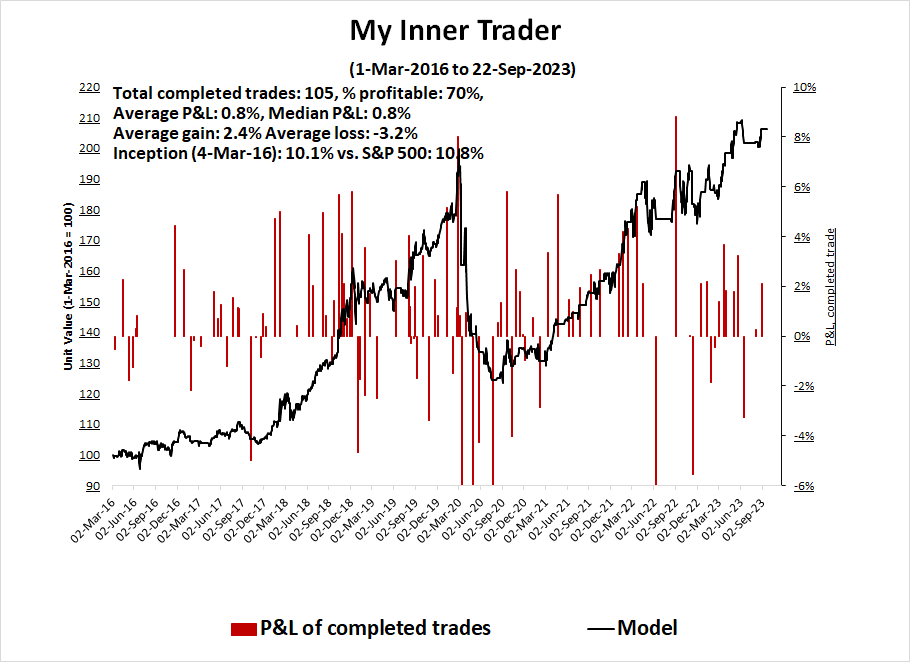
My inner trader uses a trading model, which is a blend of price momentum (is the Trend Model becoming more bullish, or bearish?) and overbought/oversold extremes (don't buy if the trend is overbought, and vice versa). Subscribers receive real-time alerts of model changes, and a hypothetical trading record of the email alerts is updated weekly here. The hypothetical trading record of the trading model of the real-time alerts that began in March 2016 is shown below.


The latest signals of each model are as follows:

  • Ultimate market timing model: Buy equities (Last changed from “sell” on 28-Jul-2023)*
  • Trend Model signal: Bullish (Last changed from “neutral” on 28-Jul-2023)*
  • Trading model: Neutral (Last changed from “bearish” on 03-Aug-2023)*
* The performance chart and model readings have been delayed by a week out of respect to our paying subscribers.

Update schedule: I generally update model readings on my site on weekends. I am also on X/Twitter at @humblestudent. Subscribers receive real-time alerts of trading model changes, and a hypothetical trading record of those email alerts is shown here.

Subscribers can access the latest signal in real time here.
 

VIX as fear gauge

There have been a series of recent articles highlighting the subdued level of the VIX Index and the seasonal tendency for equity volatility to spike this time of year (see this Barron’s article as an example). Other analysts have speculated that the VIX Index is failing as a fear gauge.

I have few opinions on the seasonality of the VIX, though last week has historically been a weak one for S&P 500 returns. However, I beg to differ on the use of the VIX as a fear gauge.
 
That’s because the VIX Index was not designed to be a fear indicator. It was designed to measure the implied volatility of a series of at-the-money options with a 1-month time horizon. While some analysts have seized upon implied volatility for use as a fear gauge, the index was never intended for use that way.
Indeed, the current explosion in 0DTE trading, or options that expire the same day, makes a 1-month implied volatility have less utility as a sentiment indicator. Arguably, VXST, or the 9-day VIX, is more useful to measure short-term sentiment. The accompanying chart shows that VXST was faster to spike in the current instance than VIX. The term structure of the VIX-VXST curve shows an inversion, which is an indication of fear appearing in the market.


The key question for investors is whether fear levels are high enough for a short-term bottom.
 
The full post can be found here.

Friday, September 22, 2023

Is stagflation in our future?

Last week, I pointed out that the Citi Inflation Surprise Index was turning up around the world. While one month doesn’t make a trend, what if the Fed is making a different kind of policy error? Instead of over-tightening into a recession, what if the U.S. economy achieves a soft landing or no landing and the Fed is under-tightening and never achieves its 2% inflation objective?


The probable outcome of that path is stagflation.
 
The full post can be found here.

Wednesday, September 20, 2023

A hawkish pause, but don't panic

Mid-week market update: It was a hawkish pause. The Fed’s decided to leave rates unchanged, but in the Summary of Economic Projections (SEP), it acknowledged that the economy is strong than its June projections. More importantly, the Fed Funds target for the end of this year remains unchanged, indicating that FOMC members expect another quarter-point rate hike, and raised rate expectations by a half-point for the next two years. In other words, higher for longer.


Moreover, the 2-year Treasury yield, which is a market proxy of the terminal Fed Funds rate, ended the day at 5.16%, a new cycle high.
 
Risk-off!

The full post can be found here.

Sunday, September 17, 2023

A battle royale for control of the tape

Preface: Explaining our market timing models 
We maintain several market timing models, each with differing time horizons. The "Ultimate Market Timing Model" is a long-term market timing model based on the research outlined in our post, Building the ultimate market timing model. This model tends to generate only a handful of signals each decade.

The Trend Asset Allocation Model is an asset allocation model that applies trend-following principles based on the inputs of global stock and commodity prices. This model has a shorter time horizon and tends to turn over about 4-6 times a year. The performance and full details of a model portfolio based on the out-of-sample signals of the Trend Model can be found here.
 
 
My inner trader uses a trading model, which is a blend of price momentum (is the Trend Model becoming more bullish, or bearish?) and overbought/oversold extremes (don't buy if the trend is overbought, and vice versa). Subscribers receive real-time alerts of model changes, and a hypothetical trading record of the email alerts is updated weekly here. The hypothetical trading record of the trading model of the real-time alerts that began in March 2016 is shown below.


The latest signals of each model are as follows:

  • Ultimate market timing model: Buy equities (Last changed from “sell” on 28-Jul-2023)*
  • Trend Model signal: Bullish (Last changed from “neutral” on 28-Jul-2023)*
  • Trading model: Neutral (Last changed from “bearish” on 03-Aug-2023)*
* The performance chart and model readings have been delayed by a week out of respect to our paying subscribers.

Update schedule: I generally update model readings on my site on weekends. I am also on X/Twitter at @humblestudent. Subscribers receive real-time alerts of trading model changes, and a hypothetical trading record of those email alerts is shown here.

Subscribers can access the latest signal in real time here.


Decision time

It’s nearing decision time. Both the S&P 500 and the NASDAQ 100 are forming wedge formations while testing their 50 dma supports. Will the market break up or down through the trend lines?


Upside or downside breaks would have strong directional implications. I believe the odds favour the bears. Here’s why.

The full post can be found here.

Saturday, September 16, 2023

How the USD could sink the S&P 500

Correlation isn’t causation, but the USD Index has shown a close inverse correlation to the S&P 500. The relationship partly ended when the S&P 500 surged on AI mania. However, small-cap stocks, which are less subject to the enthusiasm over the AI revolution, maintained their inverse correlation.


The USD Index is approaching a key resistance level. Assuming the inverse correlation were to continue, what are the bear and bear cases for the USD, and consequently U.S. equities?

The full post can be found here.

Wednesday, September 13, 2023

EM contrarian and momentum opportunities

Mid-week market update: Instead of just focusing on the U.S. market, I offer these two mystery charts of EM markets. One is a contrarian play, the other a momentum play.


 The full post can be found here.

Sunday, September 10, 2023

Tripwires to a deeper correction

Preface: Explaining our market timing models 
We maintain several market timing models, each with differing time horizons. The "Ultimate Market Timing Model" is a long-term market timing model based on the research outlined in our post, Building the ultimate market timing model. This model tends to generate only a handful of signals each decade.

The Trend Asset Allocation Model is an asset allocation model that applies trend-following principles based on the inputs of global stock and commodity prices. This model has a shorter time horizon and tends to turn over about 4-6 times a year. The performance and full details of a model portfolio based on the out-of-sample signals of the Trend Model can be found here.
 
 
My inner trader uses a trading model, which is a blend of price momentum (is the Trend Model becoming more bullish, or bearish?) and overbought/oversold extremes (don't buy if the trend is overbought, and vice versa). Subscribers receive real-time alerts of model changes, and a hypothetical trading record of the email alerts is updated weekly here. The hypothetical trading record of the trading model of the real-time alerts that began in March 2016 is shown below.


The latest signals of each model are as follows:

  • Ultimate market timing model: Buy equities (Last changed from “sell” on 28-Jul-2023)*
  • Trend Model signal: Bullish (Last changed from “neutral” on 28-Jul-2023)*
  • Trading model: Neutral (Last changed from “bearish” on 03-Aug-2023)*
* The performance chart and model readings have been delayed by a week out of respect to our paying subscribers.

Update schedule: I generally update model readings on my site on weekends. I am also on X/Twitter at @humblestudent. Subscribers receive real-time alerts of trading model changes, and a hypothetical trading record of those email alerts is shown here.

Subscribers can access the latest signal in real time here.


Where’s the bottom?

I highlighted how the 5-week RSI of the S&P 500 became extremely overbought. In the past, such instances have resolved with a correction (check), a relief rally (check), followed by a re-test of the correction lows. In three of the last four cases, the second re-test held at the old lows. The only exception was the COVID Crash of 2020, which was panic driven by macro fundamentals. If history is any guide, the next corrective low should terminate at about the site of the August low, which is ~4350.


While my base case is a bottom at about 4350, I nevertheless have to allow for the possibility of a deeper correction. Here’s what I am watching.

The full post can be found here.

Saturday, September 9, 2023

Investing during an era of Fiscal Dominance

As the Street parsed Powell’s Jackson Hole speech and obsessed over whether the Fed would raise an additional quarter-point, the annual Fed symposium at Jackson Hole is meant for central bankers to consider Big Ideas which reflect the concerns of the day.
 
The centrepiece of such ideas was usually an academic paper. As an example, the Big Idea in 2020 was “flexible average inflation targeting” and the now quaint problem of persistent low inflation. A paper by University of California at Berkeley academic Yuriy Gorodnichenko argued that the Fed needs clear, simple and transparent communication to create the link between higher inflation expectations and actual spending behaviour.
 
The Big Idea in 2023 is fiscal dominance, or the problem of big government deficits and skyrocketing debt around the world. 

How should investors position themselves in an era of persistent deficits, rising sovereign debt, and fiscal dominance?

The full post can be found here.

Wednesday, September 6, 2023

Can the S&P 500 overcome negative seasonality?

Mid-week market update: While I give seasonality only passing importance in trading, it is well known that September is seasonally negative for S&P 500 returns, which Callum Thomas recently documented. 


Can the stock market escape the negative seasonal pattern in 2023?

The full post can be found here.

Sunday, September 3, 2023

Vulnerable to a setback

Preface: Explaining our market timing models 
We maintain several market timing models, each with differing time horizons. The "Ultimate Market Timing Model" is a long-term market timing model based on the research outlined in our post, Building the ultimate market timing model. This model tends to generate only a handful of signals each decade.

The Trend Asset Allocation Model is an asset allocation model that applies trend-following principles based on the inputs of global stock and commodity prices. This model has a shorter time horizon and tends to turn over about 4-6 times a year. The performance and full details of a model portfolio based on the out-of-sample signals of the Trend Model can be found here.


My inner trader uses a trading model, which is a blend of price momentum (is the Trend Model becoming more bullish, or bearish?) and overbought/oversold extremes (don't buy if the trend is overbought, and vice versa). Subscribers receive real-time alerts of model changes, and a hypothetical trading record of the email alerts is updated weekly here. The hypothetical trading record of the trading model of the real-time alerts that began in March 2016 is shown below.


The latest signals of each model are as follows:

  • Ultimate market timing model: Buy equities (Last changed from “sell” on 28-Jul-2023)*
  • Trend Model signal: Bullish (Last changed from “neutral” on 28-Jul-2023)*
  • Trading model: Neutral (Last changed from “bearish” on 03-Aug-2023)*
* The performance chart and model readings have been delayed by a week out of respect to our paying subscribers.

Update schedule: I generally update model readings on my site on weekends. I am also on X/Twitter at @humblestudent. Subscribers receive real-time alerts of trading model changes, and a hypothetical trading record of those email alerts is shown here.

Subscribers can access the latest signal in real time here.


Mission accomplished

About two weeks ago, I highlighted the severe oversold nature of the stock market and suggested that it was poised for a relief rally. The relief rally duly arrived, and a week ago I set out a number of tripwires for traders to take profits on the tactical rally. All of the tripwires were triggered:
  • The S&P 500 exceeded the 50% retracement of the downdraft.
  • The NYSE McClellan Oscillator (NYMO) reached the zero neutral level.
  • The VIX Index reached its 20 dma. In fact, it blew through the 20 dma to breach its lower Bollinger Band, which is an overbought condition.


What’s next?

The full post can be found here.

Friday, September 1, 2023

A point and figure tour around the world

Sometimes it’s useful to step back and look at the big picture by ignoring the daily or weekly squiggles of the market. One useful technique of filtering out market squiggles is the point and figure (P&F) chart, which StockCharts describes this way:
Point & Figure charts consist of columns of X’s and O’s that represent filtered price movements. X-Columns represent rising prices and O-Columns represent falling prices. Each price box represents a specific value that price must reach to warrant an X or an O. Time is not a factor in P&F charting; these charts evolve as prices move. No movement in price means no change in the P&F chart.
I will be conducting a P&F tour of markets around the world. P&F charts are especially useful to interpret big picture patterns. Measured price objectives can be useful as indications of possible direction, but they have to be taken with a grain of salt.

With that preface, here is the weekly point and figure chart of MSCI All-Country World Index (ACWI) in USD with a 1% box and 3-box reversal. The index is correcting in the context of a recovery from a bear market. The measured price objective of 108.98 is a useful indication of the upside potential of the move.


Let’s continue this P&F tour around the world.

The full post can be found here.

Sunday, August 27, 2023

Is the relief rally over?

Preface: Explaining our market timing models 
We maintain several market timing models, each with differing time horizons. The "Ultimate Market Timing Model" is a long-term market timing model based on the research outlined in our post, Building the ultimate market timing model. This model tends to generate only a handful of signals each decade.

The Trend Asset Allocation Model is an asset allocation model that applies trend-following principles based on the inputs of global stock and commodity prices. This model has a shorter time horizon and tends to turn over about 4-6 times a year. The performance and full details of a model portfolio based on the out-of-sample signals of the Trend Model can be found here.


My inner trader uses a trading model, which is a blend of price momentum (is the Trend Model becoming more bullish, or bearish?) and overbought/oversold extremes (don't buy if the trend is overbought, and vice versa). Subscribers receive real-time alerts of model changes, and a hypothetical trading record of the email alerts is updated weekly here. The hypothetical trading record of the trading model of the real-time alerts that began in March 2016 is shown below.


The latest signals of each model are as follows:

  • Ultimate market timing model: Buy equities (Last changed from “sell” on 28-Jul-2023)*
  • Trend Model signal: Bullish (Last changed from “neutral” on 28-Jul-2023)*
  • Trading model: Bullish (Last changed from “neutral” on 16-Aug-2023)*
* The performance chart and model readings have been delayed by a week out of respect to our paying subscribers.

Update schedule: I generally update model readings on my site on weekends. I am also on Twitter at @humblestudent and on Mastodon at @humblestudent@toot.community. Subscribers receive real-time alerts of trading model changes, and a hypothetical trading record of those email alerts is shown here.

Subscribers can access the latest signal in real time here.


Sell the news?

Last week, I suggested that the stock market was ripe for a relief rally in the context of a deeper correction. The rally duly arrived. One of the main events was the earnings report from Nvidia, which blew the doors off Street expectations both on sales and earnings. The market reacted with Nvidia failing to hold its overnight gains. More importantly, the Semiconductor Index weakened below a key relative support level.


Is this a case of buy the rumour, sell the news? What does that mean about the short-term direction for stock prices. Is the relief rally over and a deeper correction about to begin?

The full post can be found here.

Friday, August 25, 2023

The risks to the resilient bull

Ever since the NYSE Composite monthly MACD flashed a long-term buy signal, I have been monitoring the risks to the bull. Past positive MACD crossovers have signaled long-term resilient equity bull markets and such signals have marked durable advances, which are subject to the normal equity risk of minor corrections without significant bearish episodes.


Part of investing is to be continually skeptical and avoid confirmation bias, which is why I have highlighted possible risks that could derail this bull in the past few weeks. I review these risks here, in addition to others that concern me:
The full post can be found here.

Wednesday, August 23, 2023

How far can the relief rally run?

Mid-week market update: I have been calling for a relief rally, followed by a deeper correction (see Why I am both bullish and bearish). The relief rally seems to have arrived as the S&P 500 breached the upper trend line of a falling channel while exhibiting improvements in new 52-week high breadth.


How far can the rally run?

The full post can be found here.

Sunday, August 20, 2023

Why I am both bullish and bearish

Preface: Explaining our market timing models 
We maintain several market timing models, each with differing time horizons. The "Ultimate Market Timing Model" is a long-term market timing model based on the research outlined in our post, Building the ultimate market timing model. This model tends to generate only a handful of signals each decade.

The Trend Asset Allocation Model is an asset allocation model that applies trend-following principles based on the inputs of global stock and commodity prices. This model has a shorter time horizon and tends to turn over about 4-6 times a year. The performance and full details of a model portfolio based on the out-of-sample signals of the Trend Model can be found here.


My inner trader uses a trading model, which is a blend of price momentum (is the Trend Model becoming more bullish, or bearish?) and overbought/oversold extremes (don't buy if the trend is overbought, and vice versa). Subscribers receive real-time alerts of model changes, and a hypothetical trading record of the email alerts is updated weekly here. The hypothetical trading record of the trading model of the real-time alerts that began in March 2016 is shown below.
 

The latest signals of each model are as follows:

  • Ultimate market timing model: Buy equities (Last changed from “sell” on 28-Jul-2023)*
  • Trend Model signal: Bullish (Last changed from “neutral” on 28-Jul-2023)*
  • Trading model: Neutral (Last changed from “bearish” on 03-Aug-2023)*
* The performance chart and model readings have been delayed by a week out of respect to our paying subscribers.

Update schedule: I generally update model readings on my site on weekends. I am also on Twitter at @humblestudent and on Mastodon at @humblestudent@toot.community. Subscribers receive real-time alerts of trading model changes, and a hypothetical trading record of those email alerts is shown here.

Subscribers can access the latest signal in real time here.


Bullish and bearish on different time horizons

As the S&P 500 violated its 50 dma but reached an oversold condition on the percentage of stocks above their 20 dma, I am bullish and bearish on stocks, depending on the time frame.
  • Due for a Relief Rally: The market is due for a bounce (1–2-week horizon).
  • A Deeper Correction: There may be unfinished business to the downside once the relief rally is complete (3–6-week horizon).
  • Long-term Bullish: The technical structure of market action points to a longer-term bull trend.
 
The full post can be found here.

Saturday, August 19, 2023

What are the contagion effects of a China slowdown?

Periodically, the market is rattled by a “China is slowing” narrative. As the accuracy of official Chinese statistics can be doubtful, the real-time market reaction indicates nervousness, but no panic. The performance of the equity markets of China and her major trading partners relative to MSCI All-Country World Index (ACWI) shows that their trends are all flat to down.


How concerned should investors be about a China slowdown and its contagion effects?

The full post can be found here.

Wednesday, August 16, 2023

Pooised for a rebound

Mid-wek market update: The S&P 500 became extremely stretched in mid-June when its 14-week RSI exceeded the 90 level. The last two times this happened, the market eventually pulled back and the initial decline was arrested with RSI reached a neutral reading of 50. That 50 target was reached this week, which I interpret as the market is setting up for a relief rally.


The full post can be found here.

Sunday, August 13, 2023

Will NASDAQ weakness unravel the bull?

Preface: Explaining our market timing models 
We maintain several market timing models, each with differing time horizons. The "Ultimate Market Timing Model" is a long-term market timing model based on the research outlined in our post, Building the ultimate market timing model. This model tends to generate only a handful of signals each decade.

The Trend Asset Allocation Model is an asset allocation model that applies trend-following principles based on the inputs of global stock and commodity prices. This model has a shorter time horizon and tends to turn over about 4-6 times a year. The performance and full details of a model portfolio based on the out-of-sample signals of the Trend Model can be found here.


My inner trader uses a trading model, which is a blend of price momentum (is the Trend Model becoming more bullish, or bearish?) and overbought/oversold extremes (don't buy if the trend is overbought, and vice versa). Subscribers receive real-time alerts of model changes, and a hypothetical trading record of the email alerts is updated weekly here. The hypothetical trading record of the trading model of the real-time alerts that began in March 2016 is shown below.


The latest signals of each model are as follows:

  • Ultimate market timing model: Buy equities (Last changed from “sell” on 28-Jul-2023)*
  • Trend Model signal: Bullish (Last changed from “neutral” on 28-Jul-2023)*
  • Trading model: Neutral (Last changed from “bearish” on 03-Aug-2023)*
* The performance chart and model readings have been delayed by a week out of respect to our paying subscribers.

Update schedule: I generally update model readings on my site on weekends. I am also on Twitter at @humblestudent and on Mastodon at @humblestudent@toot.community. Subscribers receive real-time alerts of trading model changes, and a hypothetical trading record of those email alerts is shown here.

Subscribers can access the latest signal in real time here.


A weak NASDAQ

Call the Market Police! The NASDAQ Composite has fallen for two consecutive weeks and violated a rising trend line. It seems that the AI-fueled party is over. 


The key question is whether this pullback unravels the equity bull case.
 

The full post can be found here.