Preface: Explaining our market timing models
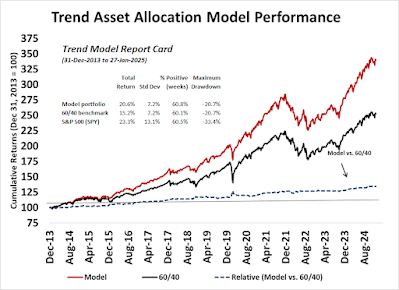
The Trend Asset Allocation Model is an asset allocation model that applies trend-following principles based on the inputs of global stock and commodity prices. This model has a shorter time horizon and tends to turn over about 4-6 times a year. The performance and full details of a model portfolio based on the out-of-sample signals of the Trend Model can be found here.
We maintain several market timing models, each with differing time horizons. The "Ultimate Market Timing Model" is a long-term market timing model based on the research outlined in our post, Building the ultimate market timing model. This model tends to generate only a handful of signals each decade.
The Trend Asset Allocation Model is an asset allocation model that applies trend-following principles based on the inputs of global stock and commodity prices. This model has a shorter time horizon and tends to turn over about 4-6 times a year. The performance and full details of a model portfolio based on the out-of-sample signals of the Trend Model can be found here.
My inner trader uses a trading model, which is a blend of price momentum (is the Trend Model becoming more bullish, or bearish?) and overbought/oversold extremes (don't buy if the trend is overbought, and vice versa). Subscribers receive real-time alerts of model changes, and a hypothetical trading record of the email alerts is updated weekly here. The hypothetical trading record of the trading model of the real-time alerts that began in March 2016 is shown below.
The latest signals of each model are as follows:
- Ultimate market timing model: Buy equities (Last changed from “sell” on 28-Jul-2023)*
- Trend Model signal: Neutral (Last changed from “bullish” on 15-Nov-2024)*
- Trading model: Neutral (Last changed from “bullish” on 17-Jan-2025)*
Update schedule: I generally update model readings on my site on weekends. I am also on X/Twitter at @humblestudent and on BlueSky at @humblestudent.bsky.social. Subscribers receive real-time alerts of trading model changes, and a hypothetical trading record of those email alerts is shown here.
Subscribers can access the latest signal in real time here.
The market’s conclave
The recently released film entitled “Conclave” tells the story of how Vatican cardinals sought to elect a new pope after the death of the old one. The film is focused on the conclave, or the meeting of cardinals, as they are locked up in the Vatican and the political maneuvers of the different factions in electing their candidate. The situation is fluid and emerging leadership is highly uncertain.
That’s where the stock market is today. The large-cap growth old leadership is faltering, and different candidates are vying for the top spot. I use RRG charts to tell the story. Relative Rotation Graphs, or RRG charts, are a way of depicting the changes in leadership in different groups, such as sectors, countries or regions, or market factors. The charts are organized into four quadrants. The typical group rotation pattern occurs in a clockwise fashion. Leading groups (top right) deteriorate to weakening groups (bottom right), which then rotates to lagging groups (bottom left), which changes to improving groups (top left), and finally completes the cycle by improving to leading groups (top right) again.
An analysis of RRG rotation shows that growth sectors, technology, communication services and consumer discretionary, which is dominated by Magnificent Seven giants Amazon and Tesla, are weakening. While technology and communication services remain in the top right leading quadrant, they are likely to fall into the bottom right weakening quadrant in the near future if they follow the normal clockwise rotation pattern.
The contenders for the new leadership are value stocks, consisting of financials, industrials, energy and materials, and defensive stocks, consisting of healthcare, consumer staples, utilities and real estate. A growth to value rotation would mean a bullish and benign internal rotation for stock prices, while the emergence of defensive sectors as market leaders is a signal of a market pullback.
In the meantime, the market is waiting for the white smoke from the market’s conclave that signals which faction won in the end.
The full post can be found here.


No comments:
Post a Comment