Preface: Explaining our market timing models
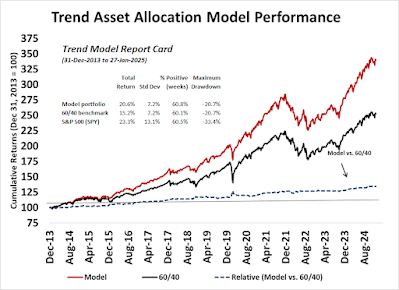
The Trend Asset Allocation Model is an asset allocation model that applies trend-following principles based on the inputs of global stock and commodity prices. This model has a shorter time horizon and tends to turn over about 4-6 times a year. The performance and full details of a model portfolio based on the out-of-sample signals of the Trend Model can be found here.
We maintain several market timing models, each with differing time horizons. The "Ultimate Market Timing Model" is a long-term market timing model based on the research outlined in our post, Building the ultimate market timing model. This model tends to generate only a handful of signals each decade.
The Trend Asset Allocation Model is an asset allocation model that applies trend-following principles based on the inputs of global stock and commodity prices. This model has a shorter time horizon and tends to turn over about 4-6 times a year. The performance and full details of a model portfolio based on the out-of-sample signals of the Trend Model can be found here.
My inner trader uses a trading model, which is a blend of price momentum (is the Trend Model becoming more bullish, or bearish?) and overbought/oversold extremes (don't buy if the trend is overbought, and vice versa). Subscribers receive real-time alerts of model changes, and a hypothetical trading record of the email alerts is updated weekly here. The hypothetical trading record of the trading model of the real-time alerts that began in March 2016 is shown below.
The latest signals of each model are as follows:
- Ultimate market timing model: Buy equities (Last changed from “sell” on 28-Jul-2023)*
- Trend Model signal: Neutral (Last changed from “bullish” on 15-Nov-2024)*
- Trading model: Neutral (Last changed from “bullish” on 17-Jan-2025)*
Update schedule: I generally update model readings on my site on weekends. I am also on X/Twitter at @humblestudent and on BlueSky at @humblestudent.bsky.social. Subscribers receive real-time alerts of trading model changes, and a hypothetical trading record of those email alerts is shown here.
Subscribers can access the latest signal in real time here.
Which index should you believe?
It is said that there is nothing is more bullish than higher prices, but this time may be different. Even as the S&P 500 staged an upside breakout from a wedge formation and it’s on the verge of testing overhead resistance, the equal-weighed S&P 500, which gives higher weight to the smaller stocks in the index, is barely holding at the 50 dma. The mid-cap S&P 400 and the small-cap Russell 2000 are trading below their respective 50 dma.
Which index should you believe? These manifestations of weak breadth makes me nervous that the latest rally may represent a last hurrah for the bulls.
MarketWatch reported that Goldman Sachs strategies Scott Rubner attributed the price strength to a retail buying stampede, but added, “This is the last bullish email that I will send for Q1 2025 as the flow demand dynamics are quickly changing, and we are approaching negative seasonals.”
The full post can be found here.


No comments:
Post a Comment