Showing posts with label ECB. Show all posts

Sunday, July 28, 2019

Is this how a currency war begins?

Preface: Explaining our market timing models
We maintain several market timing models, each with differing time horizons. The "Ultimate Market Timing Model" is a long-term market timing model based on the research outlined in our post, Building the ultimate market timing model. This model tends to generate only a handful of signals each decade.

The Trend Model is an asset allocation model which applies trend following principles based on the inputs of global stock and commodity price. This model has a shorter time horizon and tends to turn over about 4-6 times a year. In essence, it seeks to answer the question, "Is the trend in the global economy expansion (bullish) or contraction (bearish)?"

My inner trader uses a trading model, which is a blend of price momentum (is the Trend Model becoming more bullish, or bearish?) and overbought/oversold extremes (don't buy if the trend is overbought, and vice versa). Subscribers receive real-time alerts of model changes, and a hypothetical trading record of the those email alerts are updated weekly here. The hypothetical trading record of the trading model of the real-time alerts that began in March 2016 is shown below.


The latest signals of each model are as follows:
  • Ultimate market timing model: Buy equities*
  • Trend Model signal: Neutral*
  • Trading model: Bearish*
* The performance chart and model readings have been delayed by a week out of respect to our paying subscribers.

Update schedule: I generally update model readings on my site on weekends and tweet mid-week observations at @humblestudent. Subscribers receive real-time alerts of trading model changes, and a hypothetical trading record of the those email alerts is shown here.


Sleepwalking into a currency war?
As we look ahead to the FOMC meeting next week, it may be the start of a synchronized global easing cycle. The ECB signaled a dovish tone last week at its meeting. The EURUSD exchange rate weakened, and the USD Index strengthened. From a technical perspective, the USD is exhibiting bullish patterns on multiple time frames. The index staged an upside breakout on an inverse head and shoulders formation on the daily chart, with an upside measured upside target of about 99.10. Conversely, EURUSD has broken down in a head and shoulders, with a downside target of about 110.


It is also forming a possible bullish cup and handle pattern on the weekly chart, with an upside target of 107.70 to 108.00 on a breakout.


In addition, the trade weighted USD has also formed a possible cup and handle pattern that stretches back to 2002, with bullish implications.


The global nature of the seemingly coordinated central bank easing begs the question of whether monetary policy is inadvertently starting a cycle of competitive devaluation. Is this how a currency war starts?

We examine this thesis from the viewpoints of the three main currency and trading blocs, Europe, China, and the US.

The full post can be found here.

Monday, July 8, 2019

The limits of central bank powers

With interest rates at or close to the zero lower bound, here are a couple of examples of limits to the power of central bankers.
  • The Federal Reserve: Will it still cut rates after the strong jobs report?
  • The European Central Bank: What are the limits and price of monetary stimulus?


Will the Fed cut rates?
Let us begin with the Fed. After the blow-out Jobs Report, the bond market reacted violently and there were murmurs as to whether the Fed will still cut rates. Let me lay the first concern to rest. Historically, the Fed has telegraphed its interest rate decisions. With the market expectations of at least a quarter-point cut at the next FOMC on July 30-31, the Fed is unlikely to surprise the market.


The full post can be found here.

Wednesday, June 28, 2017

All eyes on policy makers

Mid-week market update: As we wait to see if the stock market can break either up or down out of this narrow trading range, this week has been a light week for major market moving economic data, However, there are a number of political and non-economic developments to keep an eye on.


The full post can be found at our new site here.

Tuesday, April 19, 2016

We are all helicopter pilots now

In Ben Bernanke's famous 2002 helicopter speech, he made the point that the Fed has numerous tools to fight deflation, even if interest rates was at the zero bound:
The U.S. government has a technology, called a printing press (or, today, its electronic equivalent), that allows it to produce as many U.S. dollars as it wishes at essentially no cost. By increasing the number of U.S. dollars in circulation, or even by credibly threatening to do so, the U.S. government can also reduce the value of a dollar in terms of goods and services, which is equivalent to raising the prices in dollars of those goods and services. We conclude that, under a paper-money system, a determined government can always generate higher spending and hence positive inflation.
He went on to say that the coordination of fiscal and monetary policy amounted to a helicopter drop of money:
Each of the policy options I have discussed so far involves the Fed's acting on its own...A money-financed tax cut is essentially equivalent to Milton Friedman's famous "helicopter drop" of money.
In his latest blog post, Bernanke expanded on that point. Monetary policy has limits by itself. Helicopter money is fiscal + monetary policy:
In more prosaic and realistic terms, a “helicopter drop” of money is an expansionary fiscal policy—an increase in public spending or a tax cut—financed by a permanent increase in the money stock. To get away from the fanciful imagery, for the rest of this post I will call such a policy a Money-Financed Fiscal Program, or MFFP.
He concluded that helicopter money is not necessary in the US, but they may be useful tools in other parts of the world:
Money-financed fiscal programs (MFFPs), known colloquially as helicopter drops, are very unlikely to be needed in the United States in the foreseeable future. They also present a number of practical challenges of implementation, including integrating them into operational monetary frameworks and assuring appropriate governance and coordination between the legislature and the central bank. However, under certain extreme circumstances—sharply deficient aggregate demand, exhausted monetary policy, and unwillingness of the legislature to use debt-financed fiscal policies—such programs may be the best available alternative. It would be premature to rule them out.
Consider the Bernanke helicopter money prescription. The government spends by borrowing and the central finances the spending by buying up the debt and printing money. It sounds positively Japanese. Abenomics, anyone?

The full post is available at our new site here.

Wednesday, March 9, 2016

The bulls are winning, but they shouldn't relax

Mid-week market update: On the weekend, I wrote that the stock market was experiencing a bullish breadth thrust and the market is likely to see a series of "good"overbought readings where stock prices either continue to grind up or consolidate sideways as they get overbought (see RIP Correction. Reflationary resurrection next?). So far, so good. The market seems to be behaving according to the script I laid out so far.

As the hourly chart of the SPX shows. The market weakness on Monday and Tuesday were relatively minor. The index saw a minor positive RSI divergence and the 50 hour moving average has so far acted as support.


As well, this chart from IndexIndicators show that the net 20-day highs-lows, which has been a good intermediate term (1-2 week) trading indicator, seems to have found support at a high level. If this continues, it would lend support to the "good"overbought bull case.


While I remain optimistic about the technical underpinnings of the bullish scenario, that`s only half the story.

The full post is at our new site here.


Site Notice
I am happy to announce that the new site is now re-open for new subscribers. We closed our site to new subscribers in January in order to better control the rapid growth of our community. After listening to feedback and making a few tweaks to the site and the content, such as the addition of a mid-week technical update, the site is now re-open for business.

You can subscribe for 1 year (US $249.99), 1 month (US$24.99)  or 1 day (US$4.99);. Even if you are not ready to subscribe, you can always sign up for email notification of free posts as they are free and available to the public two weeks after publication.

As a reminder, here is a sample of some of past posts:

I am reminded of a variation on an old adage:
If you give a man a fish, he'll eat for a day.
If you teach a man how to fish...he'll want to get a boat.
We would love to have you join our community. We stand ready to help you build your own boat. Come over to the new site and take a look.

Monday, September 15, 2014

Time for European small caps to shine?

In addition to waiting for the FOMC and the results of the Scottish Referendum, we will see the first results of the ECB's TLTRO this week. As a reminder, the purpose of the TLTRO program is intended to stimulate lending to eurozone households and non-financials:
In pursuing its price stability mandate, the Governing Council of the ECB has today announced measures to enhance the functioning of the monetary policy transmission mechanism by supporting lending to the real economy. In particular, the Governing Council has decided:

1. To conduct a series of targeted longer-term refinancing operations (TLTROs) aimed at improving bank lending to the euro area non-financial private sector, excluding loans to households for house purchase, over a window of two years.

2. To intensify preparatory work related to outright purchases of asset-backed securities (ABS).
This program should be beneficial to eurozone SME. In that case, why are European small caps underperforming? As the chart below shows, European small caps topped out against large caps (black line) in March and they have been rolling over ever since. This pattern of small cap underperformance is not unique to Europe, as US small caps have exhibited a similar pattern, albeit with a greater magnitude.


As the ECB implements TLTRO, is this an opportunity for European small caps to revive?


Monday, June 2, 2014

Central banking 2.0: Smart bombs over carpet bombs

The global markets are waiting for the ECB to make its announcement on Thursday about what steps it might take to avoid deflation. With deflation creeping into Germany and Markit M-PMI weakening, some sort of action is baked in.


As we wait, I wanted to highlight a trend in central banking to which I have seen little discussion, There has been a subtle shift from the old shock-and-awe quantitative easing approach of carpet bombing the economy with liquidity from 50,000 feet to using a more targeted approach to stimulus. Instead of carpet bombing, central bankers are now trying to find “smart bombs“ to find their targets.

As an example, the BOE and ECB published a joint discussion paper that proposed a broad number of measures to revive the loan securitization market. For more color, the FT recently highlighted Mario Draghi`s comments about trying to stimulate SME lending through securitization (emphasis added):
During the ECB’s forum on central banking which is taking place in the Portuguese town of Sintra, president Mario Draghi took the opportunity to discuss his views on how to breath new life into the eurozone’s market for securitisation.

Mr Draghi reiterated that reviving this market would depend “first and foremost” on relaxing what the ECB sees as overly onerous regulatory rules (more on which here and here).

The ECB hopes restarting securitisation will help spur lending to credit-starved smaller businesses, which Mr Draghi said provide four in every five eurozone jobs.
Draghi went on to justify his reasoning behind the push for more SME stimulus:
The ECB president also supported the Peterson Institute’s Adam Posen, who said this morning that the central bank had to do something to boost lending to SMEs at a time when the financial system was so impaired that such businesses could only borrow at overly punitive rates, if at all.

Impairment of lending to SMEs is an impairment in the transmission of monetary policy,” Mr Draghi said.
Reuters reports a possible advance announcement of an LTRO style program for lending to SME (emphasis added):
The European Central Bank is considering a new long-term liquidity operation available only to banks that agree to use the funding to lend to businesses, a German newspaper reported on Wednesday, citing sources...

But this time, an option under consideration is that the banks would have access to funding via the LTRO only if they agree to pass on the money in loans to industrial, retail and services businesses, Sueddeutsche Zeitung reported on Wednesday.

The Chinese are doing it too
The Chinese are doing it too. Instead of massively expanding the PBoC balance sheet, which the Chinese were masters of in the wake of the global financial crisis, the new leadership is trying a new policy of limited and targeted stimulus. On the weekend, this Bloomberg report indicated that the PBoC is lowering the RRR for certain rural banks:
China said it will cut the reserve requirement ratio for some of the nation’s banks, the government’s latest step to support growth in the world’s second-biggest economy.

Policy makers will “appropriately” lower the reserve requirement for banks that have extended a certain amount of loans to rural borrowers and smaller companies, the cabinet said yesterday after a regular meeting led by Premier Li Keqiang. It didn’t give more details about the reduction. The State Council also pledged to fine-tune policy when needed, while reiterating it will maintain a prudent monetary stance.
Apparently, they did not like the credit bubble creation as a side-effect of the massive stimulus unleashed in the wake of the Lehman Crisis:
The Communist Party is trying to revive the economy without repeating the mistakes of its $586 billion stimulus begun in 2008, which caused a record buildup of debt and inflated property bubbles. President Xi Jinping said this month that the nation needs to adapt to a “new normal” in the pace of growth.
For a more nuanced view, FT Alphaville pointed to a Standard Chartered research report which discussed the possible steps that Beijing might take in order to keep the economy from crashing:
The front page of this morning’s [being the 28th] China Securities News (CSN) makes for fascinating reading. In an editorial, the newspaper – which is overseen by the central bank – lays out ideas for how China might conduct monetary easing. It says that in the future, “the relevant departments might take measures including”:
  • More “re-lending” by the People’s Bank of China (PBoC) to banks, and a possible cut in official re-lending rates
  • “Targeted” RRR cuts, for instance for banks operating in central and western China
  • PBoC buying of bonds issued by the Ministry of Finance, or by entities building railways and social housing
  • Easing of banks’ loan-deposit ratios (LDRs) in some areas
The conclusion:
It appears that China’s powers that be have settled on a strategy of stimulating some parts of the economy and stifling others. A more targeted, if not insignificant, easing is apparently in effect. It may be stating the obvious but it’s always worth remembering that China’s top leaders don’t always agree and even the most powerful have been constrained — Deng Xiaoping had a cautious planner in Chen Yun to constrain him and according to some notes in our inbox what is happening in China is more of a feudal retrenchment than any real reform process. Maybe so. Maybe not.

Does the Fed follow suit?
There are some preliminary signs that the Federal Reserve is starting to seek ways of targeting monetary stimulus, as the entire tapering discussion showed that it is sick and tired of QE and wants to wind down the program.

Janet Yellen provided some hints in a speech on March 31, 2014. While many analysts believed her remarks to be dovish, I read it as a more nuanced interpretation of the US employment picture instead of the more typical academic approach of monitoring statistics, which are mainly averages, without delving into the underlying distribution which led to the averages. In that speech, Yellen pointed to the following sources of slack in the economy:
  • The high number of part-time workers who would like a full-time job;
  • The lack of wage pressure;
  • The high level of long-term unemployed workers; and
  • The falling participation rate, which she interpreted as partly caused by discouraged workers leaving the work force.
Despite her reputation as a dove, Janet Yellen has shown that she is well aware of the dangers of runaway inflation. In a speech on April 11, 2011, she stated:
While I continue to anticipate a gradual economic recovery in the context of price stability, I do recognize that further large and persistent increases in commodity prices could pose significant risks to both inflation and real activity that could necessitate a policy response. The FOMC is determined to ensure that we never again repeat the experience of the late 1960s and 1970s, when the Federal Reserve did not respond forcefully enough to rising inflation and allowed longer-term inflation expectations to drift upward. Consequently, we are paying close attention to the evolution of inflation and inflation expectations.
At this point, I am only speculating, but Yellen's March 31, 2014 speech about the shortfalls of standard employment statistics highlights her concerns about the uneven nature of the economic recovery. A recent Dallas Fed study showed that middle-skill jobs have not recovered as fast as low and high skill jobs, which by implication is leading to a hollowing out of the middle class.


Indeed, Bespoke recently illustrated the bifurcation of the recovery by showing the consumer confidence gap between the well-off and the not so well-off:


In the past few months, we have seen a regime change at the Fed. It's not just the chair, but the level of turnover at the board level. The new vice chair, Stanley Fischer, has shown himself to be both a highly effective and pragmatic central banker (see A new direction at the Yellen Fed).

If the Yellen Fed were to shift from the old carpet bombing QE tactics of flooding the system with liquidity to a more targeted approach of finding “smart bombs“ to achieve their goals, it would indeed be good news. After all, all the other kids on the block are doing it too, why not the Fed?


Cam Hui is a portfolio manager at Qwest Investment Fund Management Ltd. (“Qwest”). The opinions and any recommendations expressed in the blog are those of the author and do not reflect the opinions and recommendations of Qwest. Qwest reviews Mr. Hui’s blog to ensure it is connected with Mr. Hui’s obligation to deal fairly, honestly and in good faith with the blog’s readers.”

None of the information or opinions expressed in this blog constitutes a solicitation for the purchase or sale of any security or other instrument. Nothing in this blog constitutes investment advice and any recommendations that may be contained herein have not been based upon a consideration of the investment objectives, financial situation or particular needs of any specific recipient. Any purchase or sale activity in any securities or other instrument should be based upon your own analysis and conclusions. Past performance is not indicative of future results. Either Qwest or I may hold or control long or short positions in the securities or instruments mentioned.

Thursday, November 7, 2013

The bulls' European refuge

My inner trader has been relatively cautious in the past few weeks on US equities (see A soft November, but wait for the Santa rally), as the technical picture continues to deteriorate. Consider this chart of the relative performance of the Russell 2000 small cap stocks against the large cap SPX. Small caps violated a relative uptrend line and started to roll over, indicating that the bears are gaining the upper hand.


As well, defensive sectors like Consumer Staple stocks are starting to outperform, which is another telltale sign that the risk-off trade is becoming dominant.


The other signs that the risk-on trade is rolling over is everywhere. The chart below shows two measures of the risk-on/risk-off trade. The first is the Tiffany/WalMart pair (in black) and the second is the Consumer Discretionary/Consumer Staple pair (in purple). Both are turning down, indicating that bullish enthusiasm is softening.


Uncertainty over China
Globally, I have also been cautious about China because of the political uncertainties surrounding the Third Plenary this weekend (see What Li Keqiang's 7.2% growth stall speed means and The stakes are rising for China's Third Plenary). There will no doubt be some volatility as we hear the policy announcements as the plenary wraps up early next week.

Given the uncertainties involved, both in the nature and scope of the announcements as well as the likely market reaction, my inclination is to stand aside for now.


Still risk-on in Europe
On the other hand, European equities continue to show signs that the bulls remain in control. Compare and contrast, for example, this chart of the relative performance of European small caps to European large caps to the US chart above. This spells "risk-on" to me!


Also consider other key risk-on/risk-off indicators in Europe. Here is the 10-year chart of the relative performance of Greek stocks (yes, that Greece) to eurozone equities, as measured by the Euro STOXX 50. The long term pattern shows that Greek stocks rallied through a relative downtrend line and they appear to be staging a relative bottom against eurozone stocks. The short term picture, shown by the red arrow, is equally encouraging as Greek stocks continue to outperform in the last few months.


Here is the same 10-year relative performance chart of Spanish stocks against the Euro STOXX 50, which shows a similar relative bottoming pattern.


Here is Italy. While the Italian MIB Index remains in a relative downtrend against the Euro STOXX 50, it is also displaying a similar relative bottoming pattern as Greece and Spain.


Draghi: Whatever it takes...
Despite the equity market's sell-the-news reaction to the ECB rate cut decision, Mario Draghi seemed to be sticking by his "whatever it takes" pledge to rescue the euro and eurozone in his statements (see FT Alphaville's coverage The ECB rate cut: the analyst reaction). The ECB appeared to be relative relaxed over inflationary expectations and open to the prospect of further LTRO programs. You can't get too much more dovish than that.

Financial tail-risk is fast disappearing because of the ECB. Here is the 10-year chart of the relative performance of European financials relative to the market. The technical pattern is similar to the ones seen for the relative performance of other eurozone peripheral markets. Financials have rallied out of a relative downtrend and their performance is starting to turn up.


By contrast, consider this chart of the relative performance of US financials against the SPX. Sure, they bottomed and rallied out of a relative downtrend line and started to outperform. But why is their relative performance starting to roll over again?


Rally not yet overdone
My preliminary conclusion is therefore investors should look towards Europe for their equity commitments as both the short and longer term picture are supportive of further gains. There is the caveat, however, that European equities have rallied a lot and they may be no longer be cheap.

Ed Yardeni addressed this issue with his chart of European forward P/E ratios, which have now recovered to their pre-Lehman Crash levels.


He concluded that there may be further upside because European growth is likely to push earnings upward:
The question is whether there is more upside for the region’s valuation multiples.

I think there might be, but forward earnings, which has been flat-lining since 2011, as I noted yesterday, needs to show some signs of life. That, in turn, requires that European economic indicators show that the region’s economy hasn’t just bottomed, but is actually recovering. The latest batch of these indicators does show a recovery, but a slow-paced one that may already have been discounted by the rebound in valuation multiples.
So there you are. Even for the cautious about stocks, Europe might be a place to hide.


Cam Hui is a portfolio manager at Qwest Investment Fund Management Ltd. (“Qwest”). The opinions and any recommendations expressed in the blog are those of the author and do not reflect the opinions and recommendations of Qwest. Qwest reviews Mr. Hui’s blog to ensure it is connected with Mr. Hui’s obligation to deal fairly, honestly and in good faith with the blog’s readers.”

None of the information or opinions expressed in this blog constitutes a solicitation for the purchase or sale of any security or other instrument. Nothing in this blog constitutes investment advice and any recommendations that may be contained herein have not been based upon a consideration of the investment objectives, financial situation or particular needs of any specific recipient. Any purchase or sale activity in any securities or other instrument should be based upon your own analysis and conclusions. Past performance is not indicative of future results. Either Qwest or I may hold or control long or short positions in the securities or instruments mentioned.

Sunday, June 30, 2013

QE reversal = Ursa Minor

Since 2008, I have seen various analysts criticizing the Fed, ECB and other central banks for their efforts at quantitative easing and other forms of unconventional monetary policy. These policies have been criticized as less than effective. One such analyst is Stephen Roach, formerly of Morgan Stanley:
While the Fed’s first round of quantitative easing helped to end the financial-market turmoil that occurred in the depths of the recent crisis, two subsequent rounds – including the current, open-ended QE3 – have done little to alleviate the lingering pressure on over-extended American consumers. Indeed, household-sector debt is still in excess of 110% of disposable personal income and the personal saving rate remains below 3%, averages that compare unfavorably with the 75% and 7.9% norms that prevailed, respectively, in the final three decades of the twentieth century.
Now that the Fed is hinting that it is thinking of taking its foot off the accelerator, we are now seeing the reversal of some of the effects of QE - and it's sent the markets into convulsions. The intention of all these unconventional policies was to bring down interest rates and push the market into taking more risk. As a result, asset prices have soared and risk premiums have shrunk. Just look at this chart from Zero Hedge:


Now that the Fed is hinting that it is thinking about unwinding these programs, which Fed officials have quick to distinguish between taking the foot off the gas (tapering) and stepping on the brakes (tightening), risk premiums have begun to rise and asset prices have fallen. This chart from Gwyn Davies show that, despite Fed officials communications policy, the market has de facto tightened in spite of Federal Reserve actions:


Consider the effects of this reversal:
  • Treasury bond yields have spiked. The Fed's began with lowering short-term rates, progressed to buying Treasuries further out on the yield curve and finally added agencies to its purchases. Now that the Fed has signaled that it is considering winding down its QE program, Treasury yields have spiked.
  • It has caused carnage in the Eurodollar market. If you hold down short rates and then tell the world that you expect to hold short rates at zero or near zero for a long, long time, it is an invitation to Mr. Market to put on a carry trade - and it did, with leverage. The signal of reversal is causing these carry trades to unwind, the most obvious of which is the "get cheap funding and buy Eurodollar deposits" trade. See Vince Foster's Minyanville article Bernanke's Misfired Shot Heard 'Round the World.
  • Other carry trades like the currency carry trade are being unwound in a disorderly manner.
  • The Fed's implicit encouragement for the market to take risk pushed funds into junk and emerging market bonds. We have seen how investors reached for yield in the last few years, some of that money made its way into lower quality credits like junk bonds and emerging market bonds. In particular, the emerging market bond market has sold off in a frenzy. In addition, it has caused stress in a number of EM currencies as the market has begun to re-calibrate risk premiums.
  • The market's reach for yield likely played a role in China's latest shadow banking bubble and recent liquidity squeeze. Michael Pettis explained the carry trade this way:
Over the last two years, and especially in 2013, mainland corporations with offshore affiliates had been borrowing money abroad, faking trade invoices to import the money disguised as export revenues, and profitably relending it as Chinese yuan. As China receives more dollars from exports and foreign investment than it spends on imports and Chinese investment abroad, the People's Bank of China, the central bank, is forced to buy those excess dollars to maintain the value of the yuan. It does this by borrowing yuan in the domestic markets. But because its borrowing cost is greater than the return it receives when it invests those dollars in low-earning U.S. Treasury bonds, the central bank loses money as its reserves expand. Large companies bringing money into the mainland also force the central bank to expand the domestic money supply when it purchases the inflows, expanding the amount of credit in the system.
In May, however, the authorities began clamping down on the fake trade invoices, causing export revenues to decline. Foreign currency inflows into China dried up, as did the liquidity that had accommodated rapid credit growth. The combination of rapidly rising credit and slower growth in the money supply created enormous liquidity strains within the banking system. This is probably what caused last week's liquidity crunch and this week's market convulsions. 
When Pettis wrote that Chinese companies imported foreign money and engaged in the practice of "profitably relending it as Chinese yuan", he is referring to injections into China's shadow banking system, which is really their subprime market. In a separate note, Izabella Kamanska of FT Alphaville also documented analysis from Deutsche's Bilal Hafeez indicating that the tight USD-CNY relationship was ripe for a carry trade.
  • Tapering talk has devastated the TIPS market. As the market has contemplated the reversal of QE, inflationary expectations have plummeted and so have the price of TIPS. 
  • QE first buoyed commodity prices and now we are seeing the reversal of that trade. Gold and other hard commodities benefited from low and negative real interest rates. Now that we are seeing real interest rates rise (and inflationary expectations fall), commodity prices are getting hammered.
  • Tapering talk has also implicitly hurt Europe. The ECB has been able to stabilize the eurozone with Draghi's "whatever it takes" remark and the unveiling of its OMT program, which has not been activated yet. Yield spreads of peripheral countries' bonds against Bunds have narrowed because of the ECB's threat of action, along with the flood of global liquidity. Now that the flood of global liquidity is starting to recede, the ECB may actually have to resort to OMT, which would cause another round of euro-angst and more risk premium re-calibration.
I've probably forgotten or missed out on some other side effects of the various rounds of Fed QE, but you get the idea. Many of these bets were leveraged bets as they were designed to help banks profit and repair their balance sheets, e.g. the Eurodollar carry trade. When these trades unwind, the effects will not a blip, but a tsunami.

All these macro effects are suggesting that we are at the start of a risk re-pricing process that will take months to complete. It will not be friendly to asset prices at all.


Earnings headwinds
In the US, stock prices are starting to face headwinds from a deteriorating earnings outlook. Ed Yardeni documented that while Street earnings estimates continue to rise, forward sales estimates are falling. How long can this divergence continue? Can margins continue to rise?

One way of boosting earnings per share while the sales outlook is punk is to buy back shares. If you reduce the denominator (shares outstanding), earnings can rise (everything else being equal). Bloomberg reported that the level of share buybacks are so high that corporate quality is deteriorating [emphasis added]:

“The trend of improving credit quality has slowed as profits are slowing,” Ben Garber, an economist at Moody’s Analytics in New York, said in a telephone interview. “As the recovery matures, companies are liable to get more aggressive in taking on share buybacks and dividends.”
Rather than using cash to pay down debt, companies in the S+P 500 Index are attempting to boost their share prices by buying back almost $700 billion of stock this year, approaching the 2007 record of $731 billion, said Rob Leiphart, an analyst at equity researcher Birinyi Associates in Westport, Connecticut.

Borrowers controlled by buyout firms are on pace to raise more than $72.7 billion this year through dividends financed by bank loans, surpassing last year’s record of $48.8 billion, according to S+P Capital IQ Leveraged Commentary & Data.

After cutting expenses as much as they could to improve profitability, companies “will need to see further revenue growth to boost earnings from here,” Anthony Valeri, a market strategist in San Diego with LPL Financial Corp., which oversees $350 billion, said in a telephone interview.

The good news: Ursa Minor
All these factors add up to bad news for the stock market. The good news is that any pullback is likely to be relatively minor and the possibility of a market crash is remote. The Fed has made it clear that it continues to be "data sensitive" and will adjust policy as necessary.

Translation: The Bernanke Put still lives.


Relief rally: Mind the gap(s)
My inner investor has already pulled back to a position of defensiveness. My inner trader, on the other hand, is watching the relief rally for an entry point on the short side. I am indebted to Tim Knight for his idea of watching the charts of HYG, JNK and MUB to watch for rallies up to fill the downside gaps. The theory is that stocks often see trading gaps filled after a price reversal, just as we are seeing now. After that, the down trend would continue. Tim Knight put it more colorfully than I ever could:
There are three ETFs I am watching very closely for gap closes. My motivation is twofold: first, I want to short the everloving bejesus out of them once the gaps are filled, and second, it’s going to be my signal to go balls-out shorting the equities in general.
As I write these words, the gaps in HYG, JNK and MUB have been filled. However, my inner trader is not ready to short "the everloving bejesus" out of this market yet. He is more inclined to pivot from a pure US-centric view to a more global macro view of the world and he is watching how the gaps in the ETFs of some of the aforementioned sectors that were affected by the Fed's QE actions are resolving themselves.

Consider TLT, the long Treasury ETF, which has not rallied sufficiently to fill the (tinted) gap:


DBV, which is the ETF representing the currency carry trade, has seen its gap filled.


The emerging market ETFs have had their gaps either filled or mostly filled. Here is the chart for EM bonds (EMB):


Here is EM equities (EEM):


Here is China (FXI), which has been a focus of the markets in the past couple of weeks:


Commodity ETFs, however, aren't performing that well and they continue to be in a downtrend without rallying to fill their gaps. Here is DBC, as a representative of the entire commodity complex. DBC violated a key support level and continues to weaken. It has seen no rally attempt to fill in its gap.


Gold (GLD) is one of the ugliest charts of all. Note, however, how it rallied back in April and May to fill in the gap (shown in green) but it continues to weaken and has shown two gaps (in yellow) that have yet to been filled in a relief rally.


The currencies of commodity-linked economies are behaving badly. Here is the Aussie Dollar:


Here is the Canadian Dollar, which is continue to decline with an unfilled gap:


What about Europe? The chart of FEZ representing eurozone equities below shows that while we have seen a minor relief rally, eurozone equities have not rallied up to fill its gap.


Here's the score. Sectors with filled gaps: 3; unfilled gaps: 2. My inner trader's conclusion is that the relief rally isn't quite finished yet. We are likely to see several weeks of volatility before the process is complete before the longer term fundamentals of the recalibration of risk premiums pushes asset prices lower.


Cam Hui is a portfolio manager at Qwest Investment Fund Management Ltd. ("Qwest"). This article is prepared by Mr. Hui as an outside business activity. As such, Qwest does not review or approve materials presented herein. The opinions and any recommendations expressed in this blog are those of the author and do not reflect the opinions or recommendations of Qwest.

None of the information or opinions expressed in this blog constitutes a solicitation for the purchase or sale of any security or other instrument. Nothing in this article constitutes investment advice and any recommendations that may be contained herein have not been based upon a consideration of the investment objectives, financial situation or particular needs of any specific recipient. Any purchase or sale activity in any securities or other instrument should be based upon your own analysis and conclusions. Past performance is not indicative of future results. Either Qwest or Mr. Hui may hold or control long or short positions in the securities or instruments mentioned.

Tuesday, January 8, 2013

No free lunch for central bankers

I got a fair amount of feedback from my post From anti-inflation to pro-inflation, where I described the journey that central bankers have taken from 1980 and the height of the Paul Volcker's tight monetary policy era. In the post-Lehman Crisis period, central bankers have changed their focus from fighting inflation to encouraging a little inflation, from monitoring money growth to loose monetary policy, quantitative easing, nominal GDP targeting and, finally, the loss of central bank independence coordination of monetary policy with fiscal authorities.

With the news that the new government is about to launch 12T Yen (USD 136 billion) fiscal stimulus program and the BoJ appearing to acquieces and support the stimulus with more bond buying, Japan is the country that has gone furthest down this road.


The market effects of the Bernanke and Draghi Put
I want to address in this post the likely effects of this shift in central bank thinking on market prices. In the wake of the near-death experience of the Lehman Crisis of 2008, central bankers have taken steps to put a floor on the price of financial assets. Market analysts have called this the Bernanke Put, as applied to the Federal Reserve, and the Draghi Put, as applied to the European Central Bank. These central bank Puts function like an insurance policy with a deductible. Investors assume some degree of risk, the deductible, but if the macro-economic situation deteriorates to the extent that a market crash is likely, major global central banks have they will step in to rescue the markets.

These insurance policies come with costs. To explain, standard financial theory posits that asset returns follow a bell-shaped distribution. The graph below shows an idealized Gaussian distribution with the returns plotted on the x-axis and frequency, or probability, of those returns on the y-axis. (Yes I know it's not normally distributed but has fatter tails, but it is still a bell-shaped curve.) But what happens to the return distribution when central bankers try to eliminate or reduce the left tail of the return distribution?


Trading Eurogeddon for lower growth
In Europe, where the ECB’s actions have been combined with a fiscal policy of “all austerity, all the time” and a social consensus that is tilted towards a relatively robust safety net, the ECB has traded off the certainty of a no Eurogeddon scenario against lower growth, as depicted by the idealized graph on the below. Note how the expected return distribution is no longer symmetrical as the left tail has been cut off. The “mode”, or the value that is likely to appear the most, is also skewed to the left.


The risk of a eurozone sovereign or banking crisis is off the table, but Europe is in recession. While the actions of the ECB has bought time for EU member states to move toward structural reform, the price paid is lower growth in the short-term.

Trading tail-risk for greater volatility
In addition, I believe that the actions of global central bankers have made the markets more volatile in the short-term. The FX team at Bank of America/Merrill Lynch (BoAML) (via FT Alphaville) observed that volatility in the euro-US Dollar exchange rate has risen dramatically in the past few years, as shown by the graph below.


The BoAML FX team observed that markets movements are now far more sensitive to policy decisions and headline news [emphasis added]:

It is perhaps somewhat counter-intuitive, as low volatility has traditionally been associated with low uncertainty, but we are still seeing high levels of uncertainty in FX. This is understandable given the large number of risks across multiple regions (for example, Eurozone financial crisis, weak US growth, US fiscal cliff and China slowdown). Further, these types of risks leave investors tracking policy makers and trading news headlines for policy trajectory information. This is resulting in sudden and rapid moves in FX followed by periods of range-trading.
By eliminating tail risk and raising certainty, central bankers have ironically raised short-term volatility instead.

In conclusion, central bankers can't completely eliminate volatility and their policies come with costs. In the case of Europe, the ECB has traded Eurogeddon for a recession. In general, market volatility has risen and become far more sensitive to headline news.

It just goes to show that there is no free lunch in central banking.


Cam Hui is a portfolio manager at Qwest Investment Fund Management Ltd. ("Qwest"). This article is prepared by Mr. Hui as an outside business activity. As such, Qwest does not review or approve materials presented herein. The opinions and any recommendations expressed in this blog are those of the author and do not reflect the opinions or recommendations of Qwest.


None of the information or opinions expressed in this blog constitutes a solicitation for the purchase or sale of any security or other instrument. Nothing in this article constitutes investment advice and any recommendations that may be contained herein have not been based upon a consideration of the investment objectives, financial situation or particular needs of any specific recipient. Any purchase or sale activity in any securities or other instrument should be based upon your own analysis and conclusions. Past performance is not indicative of future results. Either Qwest or Mr. Hui may hold or control long or short positions in the securities or instruments mentioned.

Friday, September 28, 2012

Could the Spanish protests be bullish?

On Wednesday, the news of protests and clashes with police in Spain and Greece spooked the markets and we saw a solid risk-off day. The protests, it was assumed, were a sign of popular unrest (true) and an indication that the governments of the day would be hard press to implement the harsh austerity measures demanded by the Troika.

Rather than seeing the glass as half empty, I think that it would be useful to think how this glass is half full. At about the same time, Spanish prime minister told the Wall Street Journal that he was eyeing the conditions for a bailout, but if bond yields were to tick up on a sustainable basis, there was no question that he would have no choice but to ask for the bailout:
Asked whether his government would apply for a bailout, Mr. Rajoy said, "At the moment, I cannot tell you." He said the government would need to determine whether conditions attached to the bailout are "reasonable."

He added, however, that if interest rates on Spain's debt were "too high for too long," thus harming the economy and raising the government's debt burden, "I can assure you 100% that I would ask for this bailout."
In other words, he is still negotiating with northern Europe. Given that the ECB's announcement of OMT has driven down bond yields, he is under little pressure to yield to the ECB's "conditionality", which would be draconian.
On the other hand, bad news is good news. The news of the protests and riots spooked the markets and could give the market what it wants, i.e. a bailout request. Indeed, , the Spanish 10-year yields tick up to the 6% mark on Wednesday (which is a level that is judged to be unsustainably high), though it did stage a minor retreat on Thursday.


At the about same time, the Spanish cabinet unveiled an austerity budget with numerous cuts demanded by the Troika and Bloomberg report that the budget may be enough to satisfy bailout conditions:
Spain’s plan “responds to country-specific recommendations and goes even beyond them in some areas,” European Union Economic and Monetary Affairs Commissioner Olli Rehn said in an e-mail sent while the ministers were speaking.

There are hints that it may be enough if and when the government goes cap in hand to the ESM:
The steps may be enough to ease demands creditor countries such as Germany and the Netherlands would make in exchange for a financial lifeline. The government won’t decide whether to request aid until it has all the relevant information available and has had time to study it, [Economy Minister] de Guindos said.

Reading between the lines, further protests that elevate the yield on Spanish paper is good news, not bad news because it will give the market what it wants.         Cam Hui is a portfolio manager at Qwest Investment Fund Management Ltd. ("Qwest"). This article is prepared by Mr. Hui as an outside business activity. As such, Qwest does not review or approve materials presented herein. The opinions and any recommendations expressed in this blog are those of the author and do not reflect the opinions or recommendations of Qwest.  

None of the information or opinions expressed in this blog constitutes a solicitation for the purchase or sale of any security or other instrument. Nothing in this article constitutes investment advice and any recommendations that may be contained herein have not been based upon a consideration of the investment objectives, financial situation or particular needs of any specific recipient. Any purchase or sale activity in any securities or other instrument should be based upon your own analysis and conclusions. Past performance is not indicative of future results. Either Qwest or Mr. Hui may hold or control long or short positions in the securities or instruments mentioned.

Monday, September 24, 2012

Not time to get nervous (yet)

I see that there has been a certain amount of hand wringing about the poor performance of the Dow Jones Transportation Average (see example here):
According to the basic version of this theory, if the Dow Jones Transport Average fails to confirm the strength of the Dow Jones Industrial Average, the market is headed for a correction. Industrials hit a fresh high Sept. 14 of 13,682 points. Dow transport stocks not only failed to confirm the gain, they lurched decidedly lower.


A tour around the world In isolation, the failure of the Transports to confirm the advance is a cause for concern, but a tour around the world shows that major averages are in solid uptrends. In certain cases, the advance may have gone too far too fast and some gaps may need to get filled in on a pullback. Let's start in the United States with the SPX. This is as solid an uptrend as ever and it is holding up above the key breakout level.    
  Across the pond, the FTSE 100 is showing a similar pattern of being in an uptrend.  
  The same goes for the STOXX 600, representing European stocks.  
  In Hong Kong, the Hang Seng Index is nearing the top end of an upchannel. The QE3 inspired rally produced a gap, which the index needs to pull back and fill.  
  South Korea's KOSPI is showing a similar pattern of a upside gap that may need to get filled. Otherwise, the intermediate term outlook also looks bullish.    
  The BRIC markets generally appear to be constructive. Brazil is in the middle of an upchannel and uptrend.    
  The same could be said of Russia.  
  India's stock market, which had been the source of some investor concern, has also rallied and is displaying the familiar pattern of being at the top end of an upchannel. It does, however, have the upside gap shown by some other markets.  
   The only exception is China's Shanghai Composite, which is in a downtrend.


What about inter-market analysis? Take a look at 10-year Treasury yields. They have stopped falling and they appear to be rising, which is signaling the end of the risk-off trade and the start of the risk-on trade that is equity-bullish.


Cyclically sensitive Dr. Copper has staged an upside breakout, though it does slightly over-extended and it is at risk of a near-term pullback.


Take a ride on the QE train
I wrote before that we are at the start of a global QE-induced rally by central bankers around the world (see Party on (but watch out for the cops)). This chart from dshort.com shows how stocks, bond yields and Fed Funds rates have responded to past episodes of quantitative easing. I also annotated (in red circles) the dates of recent ECB actions. If the past is any guide, then this stock market rally should have legs for a few more months.


Sentiment models supportive of more upside
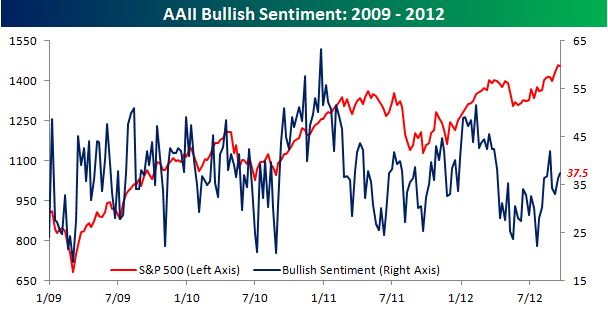
What's more, the latest sentiment survey figures from AAII (via Bespoke) shows that while investor sentiment has gotten more bullish, readings are not at crowded long extremes.


I would also like to address the point from the Pragmatic Capitalism posting, which pointed out Mike Santoli's piece in Barrons highlighting insider selling and the excessive bullishness among newsletter writers as signs to be worried about. While I would be concerned excessive selling by insiders, i.e. the smart money, insiders have not always perfect at timing the market. As for the opinion of newsletter writers, I would argue that their excessive bullishness is actually bullish in this case as they provide buying power for the market. This is a case of watching what they do and not what they say. Anecdotal evidence from trading indicates that institutions and hedge funds have too little beta and they are in the process of beta chasing. BoAML strategist Savita Subramanian pointed out that Sell-Side Strategists were still extremely bearish on equities at the end of August:
The Sell Side Indicator, our measure of Wall Street bullishness on stocks, ticked up slightly in August for the first time in six months. However, this month’s improvement of 0.6ppt lifted the indicator to just 44.4, still at the lowest level in the history of our data (since 1985) apart from last month’s low of 43.9. This suggests that sell side strategists’ bearishness on equities remains at 27 year extremes. Given the contrarian nature of this indicator, we are encouraged by Wall Street’s lack of optimism and the fact that strategists are recommending that investors significantly underweight equities at 44.4% vs. a traditional long-term average benchmark weighting of 60-65%. The indicator remains firmly in “Buy” territory, a signal that it first flashed in May. Recall that we adjusted our Buy and Sell thresholds in November in an attempt to better incorporate secular shifts in equity sentiment.
Their positioning can be regarded as a proxy for how institutional portfolios are positioned. When these guys start to turn around, there is a lot of money to move markets around. Such a turn from a position of extreme bearishness tends to lead to short-term overbought conditions and excessive bullish sentiment model readings.


The fiscal cliff a non-issue?
The storm clouds are clearing, one by one. The ECB and Fed have taken tail risk off the table for now. Even the much feared fiscal cliff may not be a problem. The Washington Post reported last week that the Republican Senate's leadership conceded that they may have to compromise on taxes should Obama win the election:
Senior Republicans say they will be forced to retreat on taxes if President Obama wins a second term in November, clearing the biggest obstacle to a deal with Democrats to defuse a year-end budget bomb that threatens to rock the U.S. economy.

Republicans have long resisted tax increases of any kind. But taxes are a major battleground in the campaign between Obama and Republican Mitt Romney, Capitol Hill veterans say, and the victor will be able to claim a mandate for his policies.

“This is a referendum on taxes,” said Rep. Tom Cole (R-Okla.), a senior member of the House Budget Committee. “If the president wins reelection, taxes are going up” for the nation’s wealthiest households, and “there’s not a lot we can do about that.”
The weight of the evidence suggests that the path of least resistance remains up. While there are a couple of negatives, such as excessive insider selling and the poor performance of the Shanghai Composite, a tour around the world show powerful upside momentum in global equities, supported by a friendly macro environment and institutional buying.

Party on! It's not time to get nervous (yet).


Cam Hui is a portfolio manager at Qwest Investment Fund Management Ltd. ("Qwest"). This article is prepared by Mr. Hui as an outside business activity. As such, Qwest does not review or approve materials presented herein. The opinions and any recommendations expressed in this blog are those of the author and do not reflect the opinions or recommendations of Qwest.

None of the information or opinions expressed in this blog constitutes a solicitation for the purchase or sale of any security or other instrument. Nothing in this article constitutes investment advice and any recommendations that may be contained herein have not been based upon a consideration of the investment objectives, financial situation or particular needs of any specific recipient. Any purchase or sale activity in any securities or other instrument should be based upon your own analysis and conclusions. Past performance is not indicative of future results. Either Qwest or Mr. Hui may hold or control long or short positions in the securities or instruments mentioned.