We maintain several market timing models, each with differing time horizons. The "Ultimate Market Timing Model" is a long-term market timing model based on the research outlined in our post, Building the ultimate market timing model. This model tends to generate only a handful of signals each decade.
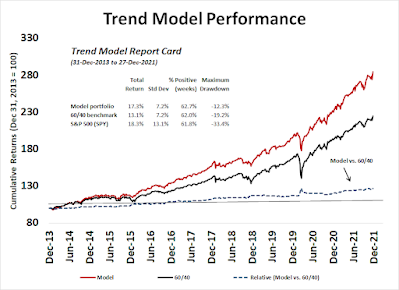
The Trend Asset Allocation Model is an asset allocation model that applies trend following principles based on the inputs of global stock and commodity price. This model has a shorter time horizon and tends to turn over about 4-6 times a year. The performance and full details of a model portfolio based on the out-of-sample signals of the Trend Model can bsoe found here.
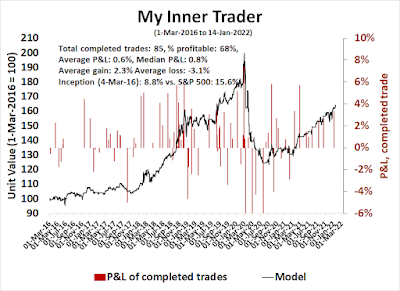
My inner trader uses a trading model, which is a blend of price momentum (is the Trend Model becoming more bullish, or bearish?) and overbought/oversold extremes (don't buy if the trend is overbought, and vice versa). Subscribers receive real-time alerts of model changes, and a hypothetical trading record of the email alerts is updated weekly here. The hypothetical trading record of the trading model of the real-time alerts that began in March 2016 is shown below.
The latest signals of each model are as follows:
- Ultimate market timing model: Buy equities*
- Trend Model signal: Bullish*
- Trading model: Neutral*
Update schedule: I generally update model readings on my site on weekends and tweet mid-week observations at @humblestudent. Subscribers receive real-time alerts of trading model changes, and a hypothetical trading record of those email alerts is shown here.
Subscribers can access the latest signal in real-time here.
Fun with Japanese candlesticks
Last week's market action in the S&P 500 was a classic lesson in the usefulness of Japanese candlesticks. I wrote last weekend that the market was oversold and due for a rebound. The S&P 500 cooperated on Monday by exhibiting a hammer candle, in which the market tanks but rallied to a level equal to or above the open. Hammer candles are indications of capitulation selling and a possible short-term bottom, but the pattern needs to be confirmed by continued strength the next day. The bottom was confirmed Tuesday when the index advanced and regained the 50 dma.
The second candlestick lesson came on Wednesday, when the S&P 500 showed a doji, when the open and closing levels are about the same. Doji candles are signs of indecision and possible reversals but must be confirmed the next day. The S&P 500 duly weakened Thursday and stabilized Friday ahead of the long weekend. All of this is occurring as the S&P 500 forms a triangle, which suggests that a big move is just around the corner.
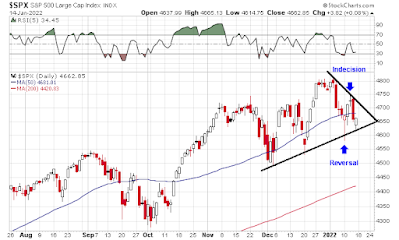
In short, it was a master class in trading Japanese candlestick patterns. Not all candlesticks resolve in textbook manners, but they did last week.
The full post can be found here.
No comments:
Post a Comment