We maintain several market timing models, each with differing time horizons. The "Ultimate Market Timing Model" is a long-term market timing model based on the research outlined in our post, Building the ultimate market timing model. This model tends to generate only a handful of signals each decade.
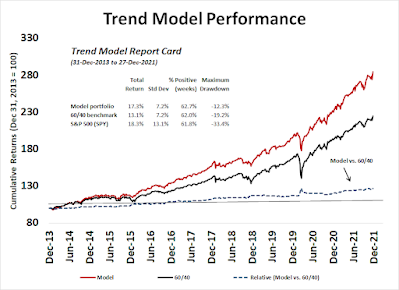
The Trend Asset Allocation Model is an asset allocation model that applies trend following principles based on the inputs of global stock and commodity price. This model has a shorter time horizon and tends to turn over about 4-6 times a year. The performance and full details of a model portfolio based on the out-of-sample signals of the Trend Model can be found here.
My inner trader uses a trading model, which is a blend of price momentum (is the Trend Model becoming more bullish, or bearish?) and overbought/oversold extremes (don't buy if the trend is overbought, and vice versa). Subscribers receive real-time alerts of model changes, and a hypothetical trading record of the email alerts is updated weekly here. The hypothetical trading record of the trading model of the real-time alerts that began in March 2016 is shown below.

The latest signals of each model are as follows:
- Ultimate market timing model: Buy equities*
- Trend Model signal: Bullish*
- Trading model: Bullish*
Update schedule: I generally update model readings on my site on weekends and tweet mid-week observations at @humblestudent. Subscribers receive real-time alerts of trading model changes, and a hypothetical trading record of those email alerts is shown here.
Subscribers can access the latest signal in real-time here.
No sell signal yet
The S&P 500 took fright last week when the December FOMC minutes revealed a hawkish pivot and the stock market sold off. While I have become more cautious in the past few weeks, technical indicators have not flashed any intermediate-term sell signals just yet.
As an example, the NYSE McClellan Summation Index (NYSI) is only recycling from an oversold condition. In the last 20 years, few instances have resolved in a bearish manner (red vertical lines) and most have seen the market advance (black lines).

The market is increasingly vulnerable to a setback, but there is no need to become overly bearish just yet. Traders should wait for a sell signal first.
The full post can be found here.
No comments:
Post a Comment