Wednesday, November 23, 2016

Trend vs. counter-trend: Who wins?

Mid-week market update: Traders who rely on technical signals use two main kinds of trading systems. They either rely on trends or counter-trend signals. Trending systems capitalizes on spotting a bandwagon and jumping on it before the crowd to ride it to profit. By contrast, counter-trends systems depend on finding market extremes and positioning for the pending reversal.

The market is currently strongly trending and staged important breakout to new highs. However, it is also stretched on a number of measures and this condition is occurring in a number of asset classes. An inter-market analysis suggests that the markets are poised to either pause or correct their strong moves.

Let me show you a couple of examples.

The full post can be found at our new site here.


Announcing our Black Friday/Anniversary promotion!
We are making a limited number of discounted annual subscriptions available at a price of US$199.99, which is US$50 off the regular price of US$249.99, for the first year. This offer is open to the first 100 subscribers, or until December 15, 2016, whichever comes first. Click on this link to subscribe and use the code anniversary2016 at checkout to get the discount.

Hurry before they're all gone!

Monday, November 21, 2016

The Italian referendum = Next populist domino?

Ian Bremmer of the Eurasia Group recently tweeted the following political calendar in Europe. After the surprising Trump win, the market is closely watching for electoral surprises. Next up is the Italian referendum on December 4, 2016, in which PM Matteo Renzi has asked for revisions to the constitution in order to break the endless cycle of deadlocked and changing governments. Italy has seen over 60 governments since the Second World War. Austria will also hold its presidential election on December 4, in which far-right candidate Norbert Hofer is leading in the polls. The results are mitigated by the largely ceremonial nature of the presidential post.

The Italian referendum and Austrian vote will be followed by an election in the Netherlands, in which anti-EU Freedom Party led by Geert Wilders is leading in the polls. The French presidential election will be held in the summer, where the anti-establishment candidate Marine Le Pen is expected to poll second heading into the run-off race. Finally, Germany will hold its election in late 2017.


The full post can be found at our new site here.


Announcing our Black Friday/Anniversary promotion!
We are making a limited number of discounted annual subscriptions available at a price of US$199.99, which is US$50 off the regular price of US$249.99, for the first year. This offer is open to the first 100 subscribers, or until December 15, 2016, whichever comes first. Click on this link to subscribe and use the code anniversary2016 at checkout to get the discount.

Hurry before they're all gone!

Sunday, November 20, 2016

Going on recession watch, but don't panic

Preface: Explaining our market timing models
We maintain several market timing models, each with differing time horizons. The "Ultimate Market Timing Model" is a long-term market timing model based on the research outlined in our post, Building the ultimate market timing model. This model tends to generate only a handful of signals each decade.

The Trend Model is an asset allocation model which applies trend following principles based on the inputs of global stock and commodity price. This model has a shorter time horizon and tends to turn over about 4-6 times a year. In essence, it seeks to answer the question, "Is the trend in the global economy expansion (bullish) or contraction (bearish)?"

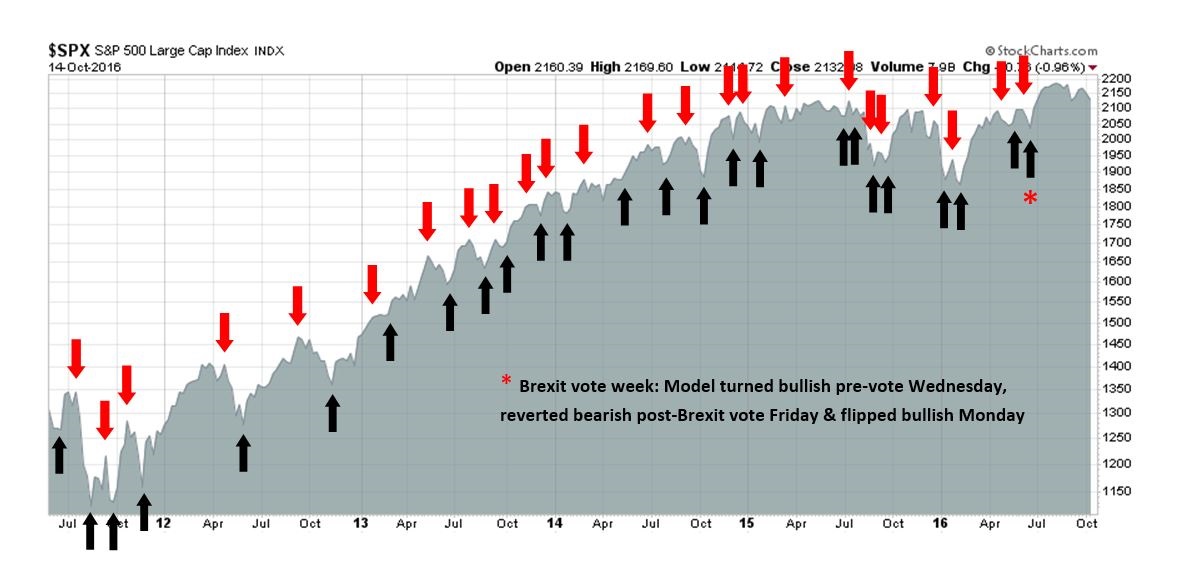
My inner trader uses the trading component of the Trend Model to look for changes in direction of the main Trend Model signal. A bullish Trend Model signal that gets less bullish is a trading "sell" signal. Conversely, a bearish Trend Model signal that gets less bearish is a trading "buy" signal. The history of actual out-of-sample (not backtested) signals of the trading model are shown by the arrows in the chart below. Past trading of the trading model has shown turnover rates of about 200% per month.


The latest signals of each model are as follows:
  • Ultimate market timing model: Buy equities*
  • Trend Model signal: Risk-on*
  • Trading model: Bullish*
The performance chart and model readings have been delayed by a week out of respect to our paying subscribers.

Update schedule: I generally update model readings on my site on weekends and tweet mid-week observations at @humblestudent. Subscribers will also receive email notices of any changes in my trading portfolio.


Dark clouds on the horizon
Regular readers know that I have been bullish on stocks for much of this year, but I am now going on "recession watch". Josh Brown agrees. He tweeted the following last Thursday:


While Brown may have gone on "recession watch" for contrarian reasons, I am on "recession watch" because of a deterioration in macro data. But don't panic. A "recession watch" is emphatically not a forecast of an impending slowdown, nor is it a forecast of an imminent bear market. Macro readings are starting to look a little wobbly and therefore some caution may be warranted. The scenario that I outlined before of a cyclical top in 2017 is playing itself out (see Roadmap to a 2017 market top).

The chart below shows Goldman Sachs' depiction of US recession risk. While I don`t necessarily agree with Goldman`s probability estimates, I do agree that risks are rising but they are not at levels that warrant a full-scale defensive portfolio position (annotations in red are mine).


This week, I would like to expand on the threats that faces the US and global economies, and by implication the stock market.  I would further point out that the data began to deteriorate before the election and my change in view has little to do with the electoral results. Only one of the Trump proposals have an unexpected side-effect of exacerbating the downside vulnerability of the global economy in a downturn, but that effect is relatively minor.

The full post can be found at our new site here.


Tuesday, November 15, 2016

Don't worry about bad breadth, NYSE edition

I have been seeing analysis from various quarters raising concerns about the sustainability of the post-election stock market advance because of the poor breadth of the market. The chart below shows the NYSE A-D Line overlaid on top of the SP 500. As you can see from the chart, the NYSE A-D Line has been lagging even as the market advanced. If the generals (large caps) are leading the charge, but the troops (breadth) are not following, then such divergences are thought to be warning signs that the move may not be sustainable.


I would not be so worried about that. The NYSE Composite is made up of many closed-end bond funds and REITs which have dragged down the performance of that index. We can see a hint of that effect in TRIN (top panel). There were two days in the post-election rally when TRIN fell below 0.50, which is an indication that advancing volume was running well ahead of advancing issues. That`s because many of the declining issues were relatively thinly traded interest sensitive bond funds and REITs.

While I am not worried about a negative breadth divergence, the sudden turnaround in bullish sentiment is a concern to me.

The full post can be found at our new site here.

Monday, November 14, 2016

Trump vs. the Fed: War or détente?

In many ways, Donald Trump is an economic enigma. Candidate Trump has in the past advocated wildly contradictory positions on the campaign trail. Sometime the market is left not knowing what to think.

One little discussed topic but important topic is Trump's relationship with the Federal Reserve. What kind of Fed would he like to see?

Candidate Trump assailed the Fed in September 2016 for keep rates too low (via Reuters):
Republican presidential nominee Donald Trump, who has previously accused the Federal Reserve of keeping interest rates low to help President Barack Obama, said on Monday that the U.S. central bank has created a “false economy” and that interest rates should change.

“They’re keeping the rates down so that everything else doesn’t go down,” Trump said in response to a reporter’s request to address a potential rate hike by the Federal Reserve in September. “We have a very false economy,” he said.

“At some point the rates are going to have to change,” Trump, who was campaigning in Ohio on Monday, added. “The only thing that is strong is the artificial stock market,” he said.
An easy monetary policy helped the incumbent party by stimulating growth. When he becomes President Trump in January, does he still want the Fed to take a more hawkish approach to monetary policy?


The full post can be found at our new site here.

Sunday, November 13, 2016

The Trump presidency: A glass half-full

Preface: Explaining our market timing models
We maintain several market timing models, each with differing time horizons. The "Ultimate Market Timing Model" is a long-term market timing model based on the research outlined in our post, Building the ultimate market timing model. This model tends to generate only a handful of signals each decade.

The Trend Model is an asset allocation model which applies trend following principles based on the inputs of global stock and commodity price. This model has a shorter time horizon and tends to turn over about 4-6 times a year. In essence, it seeks to answer the question, "Is the trend in the global economy expansion (bullish) or contraction (bearish)?"

My inner trader uses the trading component of the Trend Model to look for changes in direction of the main Trend Model signal. A bullish Trend Model signal that gets less bullish is a trading "sell" signal. Conversely, a bearish Trend Model signal that gets less bearish is a trading "buy" signal. The history of actual out-of-sample (not backtested) signals of the trading model are shown by the arrows in the chart below. Past trading of the trading model has shown turnover rates of about 200% per month.


The latest signals of each model are as follows:
  • Ultimate market timing model: Buy equities*
  • Trend Model signal: Risk-on*
  • Trading model: Bullish*
The performance chart and model readings have been delayed by a week out of respect to our paying subscribers.

Update schedule: I generally update model readings on my site on weekends and tweet any changes during the week at @humblestudent. Subscribers will also receive email notices of any changes in my trading portfolio.


A glass half-full, with caveats
Last week, I urged readers to be agnostic about the electoral outcome and to stay focus on the investment climate instead (see Don't be fooled, Election 2016 isn't the Brexit referendum):

It would be too easy to get into an impotent rage should your favored candidate lose, or if policy doesn't go in your desired direction. That kind of thinking clouds judgment and leads to subpar investment results.

Stock prices are a function of earnings, the growth outlook, interest rates, and risk premium. There is much we don't know about policy details under a Trump administration, but the market's judgment of the election oscillated from unbridled panic on to euphoria in less than 24 hours. The fast money crowd jumped into the risk-on momentum trade last week. Based on historical studies, the rally has the legs to go much further. Here is a study from Nautilus Capital, which indicates that the returns after election day is indicative of momentum for the next 3-6 months (n=30):


Ned Davis Research also pointed out that the combination of a Republican president and Republican Congress have enjoyed the second best returns (caution, n=3):


The stock market embraced the reflation investment thesis that I have been writing about for several months, except this time it`s reflation on steroids (also see Super Tuesday special: How President Trump could spark a market blow-off). As there are many blanks that still to get filled in about the new administration, it's important to be aware of the bull case and bear case for stocks.

The full post can be found at our new site here.

Wednesday, November 9, 2016

The market has spoken!

Mid-week market update: Today's market action should be a lesson to me to change model rankings based on overnight futures prices, which trades in a thin and volatile market (see What now?). To set the record straight, the Trend Model did not move to a neutral, or risk-off reading based on today's market action. The change last night was based on ES futures falling 3-4% at the time of writing.

One common refrain made by politicians who concede elections is, "The people have spoken!" In this case, the market has spoken and it has decided to adopt the bullish view that Trump is a reflationary president, rather than the bearish view of Trump the protectionist. This interpretation was made evident by the rally in the cyclically sensitive industrial metals, even as gold prices fell.


From a technical viewpoint, the stock market's behavior is showing a path to an uber-bullish outcome. As the chart below shows, the market is showing the combination of a fear unwind, indicated by the normalization of the VIX term structure from an inverted state, and two days where TRIN has dipped below 0.50, which is a signal of a buying stampede.


The full post can be found at our new site here.


Tuesday, November 8, 2016

What now?

As I write these words, there is pandemonium in the markets. ES futures are down about 4%. My 16 year-old (Canadian) daughter received an offer of marriage over the internet from an American.

I recognize that a lot of people view a Trump presidency with horror, but it's time to assess the investment implications of these electoral results. Arguably, fear levels have already spiked and any panic selling could be viewed as a buying opportunity for stocks. As the chart below shows, the CBOE put/call ratio (middle panel) spiked to 1.48 yesterday and the VIX term structure inverted. These are readings consistent with short-term bottoms rather than the start of a sustained bear leg.


So let's take a deep breath and review the bull and bear case for equities under a Trump administration.

The full post can be found at our new site here.

Monday, November 7, 2016

Who to believe? Former VL research director Eisenstadt vs. VLMAP

I got a few questions about an apparent contradiction in my last post (see Don't be fooled, Election 2016 isn't the Brexit referendum). I had highlighted a Mark Hulbert article indicating that former Value Line researcher director Sam Eisenstadt had a SPX target of 2270 to 2310 by April 2017.

At about the same time, Hulbert had also written a Barron's article on November 3, 2016 where he postulated little or no upside in stock prices, based on the analysis of the Value Line Median Appreciation Potential (VLMAP). In fact, VLMAP readings are similar to levels seen at the 2007 market top:
Market timers use the VLMAP to project where the stock market will be in four years, the midpoint of the analysts’ three-to-five-year horizon.

The VLMAP is currently at one of its lowest levels in years—as low, in fact, as it stood at the top of the bull market in October 2007, right before the worst bear market in the U.S. since the Great Depression.

Value Line itself does not recommend using the VLMAP as a market-timing tool, even though the firm is not against anyone using it or any of the other data it produces. As far as I can tell, the VLMAP-based market-timing model originates in work done in the 1970s and 1980s by Daniel Seiver, a member of the economics faculty at California Polytechnic State University and editor of an investment advisory service called the PAD System Report.

It’s worth noting that a casual reader of the Value Line Investment Survey wouldn’t immediately become alarmed upon viewing the latest VLMAP reading. It stands at 40%, which over four years is the equivalent to an annualized return of 8.8%.
As Eisenstadt had been the long serving research director of Value Line until 2009, how can investors reconcile these apparent contradictory bullish and bearish views based on similar data. Which interpretation of Value Line data should we believe?

The full post can be found at our new site here.

Sunday, November 6, 2016

Don't be fooled, Election 2016 isn't the Brexit referendum

Preface: Explaining our market timing models
We maintain several market timing models, each with differing time horizons. The "Ultimate Market Timing Model" is a long-term market timing model based on the research outlined in our post, Building the ultimate market timing model. This model tends to generate only a handful of signals each decade.

The Trend Model is an asset allocation model which applies trend following principles based on the inputs of global stock and commodity price. This model has a shorter time horizon and tends to turn over about 4-6 times a year. In essence, it seeks to answer the question, "Is the trend in the global economy expansion (bullish) or contraction (bearish)?"

My inner trader uses the trading component of the Trend Model to look for changes in direction of the main Trend Model signal. A bullish Trend Model signal that gets less bullish is a trading "sell" signal. Conversely, a bearish Trend Model signal that gets less bearish is a trading "buy" signal. The history of actual out-of-sample (not backtested) signals of the trading model are shown by the arrows in the chart below. Past trading of the trading model has shown turnover rates of about 200% per month.


The latest signals of each model are as follows:
  • Ultimate market timing model: Buy equities*
  • Trend Model signal: Risk-on*
  • Trading model: Bullish*
The performance chart and model readings have been delayed by a week out of respect to our paying subscribers.

Update schedule: I generally update model readings on my site on weekends and tweet any changes during the week at @humblestudent. Subscribers will also receive email notices of any changes in my trading portfolio.


It's all about the election
I have some terrible news to report. As a result of the change from Daylight Savings to Standard Time this weekend, the entire world will have to endure the US election for an extra hour.

All kidding aside, I could see the market anxiety rising all of last week. It wasn't just the market action, which had taken on an increasingly risk-off tone as the week went on. It wasn't the rising bearishness on social media. The biggest indicator of concerns over electoral uncertainty occurred when I saw that the traffic on my last post (see Trading the Trump Tantrum) was roughly triple the usual rate.

Despite some half-hearted rally attempts, the SPX ended the week testing its 200 day moving average (dma), and oversold on a number of key metrics. Traders are treating next week's US election as the same kind of market moving event as the Brexit referendum. There is one key difference. The market was relatively sanguine going into the UK vote and expected a favorable outcome. By contrast, the market is positioning for a bearish outcome, even though the polls show that the bullish scenario, namely a Clinton win, as the more likelyt scenario.


Market analysis in the face of event risk involves answering the following questions:
  • How would the market likely behave in the absence of tail-risk?
  • How are market participants positioned ahead of the event?
  • What are the likely bullish and bearish scenarios after the event?
The full post can be found at our new site here.

Tuesday, November 1, 2016

Trading the Trump Tantrum

Mid-week market update: The stock market sold off today on no apparent fundamental or economic news. The most likely cause was the latest ABC/Washington Post tracking poll that showed that Trump had overtaken Clinton. The race had been tightening for several days, but this seemed to be the last straw for the markets, which threw a tantrum in response.


The Mexican peso, which has been an excellent barometer of the presidential race, tanked as a result.


The stock market did too. The SPX has now broken a key support level at 2120 and I am seeing bearish technicians coming out of the woodwork in my social media feeds. The Fear and Greed Index is diving into fear territory.


What`s next?

The full post can be found at our new site here.

Monday, October 31, 2016

Fedwatch: How much high a pressure can the economy handle?

Ever since Janet Yellen made that her "high pressured economy" speech, market analysts have been scrambling to understand what she meant by that term. The Fed Chair used that term in the context of a research conference held at the Boston Fed. So was it an academic musing, or was it a hint of a subtle shift in Fed policy?

The chart below shows the number of instances in the last 12 months when Core PCE has exceeded 2%, which is the Fed's inflation target. As the chart shows, the FOMC has tended to start a tightening cycle whenever the rolling count has hit six. The only exception occurred in 2011, when Europe mired in a Greek debt crisis.


The latest September Core PCE reading, which was released today, came in an annualized 1.7%, which was short of the 2% target. With the current count at five and therefore nearing the threshold for a tightening cycle, the question of the degree of tolerance for higher pressure in an economy is an important issue for monetary policy.

The full post can be found at our new site here.

Sunday, October 30, 2016

FBI email probe + rising rates = Equity bear?

Preface: Explaining our market timing models
We maintain several market timing models, each with differing time horizons. The "Ultimate Market Timing Model" is a long-term market timing model based on the research outlined in our post, Building the ultimate market timing model. This model tends to generate only a handful of signals each decade.

The Trend Model is an asset allocation model which applies trend following principles based on the inputs of global stock and commodity price. This model has a shorter time horizon and tends to turn over about 4-6 times a year. In essence, it seeks to answer the question, "Is the trend in the global economy expansion (bullish) or contraction (bearish)?"

My inner trader uses the trading component of the Trend Model to look for changes in direction of the main Trend Model signal. A bullish Trend Model signal that gets less bullish is a trading "sell" signal. Conversely, a bearish Trend Model signal that gets less bearish is a trading "buy" signal. The history of actual out-of-sample (not backtested) signals of the trading model are shown by the arrows in the chart below. Past trading of the trading model has shown turnover rates of about 200% per month.


The latest signals of each model are as follows:
  • Ultimate market timing model: Buy equities*
  • Trend Model signal: Risk-on*
  • Trading model: Bullish*
The performance chart and model readings have been delayed by a week out of respect to our paying subscribers.

Update schedule: I generally update model readings on my site on weekends and tweet any changes during the week at @humblestudent. Subscribers will also receive email notices of any changes in my trading portfolio.


In the absence of political tail-risk...
Up until Friday, the big story of last week was the bond market's shellacking in the face of rising inflationary expectations. I had been planning to discuss whether the rout in bonds is likely to take down stock prices.

Then the news hit the tape that the FBI was investigation new Clinton emails that were discovered in the course of the Anthony Weiner sexting investigation. Stock prices, which were up modestly, tanked on the news. At the height of the sell-off, the SPX fell and tested the key support level at 2120, and the market flashed oversold warnings on selected indicators. By the close, the bears were unable to gain the upper hand and 2120 support held.


As the market has been trading sideways since the upside breakout in July, the question is whether this news is enough to signal the start of a bear phase (see my last post The bulls and bears wait for Godot). The bulls had been unable to push stock prices to new highs despite the emergence of renewed growth (see Q3 earnings season: Stud or dud?), can the bears take advantage of the news of a new FBI probe of Hillary Clinton`s email to weaken stock prices?

I begin this week's market analysis with an examination of the stock market's macro and fundamental backdrop. and then consider the ramifications of Friday's political bombshell.

The full post can be found at our new site here.

Wednesday, October 26, 2016

The bulls and bears wait for Godot

Mid-week market update: Several readers wrote me this week with similar comments, which went something like, "I concur with your bullish fundamental reasoning, but the stock market is trading little 'heavy' and I am concerned." I agree 100%. Despite the bullish fundamental and technical tailwinds (see Six reasons why I am still bullish), the market hasn't been able to break out of the narrow range since the upside breakout in July to new all-time highs.


Ryan Detrick at LPL Financial characterized this market as a "historic holding pattern":
What has happened the past four months is truly historic, in that nothing has happened. For equities to trade in this tight of a range near all-time highs is extremely rare and we probably have the election to thank for it, as big money would rather wait until the results before making any moves.
From a technical viewpoint, neither the bulls nor the bears have been able to muster sufficient strength to break this market out of the narrow range. For both sides, they might have well been the characters Vladimir and Estragon in a production of Waiting for Godot. Nevertheless, there are plenty of reasons to be bullish on equities on an intermediate term basis.

The full post can be found at our new site here.

Tuesday, October 25, 2016

Silver linings in Europe's political dark clouds

As the American elections approach their final denouement in two weeks, it's time to look ahead to a number of political dark clouds forming in Europe. FT Alphaville recently highlighted research from Barclay's showing the collapse in support of establishment parties around the world.


The support for anti-establishment and protest parties and candidates have been on the rise - and these individuals represent threats to upset the current political status quo. After the US election in November, we have to look forward to the Italian referendum on December 4, the start of Brexit negotiations in early/mid 2017, the French election, and the German election. All of these events have the potential to tear Europe apart.

I believe that fears over the political disintegration in Europe may be overblown. Arguably, we could be seeing a near-term peak in the support of the protest vote in 2016 and 2017.

The full post can be found at our new site here.

Sunday, October 23, 2016

When does the Fed remove the punch bowl?

Preface: Explaining our market timing models
We maintain several market timing models, each with differing time horizons. The "Ultimate Market Timing Model" is a long-term market timing model based on the research outlined in our post, Building the ultimate market timing model. This model tends to generate only a handful of signals each decade.

The Trend Model is an asset allocation model which applies trend following principles based on the inputs of global stock and commodity price. This model has a shorter time horizon and tends to turn over about 4-6 times a year. In essence, it seeks to answer the question, "Is the trend in the global economy expansion (bullish) or contraction (bearish)?"

My inner trader uses the trading component of the Trend Model to look for changes in direction of the main Trend Model signal. A bullish Trend Model signal that gets less bullish is a trading "sell" signal. Conversely, a bearish Trend Model signal that gets less bearish is a trading "buy" signal. The history of actual out-of-sample (not backtested) signals of the trading model are shown by the arrows in the chart below. Past trading of the trading model has shown turnover rates of about 200% per month.


The latest signals of each model are as follows:
  • Ultimate market timing model: Buy equities*
  • Trend Model signal: Risk-on*
  • Trading model: Bullish*
The performance chart and model readings have been delayed by a week out of respect to our paying subscribers.

Update schedule: I generally update model readings on my site on weekends and tweet any changes during the week at @humblestudent. Subscribers will also receive email notices of any changes in my trading portfolio.


How will the Fed fight the next war?
In my last post (see A sentimental embrace of risk), I showed that risk appetite was starting to perk up. Investor interest is rising in both the reflation and cyclical investment themes. So far, this risk-on thesis is showing solid fundamental underpinnings.

The bearish strategists at Goldman Sachs and HSBC who had forecasted a disappointing Q3 earnings season have so far been wrong (see Q3 earnings season: Stud or dud?). With 23% of SPX companies having reported earnings, John Butters of Factset observed that both the EPS and sales beat are well above their 5-year historical averages. As a result, Street optimism continues to improve as forward 12-month EPS rose another 0.16% in the week (chart annotations are mine).


The stock market is on pace to rally on the back of a growth revival and the end of the earnings recession that began in late 2014. This party is just starting to going. The only question is when the Fed will act to take away the punch bowl. This issue is becoming a crucial question for investors, as speeches from Yellen and Fischer last week may indicate that the Fed is signaling the start of a shift in thinking of how it fights the next war, persistent low growth.

The full post can be found at our new site here.

Wednesday, October 19, 2016

A sentimental embrace of risk

Mid-week market update: When traders refer to "institutions" in the context of sentiment analysis, often the impression is that institutions represent some monolithic entity. Nothing could be further from the truth. I tend to analyze institutional sentiment by segmenting them into four distinct groups, each with their own data sources:
  • US institutions, whose sentiment can be measured by Barron's semi-annual Big Money Poll
  • Foreign and global institutions, as measured by the BAML Fund Manager Survey (FMS), which is conducted on a monthly basis;
  • RIAs, as measured by the NAAIM survey, conducted weekly; and
  • Hedge funds, as measured by option data and the CFTC futures Commitment of Traders data, though hedge funds are partly represented in the BAML FMS sample.
Each group is different and they can behave differently. The first three tend to represent slow but big money, while hedge funds represent the fast and high turnover money.

The differing groups of institutions don't always agree. Today, however, the US and global institutions all seem to have formed similar views. Institutional investors are bearish on bonds and they are becoming increasingly bullish on stocks, based on a belief that growth is improving.

Under these circumstances, the key question for traders and investors is whether they should jump on bullish equity bandwagon or be contrarian and fade the institutional purchases.

The full post can be found at our new site here.

Sunday, October 16, 2016

Q3 earnings season: Stud or a dud?

Preface: Explaining our market timing models
We maintain several market timing models, each with differing time horizons. The "Ultimate Market Timing Model" is a long-term market timing model based on the research outlined in our post, Building the ultimate market timing model. This model tends to generate only a handful of signals each decade.

The Trend Model is an asset allocation model which applies trend following principles based on the inputs of global stock and commodity price. This model has a shorter time horizon and tends to turn over about 4-6 times a year. In essence, it seeks to answer the question, "Is the trend in the global economy expansion (bullish) or contraction (bearish)?"

My inner trader uses the trading component of the Trend Model to look for changes in direction of the main Trend Model signal. A bullish Trend Model signal that gets less bullish is a trading "sell" signal. Conversely, a bearish Trend Model signal that gets less bearish is a trading "buy" signal. The history of actual out-of-sample (not backtested) signals of the trading model are shown by the arrows in the chart below. Past trading of the trading model has shown turnover rates of about 200% per month.


The latest signals of each model are as follows:
  • Ultimate market timing model: Buy equities*
  • Trend Model signal: Risk-on*
  • Trading model: Bullish*
The performance chart and model readings have been delayed by a week out of respect to our paying subscribers.

Update schedule: I generally update model readings on my site on weekends and tweet any changes during the week at @humblestudent. Subscribers will also receive email notices of any changes in my trading portfolio.


Is the earnings recession over?
Regular readers will know that I have been bullish on stocks for the last few months. My forecast has called for an equity rally into year-end and beyond. Last week, a couple of Street strategists have turned cautious on the stock market. I would therefore like to examine the bear cases that they present.

Bloomberg reported that Goldman Sachs strategist David Kostin set an SPX year-end target of 2100. The main reason for the bearish call is earnings disappointment.
"Variables that determine earnings surprises – changes in U.S. economic growth, interest rates, oil price, the dollar, and EPS [earnings per share] revisions – suggest a below-average share of firms will report positive earnings per share surprises (43 percent vs. 46 percent)," he writes in a note to clients. " We see a weak third-quarter reporting season coupled with negative fourth-quarter EPS revisions pushing stocks 2 percent lower to our year-end target of 2,100."

Bloomberg also reported that HSBC strategist Ben Laidler also sounded a cautious note, based on valuation and likely earnings disappointment:
"We think markets are pretty vulnerable. You have earnings expectations which are pretty high, you have valuations which are pretty high," he said. "You look around the world, the level of economic-policy uncertainty is very, very high — I think that is a dangerous combination right now."
As I will show, at the core is the bull vs. bear debate is whether the earnings recession ended in Q3 2016.

The full post can be found at our new site here.

Thursday, October 13, 2016

Three reasons why this isn't 1987

A scary analog has been floating around in the last few days. Citibank FX analyst Tom Fitzpatrick postulated that the current market looks an awful lot like 1987 (via Business Insider).


Murray Gunn at HSBC also issued a similar crash warning. Oh, puh-leez! I can think of at least three reasons why this isn't 1987 (also recall The USD Apocalypse of September 30, 2016).

The full post can be found at our new site here.

Wednesday, October 12, 2016

Six reasons why I am still bullish

Mid-week market update: I wrote on the weekend to buy Yom Kippur, which ends today (see Buy Yom Kippur! SPX 2500 by Passover?). My inner trader sent out an email to subscribers yesterday indicating that he had added to his long position by buying a high-beta small cap position.


I would like to outline the reasons why I remain intermediate term bullish on equities:
  • Market breadth is supportive of more gains
  • Risk appetite is healthy across the board
  • Investor anxiety is high, which is contrarian bullish
  • The Fed is equity market friendly
  • Growth expectations are healthy
  • A period of positive seasonality is approaching
The full post can be found at our new site here.