Monday, January 31, 2022

The dirty little secret of Q4 earnings season

You can tell a lot about the character of a market by the way it reacts to the news. Bespoke reported a downbeat market reaction to earnings and sales beats, which is disappointing, "The 163 companies that have beaten both top and bottom line estimates this earnings season have averaged a one-day decline of 0.23% on their earnings reaction days."


While this may seem like the dirty little secret of Q4 earnings season, there’s another one that buried that you may not be aware of.

The full post can be found here.

Sunday, January 30, 2022

Trading the Panic

Preface: Explaining our market timing models 
We maintain several market timing models, each with differing time horizons. The "Ultimate Market Timing Model" is a long-term market timing model based on the research outlined in our post, Building the ultimate market timing model. This model tends to generate only a handful of signals each decade.

The Trend Asset Allocation Model is an asset allocation model that applies trend following principles based on the inputs of global stock and commodity price. This model has a shorter time horizon and tends to turn over about 4-6 times a year. The performance and full details of a model portfolio based on the out-of-sample signals of the Trend Model can bsoe found here.


My inner trader uses a trading model, which is a blend of price momentum (is the Trend Model becoming more bullish, or bearish?) and overbought/oversold extremes (don't buy if the trend is overbought, and vice versa). Subscribers receive real-time alerts of model changes, and a hypothetical trading record of the email alerts is updated weekly here. The hypothetical trading record of the trading model of the real-time alerts that began in March 2016 is shown below.


The latest signals of each model are as follows:
  • Ultimate market timing model: Buy equities*
  • Trend Model signal: Neutral*
  • Trading model: Bullish*
* The performance chart and model readings have been delayed by a week out of respect to our paying subscribers.

Update schedule: I generally update model readings on my site on weekends and tweet mid-week observations at @humblestudent. Subscribers receive real-time alerts of trading model changes, and a hypothetical trading record of those email alerts is shown here.

Subscribers can access the latest signal in real-time here.


Fear rising
The stock market action last week is an example of a classic panic. Not only is the market oversold, but also extreme fear is showing up in sentiment readings. The weekly AAII survey has flashed a contrarian buy signal for a second consecutive week. Not only is the bull-bear spread at an extreme seen only two other times in the last 10 years, but also bearish sentiment is the fourth highest on record in the same period.


The full post can be found here.

Saturday, January 29, 2022

Buy to the sound of cannons

As global markets have been jittery on the prospect of military conflict in Ukraine, Ben Carlson showed a table of the regular nature of US stock market drawdowns, which is a feature of equity risk.


I am also reminded of the quip by British banker Nathan Rothchild, "Buy to the sound of cannons, sell to the sound of trumpets." As well, the trader Art Cashin also related his experience with the Cuban Missile Crisis as a young man (via Barry Ritholz):
Anyway, it was the Cuban Missile Crisis and there were rumors that Russia had launched rockets and the Dow took a dive near the bell.

I cleaned up my desk and raced to the Moosehead, as animated as only an 18 year-old can be. Jack was already there and as I burst through the door, I shouted: “Jack! Jack, there was a strong rumor that the missiles were flying and I tried to sell the market but failed.”

Jack said “Calm down kid! First buy me a drink and then sit down and listen to me.” I ordered the drink and meekly sat down.

Jack said – “Look kid, if you hear the missiles are flying, you buy them. You don’t sell them.”

“You buy them?” I said, somewhat puzzled.

“Sure you buy them!” said Jack. “Cause if you’re wrong, the trade will never clear. We’ll all be dead.”

That’s a lesson you won’t learn in the Wharton School.

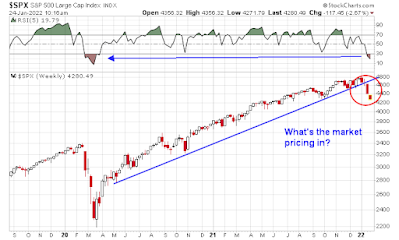
Both Rothchild's thinking and Cashin's story are lessons in market psychology and the occasional asymmetric nature of asset returns. With the angst over the FOMC decision out of the way, let's consider what might happen if war were to actually break out.

The full post can be found here.


Wednesday, January 26, 2022

Seeking sanity in a mad market

Mid-week market update: The stock market has been extremely oversold for the past few days, but one element had been missing for the short-term, namely a sentiment capitulation and wash-out, which may have finally appeared. The latest Business Week cover may be the classic contrarian magazine cover indicator of a developing bottom.


The full post can be found here.

Monday, January 24, 2022

What's the market pricing in?

As the stock market looks forward to another exciting week of volatility, the technical damage suffered by the market is quite severe. Nevertheless, investors need to take a deep breath and ask, "What's the market pricing in?"


The three major factors I consider in my analysis are:
  • Earnings and valuation;
  • Fed policy; and
  • Geopolitical risk.
The full post can be found here.

Sunday, January 23, 2022

Buy the dip, or sell the dead cat bounce?

Preface: Explaining our market timing models 
We maintain several market timing models, each with differing time horizons. The "Ultimate Market Timing Model" is a long-term market timing model based on the research outlined in our post, Building the ultimate market timing model. This model tends to generate only a handful of signals each decade.

The Trend Asset Allocation Model is an asset allocation model that applies trend following principles based on the inputs of global stock and commodity price. This model has a shorter time horizon and tends to turn over about 4-6 times a year. The performance and full details of a model portfolio based on the out-of-sample signals of the Trend Model can bsoe found here.


My inner trader uses a trading model, which is a blend of price momentum (is the Trend Model becoming more bullish, or bearish?) and overbought/oversold extremes (don't buy if the trend is overbought, and vice versa). Subscribers receive real-time alerts of model changes, and a hypothetical trading record of the email alerts is updated weekly here. The hypothetical trading record of the trading model of the real-time alerts that began in March 2016 is shown below.


The latest signals of each model are as follows:
  • Ultimate market timing model: Buy equities*
  • Trend Model signal: Bullish*
  • Trading model: Bearish*
* The performance chart and model readings have been delayed by a week out of respect to our paying subscribers.

Update schedule: I generally update model readings on my site on weekends and tweet mid-week observations at @humblestudent. Subscribers receive real-time alerts of trading model changes, and a hypothetical trading record of those email alerts is shown here.

Subscribers can access the latest signal in real-time here.


Estimating downside risk
Last week, I highlighted a sell signal from the intermediate-term breadth momentum oscillator (ITBM). The 14-day RSI of ITBM had recycled from an overbought condition, which was a sell signal for the stock market. In the past, ITBM sell signals have resolved with 5-10% drawdowns and the market bottomed with the ITBM RSI fell to an oversold or near oversold condition.


The S&P 500 fell -5.8% since the sell signal and RSI is oversold. Does this indicate a short-term bottom, or is this the start of a major bear leg?

The full post can be found here.

Saturday, January 22, 2022

Rethinking the Hindenburg Omen

The ominously named Hindenburg Omen was developed by Jim Miekka to spot major stock market tops. Unfortunately, it has also had a history of crying wolf too many times with false positives. Its inconsistency prompted one commentary to call it a warning to avoid traveling by blimp.

David Keller recently penned an article that analyzed the Hindenburg Omen in detail. He called it a breadth indicator with three specific components:
  1. The stock market has to be in an established uptrend;
  2. An expansion in both new 52-week highs and lows that indicate indecision; and
  3. The market exhibits a price momentum break.
Keller further explained, "A valid Hindenburg Omen signal needs to have multiple signals within a 30-day window to actually register a valid bearish indication."

A chart of the Hindenburg Omen is shown below. The indicator is displayed in the lower panel and a valid signal has a value of 3. History shows that there were 11 such warnings in the last 10 years. Six saw declines (shown in pink). The market continued to advance or the Omen was too late in warning of declines in four instances (grey). One resolved in a sideways choppy market (grey/pink). While these results are marginally useful, this indicator's sell signals don't inspire a high level of confidence.


The Hindenburg Omen has recently flashed a series of sell signals. How should investors react?

The full post can be found here.

Wednesday, January 19, 2022

Painful enough for a bounce?

Mid-week market update: After this week's brutal sell-offs, the stock market is oversold enough for a bounce. The VIX Index has risen above its upper Bollinger Band, which is an oversold market condition and short-term buy signal.


If the market action in the past year is any guide, the potential for the S&P 500 is the 4720-4750 zone.

The full post can be found here.

Sunday, January 16, 2022

Reversals everywhere

Preface: Explaining our market timing models 
We maintain several market timing models, each with differing time horizons. The "Ultimate Market Timing Model" is a long-term market timing model based on the research outlined in our post, Building the ultimate market timing model. This model tends to generate only a handful of signals each decade.

The Trend Asset Allocation Model is an asset allocation model that applies trend following principles based on the inputs of global stock and commodity price. This model has a shorter time horizon and tends to turn over about 4-6 times a year. The performance and full details of a model portfolio based on the out-of-sample signals of the Trend Model can bsoe found here.


My inner trader uses a trading model, which is a blend of price momentum (is the Trend Model becoming more bullish, or bearish?) and overbought/oversold extremes (don't buy if the trend is overbought, and vice versa). Subscribers receive real-time alerts of model changes, and a hypothetical trading record of the email alerts is updated weekly here. The hypothetical trading record of the trading model of the real-time alerts that began in March 2016 is shown below.


The latest signals of each model are as follows:
  • Ultimate market timing model: Buy equities*
  • Trend Model signal: Bullish*
  • Trading model: Neutral*
* The performance chart and model readings have been delayed by a week out of respect to our paying subscribers.

Update schedule: I generally update model readings on my site on weekends and tweet mid-week observations at @humblestudent. Subscribers receive real-time alerts of trading model changes, and a hypothetical trading record of those email alerts is shown here.

Subscribers can access the latest signal in real-time here.


Fun with Japanese candlesticks
Last week's market action in the S&P 500 was a classic lesson in the usefulness of Japanese candlesticks. I wrote last weekend that the market was oversold and due for a rebound. The S&P 500 cooperated on Monday by exhibiting a hammer candle, in which the market tanks but rallied to a level equal to or above the open. Hammer candles are indications of capitulation selling and a possible short-term bottom, but the pattern needs to be confirmed by continued strength the next day. The bottom was confirmed Tuesday when the index advanced and regained the 50 dma.

The second candlestick lesson came on Wednesday, when the S&P 500 showed a doji, when the open and closing levels are about the same. Doji candles are signs of indecision and possible reversals but must be confirmed the next day. The S&P 500 duly weakened Thursday and stabilized Friday ahead of the long weekend. All of this is occurring as the S&P 500 forms a triangle, which suggests that a big move is just around the corner.


In short, it was a master class in trading Japanese candlestick patterns. Not all candlesticks resolve in textbook manners, but they did last week.

The full post can be found here.

Saturday, January 15, 2022

Fade the value rebound

In the past week, several readers have asked whether it's too late to be buying financials, value, and other cyclical stocks. In reply, I highlighted the recent Mark Hulbert column, "Value stocks now are beating growth by 10 points, but the easy money might be behind us", namely that the value/growth reversal may not necessarily have legs.
I analyzed value’s relative strength back to 1926, courtesy of data from Dartmouth College professor Ken French. On average, a given month’s relative strength persisted for just one month. With holding periods lasting two or more months, value’s performance against growth was only randomly related to what came before...

So if you’re keeping score for these three instances in which value beat growth by as much as it has recently, there’s one case in which value relative strength continued, one in which it reversed itself, and one in which there was no trend one way or the other. Good luck extrapolating that into the future.

Here are some other reasons to fade the value rebound.

The full post can be found here.

Wednesday, January 12, 2022

A buy signal AND a sell signal

Mid-week market update: In my update last weekend (see Waiting for the sell signal), I observed that the S&P 500 was oversold and due for a relief rally. The market cooperated by printing a hammer candle on Monday, which is a capitulative reversal indicator, and confirmed the reversal with a bullish follow through on Tuesday by recapturing the 50-day moving average. The index finished the move today with a doji candle, which indicates possible indecision.


That was the buy signal. There was also a sell signal.

The full post can be found here.

Sunday, January 9, 2022

Waiting for the sell signal

Preface: Explaining our market timing models 
We maintain several market timing models, each with differing time horizons. The "Ultimate Market Timing Model" is a long-term market timing model based on the research outlined in our post, Building the ultimate market timing model. This model tends to generate only a handful of signals each decade.

The Trend Asset Allocation Model is an asset allocation model that applies trend following principles based on the inputs of global stock and commodity price. This model has a shorter time horizon and tends to turn over about 4-6 times a year. The performance and full details of a model portfolio based on the out-of-sample signals of the Trend Model can be found here.


My inner trader uses a trading model, which is a blend of price momentum (is the Trend Model becoming more bullish, or bearish?) and overbought/oversold extremes (don't buy if the trend is overbought, and vice versa). Subscribers receive real-time alerts of model changes, and a hypothetical trading record of the email alerts is updated weekly here. The hypothetical trading record of the trading model of the real-time alerts that began in March 2016 is shown below.


The latest signals of each model are as follows:
  • Ultimate market timing model: Buy equities*
  • Trend Model signal: Bullish*
  • Trading model: Bullish*
* The performance chart and model readings have been delayed by a week out of respect to our paying subscribers.

Update schedule: I generally update model readings on my site on weekends and tweet mid-week observations at @humblestudent. Subscribers receive real-time alerts of trading model changes, and a hypothetical trading record of those email alerts is shown here.

Subscribers can access the latest signal in real-time here.


No sell signal yet
The S&P 500 took fright last week when the December FOMC minutes revealed a hawkish pivot and the stock market sold off. While I have become more cautious in the past few weeks, technical indicators have not flashed any intermediate-term sell signals just yet.

As an example, the NYSE McClellan Summation Index (NYSI) is only recycling from an oversold condition. In the last 20 years, few instances have resolved in a bearish manner (red vertical lines) and most have seen the market advance (black lines).


The market is increasingly vulnerable to a setback, but there is no need to become overly bearish just yet. Traders should wait for a sell signal first.

The full post can be found here.

Saturday, January 8, 2022

2022 = Twenty-Twenty, Too?

As 2021 drew to a close, the broadly based Wilshire 5000 flashed a particularly long-term sell signal in the form of a negative 14-month RSI divergence. The last time this happened was in August 2018 (see Market top ahead? My inner investor turns cautious). Stock prices continued to rise for another two months before it hit an air pocket. In the past, a bearish event can take as long as a year. What does this mean for stocks in 2022?


The bond market may fare better in the coming year. The Barclays Aggregate Index unusually fell last year and it has never exhibited two consecutive years of negative returns (warning: n=3).


What does this mean for asset prices? Will 2022 be equity bearish and volatile and become Twenty-Twenty Too?

The full post can be found here.

Wednesday, January 5, 2022

Why I am cautious

Mid-week market update: As 2022 opens, I have become increasingly cautious about the stock market. The put/call ratio (CPC) is a bit low, indicating rising complacency. Past instances of a combination of a rapidly falling CPC and low CPC have seen the market struggle to advance. While this is not immediately bearish, it is a flag for caution.


Here are some other reasons why I am cautious.

The full post can be found here.

Monday, January 3, 2022

A "penny wise, pound foolish" application of the Trend Model

I received a number of responses to the post on the 2021 report card on my investment models. While most were complimentary, one reader asked me for a more aggressive formulation of the Trend Asset Allocation Model. 

As a reminder, the signals of the Trend Model are out-of-sample signals, but there are no portfolio returns to publish, mainly because I don't know anything about you. I know nothing about your return targets, your risk tolerance and pain thresholds, your tax situation, or even the jurisdiction you are in. If I offered an actual portfolio, it would be a formal prospectus document outlining what to expect.

Instead, the backtested returns are based on a specific formula for constructing a balanced fund portfolio based on Trend Model scores and reasonable risk assumptions of an average investor with a 60% stock/40% bond asset allocation.
  • Risk-on: 80% SPY (S&P 500), 20% IEF (7-10 Treasuries)
  • Neutral: 60% SPY, 40% IEF
  • Risk-off: 40% SPY, 60% IEF
An advisor or portfolio manager could then change the equity allocation by 20% depending on the Trend Model score without Compliance tapping him on the shoulder.

The historical backtest of the Trend Model using this portfolio construction technique yielded excellent results. An investor using this approach could achieve equity-like returns while bearing balanced fund-like risk. Needless to say, this backtest is just a proof of concept. Every investor is different and your mileage will vary.


A reader then asked me to backtest a more aggressive approach to portfolio construction. Instead of a 60% SPY and 40% IEF benchmark, he suggested a 100% equity position, based on 60% SPY and 40% defensive equity substitute for bonds. The defensive portfolio consists of an equal-weighted portfolio of XLV (Healthcare), XLP (Consumer Staples), XLU (Utilities), and XLRE (Real Estate).

The results turned out to be a case of "penny wise, pound foolish".

The full post can be found here.

Sunday, January 2, 2022

Don't overstay the party

Preface: Explaining our market timing models 
We maintain several market timing models, each with differing time horizons. The "Ultimate Market Timing Model" is a long-term market timing model based on the research outlined in our post, Building the ultimate market timing model. This model tends to generate only a handful of signals each decade.

The Trend Asset Allocation Model is an asset allocation model that applies trend following principles based on the inputs of global stock and commodity price. This model has a shorter time horizon and tends to turn over about 4-6 times a year. The performance and full details of a model portfolio based on the out-of-sample signals of the Trend Model can be found here.


My inner trader uses a trading model, which is a blend of price momentum (is the Trend Model becoming more bullish, or bearish?) and overbought/oversold extremes (don't buy if the trend is overbought, and vice versa). Subscribers receive real-time alerts of model changes, and a hypothetical trading record of the email alerts is updated weekly here. The hypothetical trading record of the trading model of the real-time alerts that began in March 2016 is shown below.


The latest signals of each model are as follows:
  • Ultimate market timing model: Buy equities*
  • Trend Model signal: Bullish*
  • Trading model: Bullish*
* The performance chart and model readings have been delayed by a week out of respect to our paying subscribers.

Update schedule: I generally update model readings on my site on weekends and tweet mid-week observations at @humblestudent. Subscribers receive real-time alerts of trading model changes, and a hypothetical trading record of those email alerts is shown here.

Subscribers can access the latest signal in real-time here.


Edge towards the exit
Happy New Year! I hope you are enjoying the seasonal rally, but don't get overly complacent about the party that the bulls are throwing. Sufficient warning signs are appearing that it's time to edge towards the exit.

Exhibit A is the relative performance of the top five sectors of the S&P 500. These sectors comprise over three-quarters of index weight and it would be impossible for the S&P 500 to rise or fall without the leadership of a majority of sectors. As the accompanying chart shows, none of the sectors are in a relative uptrend. The most bullish pattern is technology, which is trading sideways compared to the S&P 500.


Once the seasonal strength fades, what happens to the market?

The full post can be found here.

Saturday, January 1, 2022

Don't fight the (hawkish) Fed

As the S&P 500 rises to fresh all-time highs, an important risk is lurking in the form of a more hawkish Fed. Inflation is running hot. When the Fed was officially in the transitory camp earlier this year, inflation pressures were concentrated in only a few components such as used cars. Today, price increases are broadening and even core sticky price CPI (red line) is rising strongly. As a consequence, the Fed made its hawkish pivot and signaled that it is on pace to end its QE program by March 2022, even though inflation expectations (black line) remain well-anchored.


The market is now discounting three rate hikes in 2022, with lift-off to begin in March. Here is how the Fed turned hawkish.


The full post can be found here.