Saturday, December 24, 2022

What to expect when you're expecting (a recession)

Preface: Explaining our market timing models 
We maintain several market timing models, each with differing time horizons. The "Ultimate Market Timing Model" is a long-term market timing model based on the research outlined in our post, Building the ultimate market timing model. This model tends to generate only a handful of signals each decade.

The Trend Asset Allocation Model is an asset allocation model that applies trend-following principles based on the inputs of global stock and commodity prices. This model has a shorter time horizon and tends to turn over about 4-6 times a year. The performance and full details of a model portfolio based on the out-of-sample signals of the Trend Model can be found here.


My inner trader uses a trading model, which is a blend of price momentum (is the Trend Model becoming more bullish, or bearish?) and overbought/oversold extremes (don't buy if the trend is overbought, and vice versa). Subscribers receive real-time alerts of model changes, and a hypothetical trading record of the email alerts is updated weekly here. The hypothetical trading record of the trading model of the real-time alerts that began in March 2016 is shown below.


The latest signals of each model are as follows:
  • Ultimate market timing model: Sell equities*
  • Trend Model signal: Neutral*
  • Trading model: Neutral*
* The performance chart and model readings have been delayed by a week out of respect to our paying subscribers.

Update schedule: I generally update model readings on my site on weekends. I am also on Twitter at @humblestudent and on Mastodon at @humblestudent@toot.community. Subscribers receive real-time alerts of trading model changes, and a hypothetical trading record of those email alerts is shown here.

Subscribers can access the latest signal in real time here.


A difficult 2022
2022 has been a difficult year for equity and bond investors. Both stock and bond returns have been abysmal this year.


As investors bid good riddance to 2022, here is what the market is expecting for 2023.

The full post can be found here.

Wednesday, December 21, 2022

How the BOJ disturbed my vacation

Mid-week market update: I know that I said that I wouldn't publish a mid-week market update during my vacation, but the actions of the BOJ managed to disturb my R&R time, so this is just a brief note.

The BOJ's announcement of a retreat from yield curve control by allowing the 10-year JGB yield to rise from 0.25% to 0.50% shocked markets. The widowmaker trade of shorting JGBs finally worked, but it happened when a lot of traders had shut down their books and went on holidays. The move cratered the JGB market, pulled down other major bond markets around the world, and sent the Japanese stock market reeling. Other equities markets fell in sympathy, but the contagion effect was limited as the bond rout steadied and stock markets rebounded.

My usually reliable S&P 500 Intermediate-Term Breadth Momentum Oscillator (ITBM) had flashed a sell signal on December 7, 2022 when its 14-day RSI recycled from overbought to neutral. I wrote that a reasonable exit strategy is to either wait for the 14-day RSI or the Zweig Breadth Thrust Indicator to become oversold. Coincidentally, both were triggered just before the BOJ announcement.


The full post can be found here.

Sunday, December 18, 2022

In praise of the bond market

Preface: Explaining our market timing models 
We maintain several market timing models, each with differing time horizons. The "Ultimate Market Timing Model" is a long-term market timing model based on the research outlined in our post, Building the ultimate market timing model. This model tends to generate only a handful of signals each decade.

The Trend Asset Allocation Model is an asset allocation model that applies trend-following principles based on the inputs of global stock and commodity prices. This model has a shorter time horizon and tends to turn over about 4-6 times a year. The performance and full details of a model portfolio based on the out-of-sample signals of the Trend Model can be found here.


My inner trader uses a trading model, which is a blend of price momentum (is the Trend Model becoming more bullish, or bearish?) and overbought/oversold extremes (don't buy if the trend is overbought, and vice versa). Subscribers receive real-time alerts of model changes, and a hypothetical trading record of the email alerts is updated weekly here. The hypothetical trading record of the trading model of the real-time alerts that began in March 2016 is shown below.


The latest signals of each model are as follows:
  • Ultimate market timing model: Sell equities*
  • Trend Model signal: Neutral*
  • Trading model: Bearish*
* The performance chart and model readings have been delayed by a week out of respect to our paying subscribers.

Update schedule: I generally update model readings on my site on weekends. I am also on Twitter at @humblestudent and on Mastodon at @humblestudent@toot.community. Subscribers receive real-time alerts of trading model changes, and a hypothetical trading record of those email alerts is shown here.

Subscribers can access the latest signal in real time here.


Time for bonds to shine
Last week, I highlighted how bond prices were reviving. The close positive correlation between stock and bond prices is breaking. This is the phase of the market cycle when recession fears grow, bond yields fall and bond prices rise, and the stock market weakens. 


The full post can be found here.
Saturday, December 17, 2022

Wall Street is fighting the Fed, should you join in?

Fed Chair Jerome Powell made it clear at the post-FOMC press conference. The Federal Reserve is nowhere close to ending its campaign of rate increases. While last two CPI reports show "a welcome reduction in the monthly pace of price increases...It will take substantially more evidence to have confidence that inflation is on a sustained downward path."

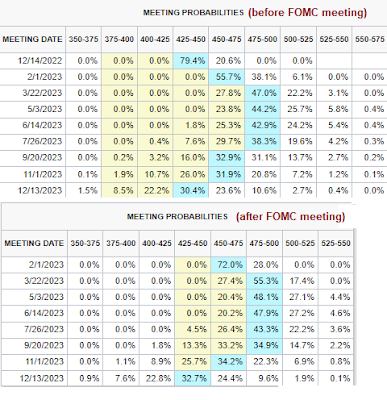
Moreover, the "dot plot" showed a median Fed Funds rate of 5.1%, which is above market expectations. In the aftermath of the FOMC meeting and press conference, Fed Funds expectations barely budged. The terminal rate stayed the same at just under 5%, though the expected path of rate cuts was pushed out by a month from the September to the November meeting.


Wall Street is fighting the Fed. Should you join in? Here are the bull and bear cases.

The full post can be found here.

Wednesday, December 14, 2022

All that's left to do is to wait for Santa Claus

Mid-week market update: Let's begin with an administrative note. In the absence of severe market volatility, this will be the last mid-week market update until the new year. I plan on taking a few days off at the end of the year. I plan to publish the usual two comments this weekend, follow by single comments each weekend after that.

It's always difficult to make definitive market comments on FOMC day, as initial market moves are often reversed on the next day. We can say that the bulls were disappointed by the market reaction to the soft CPI report. The S&P 500 rallied up to test the falling resistance trend line but failed. While the bulls fell short of pushing the index about resistance at 4100, the bears were also unable to push the market below support at 3900. Tactically, all that's left is to wait for the Santa Claus rally.


2022 has been a difficult year for investors. The silver lining is this environment conducive to tax-loss selling. When the tax-loss sales abate, it becomes a setup for the Santa Claus rally, which begins the day after Christmas and ends the second day of the new year.

The full post can be found here.

Sunday, December 11, 2022

Mr. Bond, I expected you to die

Preface: Explaining our market timing models 
We maintain several market timing models, each with differing time horizons. The "Ultimate Market Timing Model" is a long-term market timing model based on the research outlined in our post, Building the ultimate market timing model. This model tends to generate only a handful of signals each decade.

The Trend Asset Allocation Model is an asset allocation model that applies trend-following principles based on the inputs of global stock and commodity prices. This model has a shorter time horizon and tends to turn over about 4-6 times a year. The performance and full details of a model portfolio based on the out-of-sample signals of the Trend Model can be found here.


My inner trader uses a trading model, which is a blend of price momentum (is the Trend Model becoming more bullish, or bearish?) and overbought/oversold extremes (don't buy if the trend is overbought, and vice versa). Subscribers receive real-time alerts of model changes, and a hypothetical trading record of the email alerts is updated weekly here. The hypothetical trading record of the trading model of the real-time alerts that began in March 2016 is shown below.


The latest signals of each model are as follows:
  • Ultimate market timing model: Sell equities*
  • Trend Model signal: Neutral*
  • Trading model: Bearish*
* The performance chart and model readings have been delayed by a week out of respect to our paying subscribers.

Update schedule: I generally update model readings on my site on weekends. I am also on Twitter at @humblestudent and on Mastodon at @humblestudent@toot.community. Subscribers receive real-time alerts of trading model changes, and a hypothetical trading record of those email alerts is shown here.

Subscribers can access the latest signal in real time here.


A rejection and a breakout from resistance
Last week, I highlighted the key technical tests that the S&P 500 was about to undergo as it breached its 200 dma and it was nearing a falling trend line. Ultimately, the stock market failed at resistance and pulled back to a key support level. Long Treasury prices, which had been highly correlated with stock prices in 2023, underwent a similar technical test but staged an upside breakout. 


The stock/bond ratio is now weakening. Anyone who expected Mr. Bond to die in the face of hawkish Fed policy must be disappointed.

The full post can be found here.

Saturday, December 10, 2022

The stealth change in market leadership you may have missed

It's time to conduct one of my periodic market leadership reviews. The review will be done through different viewpoints, starting from the top from an asset lens, a global equity lens, and finally through a factor, or style, lens.

The primary tool for my analysis is the Relative Rotation Graph, or RRG chart, which is a way of depicting the changes in leadership in different groups, such as sectors, countries or regions, or market factors. The charts are organized into four quadrants. The typical group rotation pattern occurs in a clockwise fashion. Leading groups (top right) deteriorate to weakening groups (bottom right), which then rotate to lagging groups (bottom left), which change to improving groups (top left), and finally completes the cycle by improving to leading groups (top right) again. All of the RRG analysis is conducted in USD and therefore includes all currency effects in the returns.

The benchmark for the asset RRG analysis is the Vanguard Balanced Index Fund (VBINX). It shows leadership by virtually all equities except China. Non-US bonds are in the improving quadrant. EM equities are only in the improving quadrant, dragged down by China in the lagging quadrant, which also contains US large-cap growth and Treasuries.


The full post can be found here.

Wednesday, December 7, 2022

Making sense of the market's risk reversal

Mid-week market update: So much for the S&P 500 testing the 200 dma and falling trend line resistance. The index reached its resistance zones late last week and pulled back to test a key support level.


What's puzzling is the lack of a fundamental driver for the market weakness. While I have been cautious, this kind of market action even surprised me.

The full post can be found here.

Sunday, December 4, 2022

Second time lucky, or Fooled me once?

Preface: Explaining our market timing models 
We maintain several market timing models, each with differing time horizons. The "Ultimate Market Timing Model" is a long-term market timing model based on the research outlined in our post, Building the ultimate market timing model. This model tends to generate only a handful of signals each decade.

The Trend Asset Allocation Model is an asset allocation model that applies trend-following principles based on the inputs of global stock and commodity prices. This model has a shorter time horizon and tends to turn over about 4-6 times a year. The performance and full details of a model portfolio based on the out-of-sample signals of the Trend Model can be found here.


My inner trader uses a trading model, which is a blend of price momentum (is the Trend Model becoming more bullish, or bearish?) and overbought/oversold extremes (don't buy if the trend is overbought, and vice versa). Subscribers receive real-time alerts of model changes, and a hypothetical trading record of the email alerts is updated weekly here. The hypothetical trading record of the trading model of the real-time alerts that began in March 2016 is shown below.


The latest signals of each model are as follows:
  • Ultimate market timing model: Sell equities*
  • Trend Model signal: Neutral*
  • Trading model: Bearish*
* The performance chart and model readings have been delayed by a week out of respect to our paying subscribers.

Update schedule: I generally update model readings on my site on weekends. I am also on Twitter at @humblestudent and on Mastodon at @humblestudent@toot.community. Subscribers receive real-time alerts of trading model changes, and a hypothetical trading record of those email alerts is shown here.

Subscribers can access the latest signal in real-time here.


Here we go again
Here we go again. A previous "can't miss" breadth thrust indicator of a new bull market just flashed a buy signal. The percentage of S&P 500 above their 50 dma rose from below 5%, which is an oversold extreme, to over 90%, an overbought extreme. Such a breadth had been a buy signal with a 100% success rate until this year. This indicator flashed a buy signal in August, which failed badly and it recycled back to below 5%.


Is this latest buy signal a case of second-time lucky, or fooled me once, shame on you, fooled me twice, shame on me?

The full post can be found here.

Saturday, December 3, 2022

How the World Cup almost unraveled China

The Chinese authorities were stuck between a rock and a hard place. On one hand, COVID caseloads were skyrocketing; on the other hand, after two years of a series of on-again-off-again of lockdowns, it was unsurprising that Chinese citizens, many of them young, got a case of cabin fever and protested the government's COVID policies in a series of nationwide demonstrations. A podcast from the Economist argued that the combination of strict lockdowns and ubiquitous government monitoring led to widespread dissatisfaction.

Two incidents were believed to be the final straws that were the catalysts for the unrest. The first was an apartment fire in the city of Urumqi in western Xinjiang, where 10 people died, in which fire exits were locked because of COVID restrictions that trapped occupants inside, and COVID barriers prevented firefighters from reaching the building. In addition, broadcasts of the World Cup showed numerous unmasked spectators in the stands, which ran counter to the government’s narrative that China was controlling the pandemic much better than the West.


Protests are relatively common in China, but it's rare to see them erupt spontaneously and in different cities. While the authorities appear to have the protests under control, it could be argued that broadcasts of the World Cup were a spark that almost unraveled China.

The full post can be found here.