Sunday, July 31, 2022

In what world is fighting the Fed a good idea?

Preface: Explaining our market timing models 
We maintain several market timing models, each with differing time horizons. The "Ultimate Market Timing Model" is a long-term market timing model based on the research outlined in our post, Building the ultimate market timing model. This model tends to generate only a handful of signals each decade.

The Trend Asset Allocation Model is an asset allocation model that applies trend following principles based on the inputs of global stock and commodity prices. This model has a shorter time horizon and tends to turn over about 4-6 times a year. The performance and full details of a model portfolio based on the out-of-sample signals of the Trend Model can be found here.


My inner trader uses a trading model, which is a blend of price momentum (is the Trend Model becoming more bullish, or bearish?) and overbought/oversold extremes (don't buy if the trend is overbought, and vice versa). Subscribers receive real-time alerts of model changes, and a hypothetical trading record of the email alerts is updated weekly here. The hypothetical trading record of the trading model of the real-time alerts that began in March 2016 is shown below.


The latest signals of each model are as follows:
  • Ultimate market timing model: Sell equities*
  • Trend Model signal: Bearish*
  • Trading model: Neutral*
* The performance chart and model readings have been delayed by a week out of respect to our paying subscribers.

Update schedule: I generally update model readings on my site on weekends and tweet mid-week observations at @humblestudent. Subscribers receive real-time alerts of trading model changes, and a hypothetical trading record of those email alerts is shown here.

Subscribers can access the latest signal in real-time here.


A dovish tone?
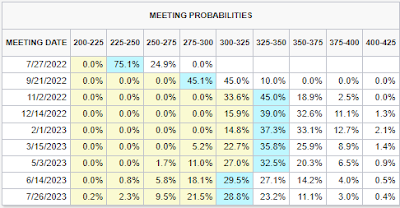
There were few substantial surprises from last week's FOMC decision. However, the market interpreted Powell's statements as slightly dovish. As a consequence, Fed Funds futures began to discount a pause in late 2022 and easing by March 2023, which is a significant change from the expectations before the meeting announcement.

Fed Chair Jerome Powell referred to the June Summary of Economic Projections, or dot plot, in the post-FOMC press conference as "probably the best estimate of where the Committee's thinking is still". The Daily Shot pointed out that the market is massively fighting against the dot plot, which is "a trajectory that looks too dovish, given the broad and entrenched inflationary pressures".


In what world does anyone think that massively fighting the Fed is a good idea?
The full post can be found here.

Saturday, July 30, 2022

Bearishness, begone!

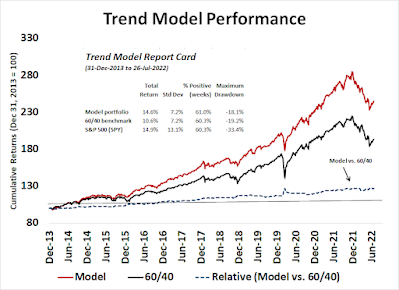
The returns of my Trend Asset Allocation Model have been strong. Based on an "out of sample" record of signals from 2013 and a simulated portfolio that varies up to +/- 20% from a 60/40 benchmark, the model portfolio has managed to achieve equity-like returns with 60/40-like risk. Performance has also been consistently positive in the shorter time frames (to July 26, 2022).
  • 1 year: Model portfolio -8.1% vs. 60/40 -9.8%
  • 2 years: Model portfolio 7.1% vs. 60/40 4.2%
  • 3 years: Model portfolio 10.2% vs. 60/40 7.1%
  • 5 years: Model portfolio 10.9% vs. 60/40 7.8%
   

The Trend Model turned neutral from bullish in January 2022 and turned bearish in March. Amidst all the gloom about a global recession, it's time to become more constructive on equities. The signal has been upgraded to neutral from bearish.

Here's why.

The full post can be found here.

Wednesday, July 27, 2022

Cutting through the noise: Why today's Fed decision doesn't matter

Mid-week market update: It's always difficult to make a stock market comment on FOMC announcement day. Equity prices can exhibit strong reversals after the announcement and press conference. As well, it's also not unusual for the move to reverse itself the next day.

It's not clear whether the 2023 FOMC pattern of weakness into the meeting and a rally afterward will appear again, mainly because the market had been rallying into the July meeting, which is a different pattern than all of the other meetings this year.


I am very conflicted about the short-term direction of stock prices.

The full post can be found here.

Monday, July 25, 2022

FOMC preview: 75 or 100 is the wrong question

Anticipation is building over the FOMC decision, which is scheduled for this coming Wednesday. Leading up to the meeting, there had been growing speculation over whether the Fed would hike by 75 or 100 bps. Market expectations had been oscillating wildly, but it has now settled into a consensus of 75 bps, followed by a pause in late 2022 and rate cuts that begin in mid-2023.


In my opinion, 75 or 100 bps is the wrong question to ask.

The full post can be found here.

Sunday, July 24, 2022

A powerful new bull? Don't be fooled!

Preface: Explaining our market timing models 
We maintain several market timing models, each with differing time horizons. The "Ultimate Market Timing Model" is a long-term market timing model based on the research outlined in our post, Building the ultimate market timing model. This model tends to generate only a handful of signals each decade.

The Trend Asset Allocation Model is an asset allocation model that applies trend following principles based on the inputs of global stock and commodity prices. This model has a shorter time horizon and tends to turn over about 4-6 times a year. The performance and full details of a model portfolio based on the out-of-sample signals of the Trend Model can be found here.


My inner trader uses a trading model, which is a blend of price momentum (is the Trend Model becoming more bullish, or bearish?) and overbought/oversold extremes (don't buy if the trend is overbought, and vice versa). Subscribers receive real-time alerts of model changes, and a hypothetical trading record of the email alerts is updated weekly here. The hypothetical trading record of the trading model of the real-time alerts that began in March 2016 is shown below.


The latest signals of each model are as follows:
  • Ultimate market timing model: Sell equities*
  • Trend Model signal: Bearish*
  • Trading model: Neutral*
* The performance chart and model readings have been delayed by a week out of respect to our paying subscribers.

Update schedule: I generally update model readings on my site on weekends and tweet mid-week observations at @humblestudent. Subscribers receive real-time alerts of trading model changes, and a hypothetical trading record of those email alerts is shown here.

Subscribers can access the latest signal in real-time here.


A bullish reversal
In the past month, I have been constructive on US equities in the face of growing doubts about the macro and fundamental environment. our cautious optimism had been met with skepticism. Now that the S&P 500 has rallied above a falling channel and regained its 50 dma, the tone on our social media feed has turned more bullish.


While it's nice to feel some vindication, investors shouldn't make the complete about-face from bear to bull just yet.

The full post can be found here.

Saturday, July 23, 2022

Revealed, the secret lives of corporate insiders

Why are stocks rallying? Maybe it's because for much of this year, corporate insiders have been stepping up to buy dips in the stock market. The purchases have occurred in the face of growing recession risk and apparent challenging valuations.


What does this group of "smart investors" know that we ordinary mortals don't? An analysis of valuation and the technical backdrop reveals some pockets of value in the US equity market.

The full post can be found here.

Wednesday, July 20, 2022

An FOMC market nosedive ahead?

Mid-week market update: I recently identified a 2022 market formation where the S&P 500 declines into an FOMC meeting and rallies afterward. The key question for investors is whether the same pattern will repeat itself for the July meeting. If so, the market should top out about now.


Here are the bull and bear cases.

The full post can be found here.

Sunday, July 17, 2022

Three catalysts that could spark a rip-your-face-off rally

Preface: Explaining our market timing models 
We maintain several market timing models, each with differing time horizons. The "Ultimate Market Timing Model" is a long-term market timing model based on the research outlined in our post, Building the ultimate market timing model. This model tends to generate only a handful of signals each decade.

The Trend Asset Allocation Model is an asset allocation model that applies trend following principles based on the inputs of global stock and commodity prices. This model has a shorter time horizon and tends to turn over about 4-6 times a year. The performance and full details of a model portfolio based on the out-of-sample signals of the Trend Model can be found here.


My inner trader uses a trading model, which is a blend of price momentum (is the Trend Model becoming more bullish, or bearish?) and overbought/oversold extremes (don't buy if the trend is overbought, and vice versa). Subscribers receive real-time alerts of model changes, and a hypothetical trading record of the email alerts is updated weekly here. The hypothetical trading record of the trading model of the real-time alerts that began in March 2016 is shown below.


The latest signals of each model are as follows:
  • Ultimate market timing model: Sell equities*
  • Trend Model signal: Bearish*
  • Trading model: Neutral*
* The performance chart and model readings have been delayed by a week out of respect to our paying subscribers.

Update schedule: I generally update model readings on my site on weekends and tweet mid-week observations at @humblestudent. Subscribers receive real-time alerts of trading model changes, and a hypothetical trading record of those email alerts is shown here.

Subscribers can access the latest signal in real-time here.


A resilient market
The US stock market has been surprisingly resilient in the face of bad news. The pattern has been the same on Wednesday and Thursday. Futures opened the day deeply negative, first on a hot CPI print Wednesday and a hot PPI print and earnings disappointment Thursday, but rallied over the day to erase most, if not all of the previous losses. The banks, which kicked off Q2 earnings season, have mostly been disappointing, but it only took one positive surprise to spark Friday's relief rally.


A market that does not react to bad news is a sign of bearish exhaustion. Here are some other catalysts that could spark an unexpected "rip your face off" rally and change the narrative from bearish to bullish.

The full post can be found here.

Saturday, July 16, 2022

How the Fed is acting like a bull in the china shop

The June CPI and PPI reports both came in higher than expectations. The good news is core CPI is decelerating. The bad news is both core sticky price CPI and Owners' Equivalent Rent, which is about one-third of core CPI, are rising rapidly. 


These readings confirm the market's expectations that the Fed will continue to tighten until something breaks. In effect, the Fed is behaving like the proverbial bull in a china shop.

The full post can be found here.

Wednesday, July 13, 2022

How to trade the hot CPI report

Mid-week market update: So much for the Cleveland Fed inflation nowcast which was calling for a tame CPI surprise. The market reacted to the hot CPI print this morning by adopting a risk-off tone, though it recovered later in the day.

For equity investors, keep in mind that the intermediate-term structure of the S&P 500 is a falling channel within the context of a positive RSI divergence.


Here is how I interpret the stock market's outlook.

The full post can be found here.

Sunday, July 10, 2022

China blinked, but can it save the world again?

Preface: Explaining our market timing models 
We maintain several market timing models, each with differing time horizons. The "Ultimate Market Timing Model" is a long-term market timing model based on the research outlined in our post, Building the ultimate market timing model. This model tends to generate only a handful of signals each decade.

The Trend Asset Allocation Model is an asset allocation model that applies trend following principles based on the inputs of global stock and commodity prices. This model has a shorter time horizon and tends to turn over about 4-6 times a year. The performance and full details of a model portfolio based on the out-of-sample signals of the Trend Model can be found here.


My inner trader uses a trading model, which is a blend of price momentum (is the Trend Model becoming more bullish, or bearish?) and overbought/oversold extremes (don't buy if the trend is overbought, and vice versa). Subscribers receive real-time alerts of model changes, and a hypothetical trading record of the email alerts is updated weekly here. The hypothetical trading record of the trading model of the real-time alerts that began in March 2016 is shown below.


The latest signals of each model are as follows:
  • Ultimate market timing model: Sell equities*
  • Trend Model signal: Bearish*
  • Trading model: Neutral*
* The performance chart and model readings have been delayed by a week out of respect to our paying subscribers.

Update schedule: I generally update model readings on my site on weekends and tweet mid-week observations at @humblestudent. Subscribers receive real-time alerts of trading model changes, and a hypothetical trading record of those email alerts is shown here.

Subscribers can access the latest signal in real-time here.


Beijing blinked
It's always the darkest before the dawn. Just as it seemed that the world was about to collapse into a synchronized global recession, Beijing announced that it's considering allowing the sale of 1.5T yuan (USD 220B) in local government bonds earlier than planned to fund infrastructure projects.


Commodities rallied on the news but China related equity markets greeted the announcement with a yawn. Can China rescue the global economy once again?

The full post can be found here.

Saturday, July 9, 2022

What if the market bottomed and no one realized it?

It's stunning how market psychology has changed. In the space of a few months, we've swung from "everyone is bullish" to "everyone is bearish". These results from the BoA Global Fund Manager Survey were done in early June and sentiment has likely deteriorated since then.


The good news is the market is becoming numb to bad news. What if the stock market bottomed and no one actually realized it?

The full post can be found here.

Wednesday, July 6, 2022

Numb to bad news

Mid-week market update: You can tell a lot about the tone of a stock market by the way it reacts to news. The 2s10s yield curve just inverted again, which has been a sign of an impending recession. If history is any guide, yield curve inversions have marked major market tops. The exceptions, shown as pink lines, are the instances when the yield curve just missed an inversion and economic growth continued.


Why hasn't the S&P 500 tanked? The answer seems to be it has become numb to the flood of bad news.

The full post can be found here.

Sunday, July 3, 2022

When does the pain end?

Preface: Explaining our market timing models 
We maintain several market timing models, each with differing time horizons. The "Ultimate Market Timing Model" is a long-term market timing model based on the research outlined in our post, Building the ultimate market timing model. This model tends to generate only a handful of signals each decade.

The Trend Asset Allocation Model is an asset allocation model that applies trend following principles based on the inputs of global stock and commodity prices. This model has a shorter time horizon and tends to turn over about 4-6 times a year. The performance and full details of a model portfolio based on the out-of-sample signals of the Trend Model can be found here.


My inner trader uses a trading model, which is a blend of price momentum (is the Trend Model becoming more bullish, or bearish?) and overbought/oversold extremes (don't buy if the trend is overbought, and vice versa). Subscribers receive real-time alerts of model changes, and a hypothetical trading record of the email alerts is updated weekly here. The hypothetical trading record of the trading model of the real-time alerts that began in March 2016 is shown below.


The latest signals of each model are as follows:
  • Ultimate market timing model: Sell equities*
  • Trend Model signal: Bearish*
  • Trading model: Neutral*
* The performance chart and model readings have been delayed by a week out of respect to our paying subscribers.

Update schedule: I generally update model readings on my site on weekends and tweet mid-week observations at @humblestudent. Subscribers receive real-time alerts of trading model changes, and a hypothetical trading record of those email alerts is shown here.

Subscribers can access the latest signal in real-time here.


Here we go again
June was awful month and 2022 was even worse for investors. The S&P 500 has been falling all year, though it constructively ended the week with a continuing positive 5-week RSI divergence, indicating waning downside momentum.


Where's the bottom? 

The full post can be found here.

Saturday, July 2, 2022

The seven reasons why this cycle is different

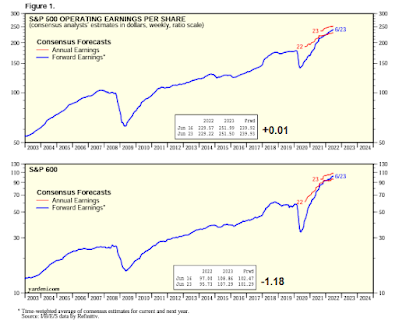
One of the key risks to the stock market is earnings expectations. As recession risk rises, it has been unusual to see forward 12-month EPS estimates continue to rise. The latest update finally shows that earnings expectations are beginning to stall. S&P 500 estimates are flat for the week, up a miniscule 0.01, while small-cap S&P 600 estimates are down over -1% in the week.


Why haven't stock prices skidded further? Here are some reasons why this cycle is different from others.

The full post can be found here.