We maintain several market timing models, each with differing time horizons. The "Ultimate Market Timing Model" is a long-term market timing model based on the research outlined in our post, Building the ultimate market timing model. This model tends to generate only a handful of signals each decade.
The Trend Asset Allocation Model is an asset allocation model that applies trend following principles based on the inputs of global stock and commodity price. This model has a shorter time horizon and tends to turn over about 4-6 times a year. The performance and full details of a model portfolio based on the out-of-sample signals of the Trend Model can bsoe found here.
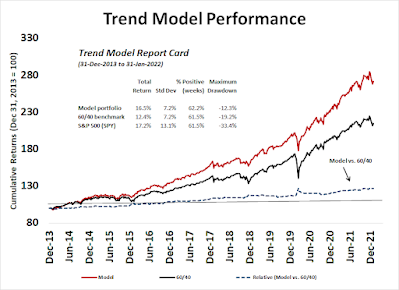
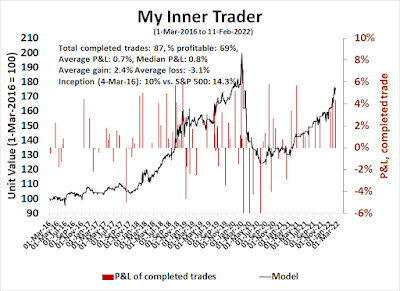
My inner trader uses a trading model, which is a blend of price momentum (is the Trend Model becoming more bullish, or bearish?) and overbought/oversold extremes (don't buy if the trend is overbought, and vice versa). Subscribers receive real-time alerts of model changes, and a hypothetical trading record of the email alerts is updated weekly here. The hypothetical trading record of the trading model of the real-time alerts that began in March 2016 is shown below.

The latest signals of each model are as follows:
- Ultimate market timing model: Buy equities*
- Trend Model signal: Neutral*
- Trading model: Neutral*
Update schedule: I generally update model readings on my site on weekends and tweet mid-week observations at @humblestudent. Subscribers receive real-time alerts of trading model changes, and a hypothetical trading record of those email alerts is shown here.
Subscribers can access the latest signal in real-time here.
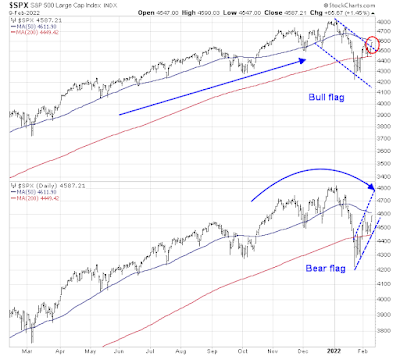
A reversal bottom
Last week, I lamented that the stock market appeared to be fearful, but not panicked. Be careful what you wish for, you might just get it.
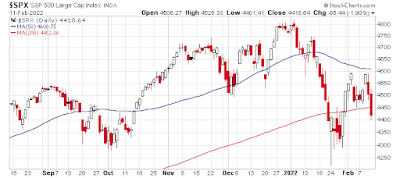
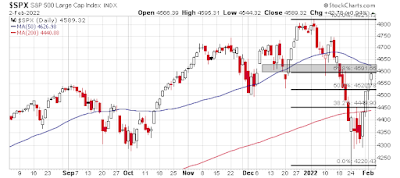
On Wednesday, the S&P 500 violated a key neckline support level of an apparent head and shoulder pattern. On Thursday, the Russian Army crossed into Ukrainian territory and conducted what Putin called a "special military operation". Global markets adopted a risk-off tone and S&P 500 futures were down -2.5% overnight. The index opened deeply in the red but recovered strongly on the day on high volume to form a classic reversal bottom.

If war is what it took, I'll never ask the market gods for panic again.
The full post can be found here.