Preface: Explaining our market timing models We maintain several market timing models, each with differing time horizons. The "
Ultimate Market Timing Model" is a long-term market timing model based on the research outlined in our post,
Building the ultimate market timing model. This model tends to generate only a handful of signals each decade.
The
Trend Asset Allocation Model is an asset allocation model that applies trend following principles based on the inputs of global stock and commodity prices. This model has a shorter time horizon and tends to turn over about 4-6 times a year. The performance and full details of a model portfolio based on the out-of-sample signals of the Trend Model can be found
here.
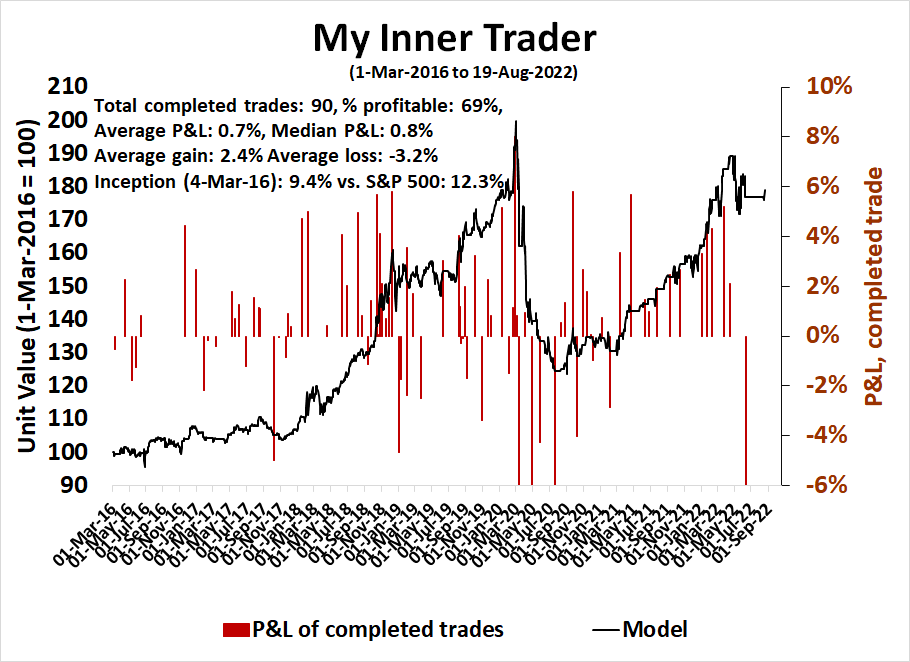
My inner trader uses a
trading model, which is a blend of price momentum (is the Trend Model becoming more bullish, or bearish?) and overbought/oversold extremes (don't buy if the trend is overbought, and vice versa). Subscribers receive real-time alerts of model changes, and a hypothetical trading record of the email alerts is updated weekly
here. The hypothetical trading record of the trading model of the real-time alerts that began in March 2016 is shown below.
The latest signals of each model are as follows:
- Ultimate market timing model: Sell equities*
- Trend Model signal: Neutral*
- Trading model: Neutral*
* The performance chart and model readings have been delayed by a week out of respect to our paying subscribers.Update schedule: I generally update model readings on my
site on weekends and tweet mid-week observations at @humblestudent. Subscribers receive real-time alerts of trading model changes, and a hypothetical trading record of those email alerts is shown
here.
Subscribers can access the latest signal in real-time
here.
Dovish pivot?
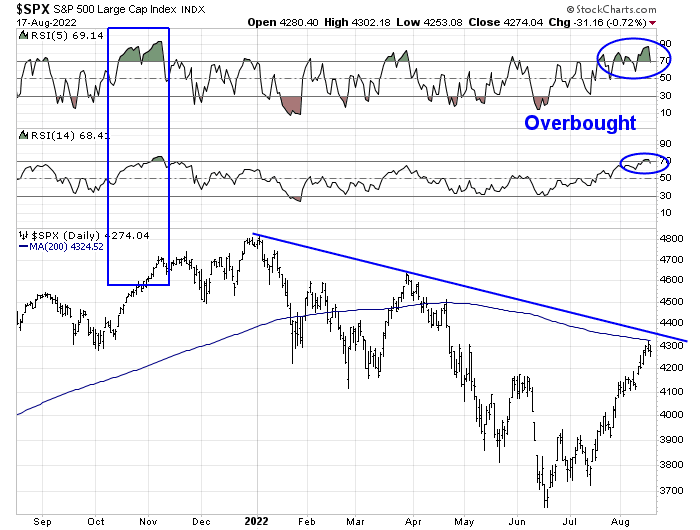
The stock market has taken on a giddy tone in the wake of the tamer than expected inflation reports. The S&P 500 has staged an upside breakout through a key 50% Fibonacci retracement level, which according to some chartists, could be the signal for the all-clear and a resumption of the bull market.
Marketwatch reported that technical analyst Jonathan Krinsky interpreted the upside breakout with guarded optimism:
“Since 1950 there has never been a bear market rally that exceeded the 50% retracement and then gone on to make new cycle lows,” said Jonathan Krinsky, chief market technician at BTIG, in a note earlier this month...
Krinsky, meanwhile, cautioned that previous 50% retracements in 1974, 2004, and 2009 all saw decent shakeouts shortly after clearing that threshold.
“Further, as the market has cheered ‘peak inflation’, we are now seeing a quiet resurgence in many commodities, and bonds continue to weaken,” he wrote Thursday.
My review of market internals shows narrowing leadership which is a warning that the current rally is unsustainable.
The full post can be found
here.