Preface: Explaining our market timing models We maintain several market timing models, each with differing time horizons. The "
Ultimate Market Timing Model" is a long-term market timing model based on the research outlined in our post,
Building the ultimate market timing model. This model tends to generate only a handful of signals each decade.
The
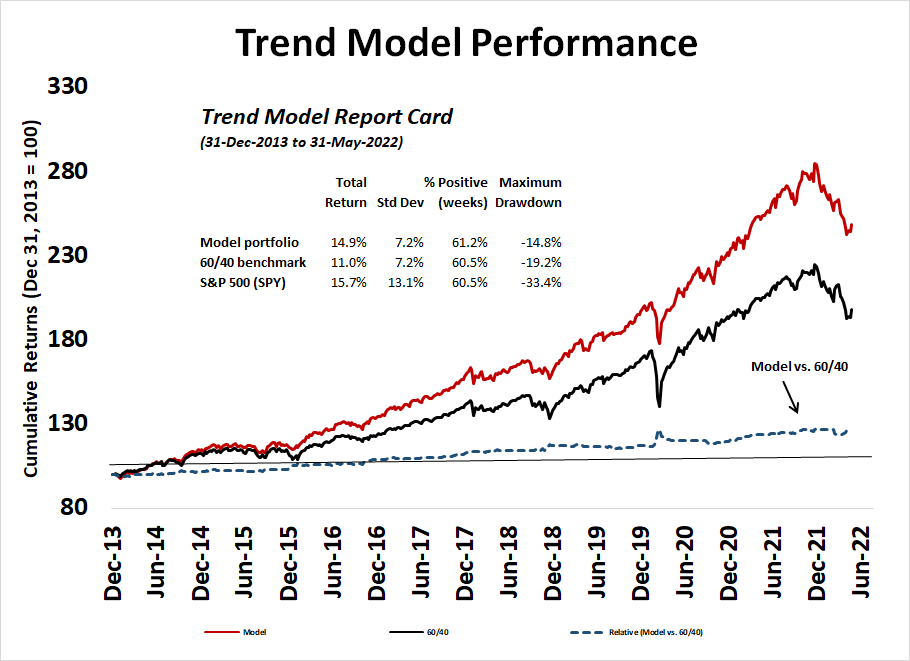
Trend Asset Allocation Model is an asset allocation model that applies trend following principles based on the inputs of global stock and commodity prices. This model has a shorter time horizon and tends to turn over about 4-6 times a year. The performance and full details of a model portfolio based on the out-of-sample signals of the Trend Model can be found
here.
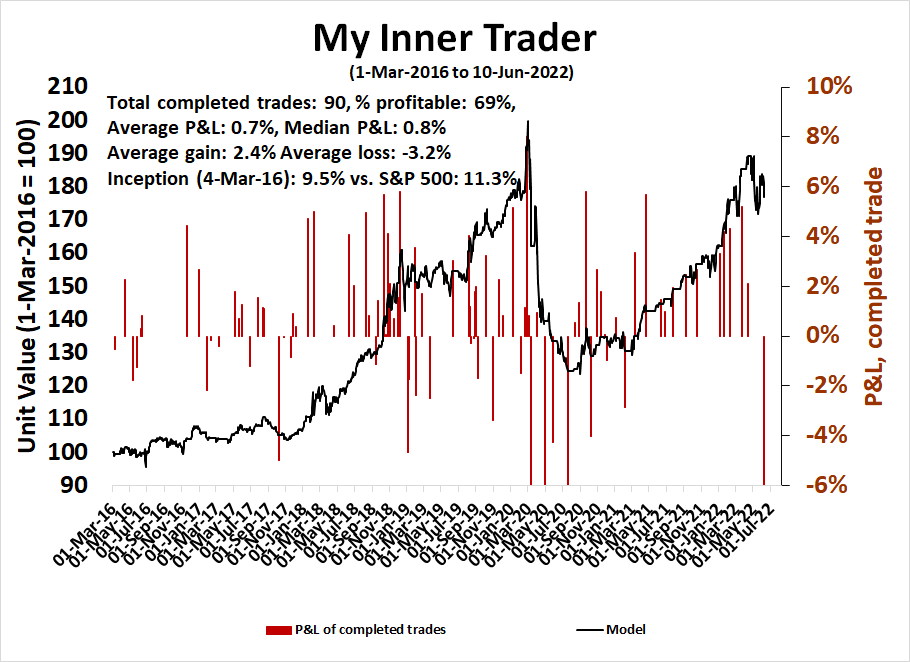
My inner trader uses a
trading model, which is a blend of price momentum (is the Trend Model becoming more bullish, or bearish?) and overbought/oversold extremes (don't buy if the trend is overbought, and vice versa). Subscribers receive real-time alerts of model changes, and a hypothetical trading record of the email alerts is updated weekly
here. The hypothetical trading record of the trading model of the real-time alerts that began in March 2016 is shown below.
The latest signals of each model are as follows:
- Ultimate market timing model: Sell equities*
- Trend Model signal: Bearish*
- Trading model: Bullish*
* The performance chart and model readings have been delayed by a week out of respect to our paying subscribers.Update schedule: I generally update model readings on my
site on weekends and tweet mid-week observations at @humblestudent. Subscribers receive real-time alerts of trading model changes, and a hypothetical trading record of those email alerts is shown
here.
Subscribers can access the latest signal in real-time
here.
Nearing upside targets
I recently outlined several ways of estimating the upside potential of the current market rally. A number of tripwires have been triggered or nearly triggered. While the market may strengthen further, it's time to take some chips off the table.
Firstly, the S&P 500 is nearing initial resistance at the combination of the first Fibonacci resistance level and descending trend line at about 4200.
As well, the S&P 500 Intermediate Term Breadth Oscillator recycled from an oversold to an overbought condition. While overbought markets can become more overbought, it would be prudent to be reducing some risk at these levels.
While these represent cautionary signals, some other indicators are still bullish.
The full post can be found
here.