Wednesday, May 29, 2024
A modest correction ahead?
Sunday, May 26, 2024
How to spot a market top
The Trend Asset Allocation Model is an asset allocation model that applies trend-following principles based on the inputs of global stock and commodity prices. This model has a shorter time horizon and tends to turn over about 4-6 times a year. The performance and full details of a model portfolio based on the out-of-sample signals of the Trend Model can be found here.
My inner trader uses a trading model, which is a blend of price momentum (is the Trend Model becoming more bullish, or bearish?) and overbought/oversold extremes (don't buy if the trend is overbought, and vice versa). Subscribers receive real-time alerts of model changes, and a hypothetical trading record of the email alerts is updated weekly here. The hypothetical trading record of the trading model of the real-time alerts that began in March 2016 is shown below.
The latest signals of each model are as follows:
- Ultimate market timing model: Buy equities (Last changed from “sell” on 28-Jul-2023)*
- Trend Model signal: Bullish (Last changed from “neutral” on 28-Jul-2023)*
- Trading model: Bullish (Last changed from “neutral” on 10-May-2024)*
Update schedule: I generally update model readings on my site on weekends. I am also on X/Twitter at @humblestudent. Subscribers receive real-time alerts of trading model changes, and a hypothetical trading record of those email alerts is shown here.
Subscribers can access the latest signal in real time here.
Bearish Capitulation
Morgan Stanley’s strategist Mike Wilson has been one of the more prominent bears left standing and he capitulated last week. Now that Wilson has reluctantly turned bullish, is it time to turn contrarian bearish on stocks?I can think of two scenarios for the U.S. equity market. The bulls will argue that the market structure of the S&P 500 shows the index has outrun the bullish channel, as defined by the solid lines, and ascended to a steeper channel, as defined by the dotted lines. The advance has been characterized by a series of “good overbought” RSI signals. The bullish scenario opens up a short-term objective of 5500 before the rally is done.
The bears will argue that the combination of the “buy the rumour, sell the news” market reaction to the strong NVIDIA report and the negative divergence on the 5-week RSI is a signal of an exhaustive advance.
Saturday, May 25, 2024
How to buy a company with no money
The Wall Street equivalent of buying a company with no money down is the leveraged buyout, or LBO. The LBO was made possible by the popularization of junk bond, or high yield bond, financings, which was a financial innovation from the 1980s.
It turns out that LBO candidates are relatively rare. They may be the modern deep value equivalent of Ben Graham’s formulation of stocks trading below net-net working capital or current assets minus all debt.
Wednesday, May 22, 2024
Drifting and waiting for the NVIDIA report
Sunday, May 19, 2024
A Trend Asset Allocation Model review
The Trend Asset Allocation Model is an asset allocation model that applies trend-following principles based on the inputs of global stock and commodity prices. This model has a shorter time horizon and tends to turn over about 4-6 times a year. The performance and full details of a model portfolio based on the out-of-sample signals of the Trend Model can be found here.
My inner trader uses a trading model, which is a blend of price momentum (is the Trend Model becoming more bullish, or bearish?) and overbought/oversold extremes (don't buy if the trend is overbought, and vice versa). Subscribers receive real-time alerts of model changes, and a hypothetical trading record of the email alerts is updated weekly here. The hypothetical trading record of the trading model of the real-time alerts that began in March 2016 is shown below.
The latest signals of each model are as follows:
- Ultimate market timing model: Buy equities (Last changed from “sell” on 28-Jul-2023)*
- Trend Model signal: Bullish (Last changed from “neutral” on 28-Jul-2023)*
- Trading model: Bullish (Last changed from “neutral” on 10-May-2024)*
Update schedule: I generally update model readings on my site on weekends. I am also on X/Twitter at @humblestudent. Subscribers receive real-time alerts of trading model changes, and a hypothetical trading record of those email alerts is shown here.
Subscribers can access the latest signal in real time here.
A Trend Model review
This week I review the model’s internals to reveal why I am bullish on equities.
The full post can be found here.
Saturday, May 18, 2024
New highs can beget more new highs
The Dow, S&P 500 and NASDAQ Composite all achieved new all-time highs last week. It is said that there is nothing more bullish than a stock making a new high. This is not a time for caution. Higher stock prices are ahead.
Here are the reasons why I am bullish.
Wednesday, May 15, 2024
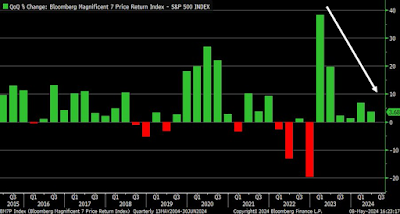
How frothy is the stock market?
Sunday, May 12, 2024
5 reasons you may have not have thought of to be bullish
The Trend Asset Allocation Model is an asset allocation model that applies trend-following principles based on the inputs of global stock and commodity prices. This model has a shorter time horizon and tends to turn over about 4-6 times a year. The performance and full details of a model portfolio based on the out-of-sample signals of the Trend Model can be found here.
My inner trader uses a trading model, which is a blend of price momentum (is the Trend Model becoming more bullish, or bearish?) and overbought/oversold extremes (don't buy if the trend is overbought, and vice versa). Subscribers receive real-time alerts of model changes, and a hypothetical trading record of the email alerts is updated weekly here. The hypothetical trading record of the trading model of the real-time alerts that began in March 2016 is shown below.
The latest signals of each model are as follows:
- Ultimate market timing model: Buy equities (Last changed from “sell” on 28-Jul-2023)*
- Trend Model signal: Bullish (Last changed from “neutral” on 28-Jul-2023)*
- Trading model: Bullish (Last changed from “neutral” on 14-Apr-2024)*
Update schedule: I generally update model readings on my site on weekends. I am also on X/Twitter at @humblestudent. Subscribers receive real-time alerts of trading model changes, and a hypothetical trading record of those email alerts is shown here.
Subscribers can access the latest signal in real time here.
A good overbought advance
The S&P 500 violated a rising trend line in early April and corrected. It appears to have formed a V-shaped bottom and it is resuming its advance by clearing a resistance and volume congestion zone. It’s also exhibiting a series of “good overbought” conditions on the 5-day RSI. The “good overbought” rally will be confirmed if and when the 14-day RSI becomes overbought and stays overbought.
Market internals are pointing to another sustained upleg in stock prices. Here are four other reasons why.
Saturday, May 11, 2024
Beware of the AI hangover
Wednesday, May 8, 2024
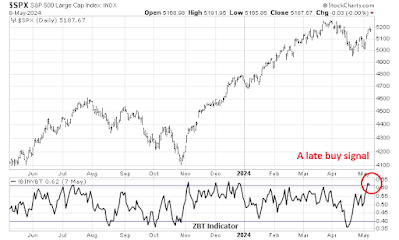
A new breadth thrust buy signal?
Sunday, May 5, 2024
What's driving stock prices right now?
The Trend Asset Allocation Model is an asset allocation model that applies trend-following principles based on the inputs of global stock and commodity prices. This model has a shorter time horizon and tends to turn over about 4-6 times a year. The performance and full details of a model portfolio based on the out-of-sample signals of the Trend Model can be found here.
My inner trader uses a trading model, which is a blend of price momentum (is the Trend Model becoming more bullish, or bearish?) and overbought/oversold extremes (don't buy if the trend is overbought, and vice versa). Subscribers receive real-time alerts of model changes, and a hypothetical trading record of the email alerts is updated weekly here. The hypothetical trading record of the trading model of the real-time alerts that began in March 2016 is shown below.
The latest signals of each model are as follows:
- Ultimate market timing model: Buy equities (Last changed from “sell” on 28-Jul-2023)*
- Trend Model signal: Bullish (Last changed from “neutral” on 28-Jul-2023)*
- Trading model: Bullish (Last changed from “neutral” on 16-Apr-2024)*
Update schedule: I generally update model readings on my site on weekends. I am also on X/Twitter at @humblestudent. Subscribers receive real-time alerts of trading model changes, and a hypothetical trading record of those email alerts is shown here.
Subscribers can access the latest signal in real time here.
Key drivers
What are the key drivers of stock prices? There are some factors to keep an eye on:- Interest rates;
- Geopolitical risk; and
- The earnings outlook.
Saturday, May 4, 2024
Value or growth? Here's an analytical framework for decision making
Does that mean you should continue to bet on growth investing or are value stocks about to have their day? Here an analytical framework to think about the value/growth paradigm.
Wednesday, May 1, 2024
Macro events have been big nothingburgers
The full post can be found here.


