Wednesday, March 29, 2023

How greedy should you be during this rally?

Mid-week market update: There is an adage on Wall Street, "Bulls, make money, bears make money, hogs just get slaughtered." I issued a tactical buy signal to subscribers on the weekend based on my usually reliable S&P 500 Intermediate-Term Breadth Momentum Oscillator (ITBM). ITBM flashed a buy signal as of the close on Friday when its 14-day RSI recycled from oversold to neutral.


Now that the stock market is rallying, how greedy should you be? One guideline to consider is, after an ITBM buy signal, the percentage of S&P 500 above their 20 dma generally reaches at least 60%, if not more, before the rally peters out. (Note one-day data delay on % above 20 dma).

The full post can be found here.


Sunday, March 26, 2023

A Fed Put of a different kind

Preface: Explaining our market timing models 
We maintain several market timing models, each with differing time horizons. The "Ultimate Market Timing Model" is a long-term market timing model based on the research outlined in our post, Building the ultimate market timing model. This model tends to generate only a handful of signals each decade.

The Trend Asset Allocation Model is an asset allocation model that applies trend-following principles based on the inputs of global stock and commodity prices. This model has a shorter time horizon and tends to turn over about 4-6 times a year. The performance and full details of a model portfolio based on the out-of-sample signals of the Trend Model can be found here.

My inner trader uses a trading model, which is a blend of price momentum (is the Trend Model becoming more bullish, or bearish?) and overbought/oversold extremes (don't buy if the trend is overbought, and vice versa). Subscribers receive real-time alerts of model changes, and a hypothetical trading record of the email alerts is updated weekly here. The hypothetical trading record of the trading 
model of the real-time alerts that began in March 2016 is shown below.


The latest signals of each model are as follows:
  • Ultimate market timing model: Buy equities*
  • Trend Model signal: Bullish*
  • Trading model: Bullish*
* The performance chart and model readings have been delayed by a week out of respect to our paying subscribers.

Update schedule: I generally update model readings on my site on weekends. I am also on Twitter at @humblestudent and on Mastodon at @humblestudent@toot.community. Subscribers receive real-time alerts of trading model changes, and a hypothetical trading record of those email alerts is shown here.

Subscribers can access the latest signal in real time here.


Market stabilization
Last week, I suggested that one of the key conditions for a sustainable rally is for the KBW Regional Banking Index (KRX) to hold long-term support despite Friday's market jitters over the stability of Deutsche Bank. While KRX has held support, it disappointed the bulls by refusing to rally off the bottom.  We interpret this to mean that market sentiment over the banking crisis has stabilized.


The Fed Put has been activated, but it's a put of a different kind. Investors can return to more mundane matters such as technical and fundamental analysis.
 
The full post can be found here.


Friday, March 24, 2023

Why the dot-plot doesn't matter

It was a closely watched FOMC meeting. The Fed raised rates by a quarter-point, which was widely anticipated, and signaled that it would likely raise another quarter-point before it's done. It was interpreted as a dovish hike. The Fed also  published a Summary of Economic Projections (SEP), also known as the "dot plot". In the end, the "dot plot" wasn't very relevant for two reasons. It was stale by the time it was published, and there was a high degree of uncertainty around the projections.


During these times of uncertainty, what matters more is the Fed's reaction function to financial crises. To address that issue, I have conducted an event study of how the Fed has reacted to shocks and crises in the past in order to estimate the Powell Fed's reaction function.

The full post can be found here.


Wednesday, March 22, 2023

Is the Fed's glass half full, or half empty?

Mid-week market update: Investors and traders have been waiting for the moment of the FOMC announcement and subsequent press conference. How does the Fed respond to the twin challenges of a banking crisi and inflation threat?

John Authers highlighted analysis from Bespoke indicating the market was entering a period of extreme volatility in Fed Funds futures.
The fluctuation of fed funds futures has been so extreme that, since their inception in 1994, the only other months to see such volatility were: January 2001 (when the Fed started to hike); September 2001, month of the 9/11 terrorist attacks; January and October in the crisis year of 2008; and March 2020, when Covid-19 arrived. This is according to an analysis by Bespoke Investment Group. In contrast to the Fed’s current tightening regime, all those months saw the central bank cutting rather than hiking in response to clear crisis conditions. Over the last month, the gap between the highest and lowest fed funds rates that have been predicted stands at 77.5 basis points:

 
The Fed has spoken, It raised rates by a quarter-point and the statement changed from it expects "ongoing increases" to "some additional policy firming may be appropriate in order to attain a stance of monetary policy that is sufficiently restrictive to return inflation to 2 percent over time",
 

The full post can be found here.


Sunday, March 19, 2023

Assessing the technical damage

Preface: Explaining our market timing models 
We maintain several market timing models, each with differing time horizons. The "Ultimate Market Timing Model" is a long-term market timing model based on the research outlined in our post, Building the ultimate market timing model. This model tends to generate only a handful of signals each decade.

The Trend Asset Allocation Model is an asset allocation model that applies trend-following principles based on the inputs of global stock and commodity prices. This model has a shorter time horizon and tends to turn over about 4-6 times a year. The performance and full details of a model portfolio based on the out-of-sample signals of the Trend Model can be found here.

My inner trader uses a trading model, which is a blend of price momentum (is the Trend Model becoming more bullish, or bearish?) and overbought/oversold extremes (don't buy if the trend is overbought, and vice versa). Subscribers receive real-time alerts of model changes, and a hypothetical trading record of the email alerts is updated weekly here. The hypothetical trading record of the trading model of the real-time alerts that began in March 2016 is shown below.


The latest signals of each model are as follows:
  • Ultimate market timing model: Buy equities*
  • Trend Model signal: Bullish*
  • Trading model: Bullish*
* The performance chart and model readings have been delayed by a week out of respect to our paying subscribers.

Update schedule: I generally update model readings on my site on weekends. I am also on Twitter at @humblestudent and on Mastodon at @humblestudent@toot.community. Subscribers receive real-time alerts of trading model changes, and a hypothetical trading record of those email alerts is shown here.

Subscribers can access the latest signal in real time here.


Dodged a bullet
The S&P 500 dodged a technical bullet last week when it successfully tested falling trend line support. Had the trend line been violated, the next major support would have been the 200 wma at about 3730.
 

Even as the bulls breath sighs of relief, they shouldn’t expect a rally to challenge the old highs just yet. The stock market has sustained considerable technical damage. Textbook technical analysis calls for a period of basing before stock prices can rise in a sustainable way.

The full post can be found here.

Saturday, March 18, 2023

Between the Scylla of inflation and Charybdis of financial instability

In response to the recent financial turmoil, Fed Funds futures is discounting a 25 bps hike at next week's FOMC meeting, followed by a brief peak and rapid rate cuts for the rest of the year.


Are those market expectations realistic? How will the Fed navigate between the Scylla of inflation and Charybdis of financial stability and recession?

The full post can be found here.


Wednesday, March 15, 2023

Banking panic: Another GFC or buying opportunity?

Mid-week market update: Just when you thought the Treasury Department, FDIC, and the Fed had the SVB debacle fixed, the market plunged today on the news that the largest shareholder of Credit Suisse had declined to inject further equity into the troubled bank. This is what a bank panic looks like. Financial stocks in the US and Europe are cratering, though they remain stable in China.


Is this another GFC, or a buying opportunity?

The full post can be found here.


Monday, March 13, 2023

Trading the SVB Panic

I know that financial stocks are more than just banks, they include financial conglomerates like American Express, broker-dealers, life and property and casualty insurers, and so on. But mark this day. This will be a financial panic to tell your grandchildren about. As the chart shows, the technical damage to the sector is considerable.


The full post can be found here.


Sunday, March 12, 2023

Will the Fed crash the stock market?

Preface: Explaining our market timing models 
We maintain several market timing models, each with differing time horizons. The "Ultimate Market Timing Model" is a long-term market timing model based on the research outlined in our post, Building the ultimate market timing model. This model tends to generate only a handful of signals each decade.

The Trend Asset Allocation Model is an asset allocation model that applies trend-following principles based on the inputs of global stock and commodity prices. This model has a shorter time horizon and tends to turn over about 4-6 times a year. The performance and full details of a model portfolio based on the out-of-sample signals of the Trend Model can be found here.

My inner trader uses a trading model, which is a blend of price momentum (is the Trend Model becoming more bullish, or bearish?) and overbought/oversold extremes (don't buy if the trend is overbought, and vice versa). Subscribers receive real-time alerts of model changes, and a hypothetical trading record of the email alerts is updated weekly here. The hypothetical trading record of the trading model of the real-time alerts that began in March 2016 is shown below.
  
 
The latest signals of each model are as follows:
  • Ultimate market timing model: Buy equities*
  • Trend Model signal: Bullish*
  • Trading model: Neutral*
* The performance chart and model readings have been delayed by a week out of respect to our paying subscribers.

Update schedule: I generally update model readings on my site on weekends. I am also on Twitter at @humblestudent and on Mastodon at @humblestudent@toot.community. Subscribers receive real-time alerts of trading model changes, and a hypothetical trading record of those email alerts is shown here.

Subscribers can access the latest signal in real time here.


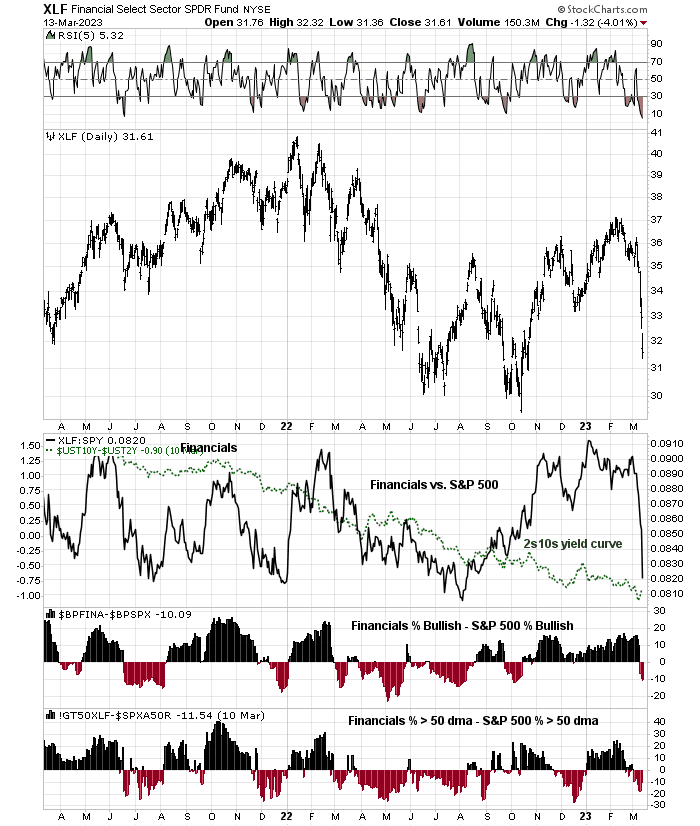
Breaks at key support
A week ago, I wrote that I was bullish on the equity outlook, but the S&P 500 appeared to be extended short-term and the Powell testimony and Jobs Report could be sources of volatility (see China: Global bullish catalyst?). I was right on the volatility as Powell sounded a hawkish tone and the SVB crisis didn't help matters. The S&P 500 violated its key support levels at the 50 dma and 200 dma. In addition, the equal-weighted S&P 500, the mid-cap S&P 400, and the small-cap Russell 2000 all blew through the bottom of descending channels.


Is this the End? Here are the bull and bear cases.
 
The full post can be found here.

Saturday, March 11, 2023

Double-dip recession of 1980-82 = False dawn of 2023?

One of these cyclical indicators is not like the others. While many cyclical industries are in relative uptrends, which is a technical signal of economic expansion, the 2s10s yield curve is deeply inverted and shows few signs of steepening. This is one of those occasions when the stock market and bond markets disagree.
 
 
Which market is right? Maybe they both are.
 
The full post can be found here.

Sunday, March 5, 2023

China: Global bullish catalyst?

Preface: Explaining our market timing models 
We maintain several market timing models, each with differing time horizons. The "Ultimate Market Timing Model" is a long-term market timing model based on the research outlined in our post, Building the ultimate market timing model. This model tends to generate only a handful of signals each decade.

The Trend Asset Allocation Model is an asset allocation model that applies trend-following principles based on the inputs of global stock and commodity prices. This model has a shorter time horizon and tends to turn over about 4-6 times a year. The performance and full details of a model portfolio based on the out-of-sample signals of the Trend Model can be found here.

My inner trader uses a trading model, which is a blend of price momentum (is the Trend Model becoming more bullish, or bearish?) and overbought/oversold extremes (don't buy if the trend is overbought, and vice versa). Subscribers receive real-time alerts of model changes, and a hypothetical trading record of the email alerts is updated weekly here. The hypothetical trading record of the trading model of the real-time alerts that began in March 2016 is shown below.


The latest signals of each model are as follows:
  • Ultimate market timing model: Buy equities*
  • Trend Model signal: Bullish*
  • Trading model: Neutral*
* The performance chart and model readings have been delayed by a week out of respect to our paying subscribers.

Update schedule: I generally update model readings on my site on weekends. I am also on Twitter at @humblestudent and on Mastodon at @humblestudent@toot.community. Subscribers receive real-time alerts of trading model changes, and a hypothetical trading record of those email alerts is shown here.

Subscribers can access the latest signal in real time here.


America the weak?
This chart of the Euro STOXX 50, MSCI China, and S&P 500 (all in USD) tells a story of differing relative strength. The Euro STOXX 50 has been flat since early February the best relative performer. MSCI China has been correcting, but turned up last week when Hong Kong announced that it was eliminating its COVID mask mandate. In addition, China's PMI data came in better than expected, indicating expansion. The S&P 500 topped out mid-February and its bottom lagged both Europe and China.


Let's briefly review the performance and backdrop of each region.

The full post can be found here.


Saturday, March 4, 2023

A tale of two bubbles

It was the best of times. It was the worst of times. The S&P 500 (SPX) remains in a well-defined uptrend, but the NASDAQ 100 (NDX), which represents large-cap growth, violated an uptrend that stretches back to the GFC. The relative performance of the NASDAQ 100 to the S&P 500 shows a similar trend break that’s somewhat reminiscent of the Tech Bubble top of 2000. Moreover, the recent relative performance of speculative growth stocks, as measured by ARK Investment ETF (ARKK), is similar to the post-2000 Bubble bust.
 

The full post can be found here.


Wednesday, March 1, 2023

Why I am constructive on the stock market

Mid-week market update: As the S&P 500 consolidates just below its 50 dma, here are some considerations that make me constructive on the stock market. The index is exhibiting an oversold condition on the percentage of stocks above their 20 dma and a minor positive divergence on the 5-day 

The full post can be found here.