Sunday, September 30, 2018

Quantifying the fallout from a full-scale trade war

Preface: Explaining our market timing models
We maintain several market timing models, each with differing time horizons. The "Ultimate Market Timing Model" is a long-term market timing model based on the research outlined in our post, Building the ultimate market timing model. This model tends to generate only a handful of signals each decade.

The Trend Model is an asset allocation model which applies trend following principles based on the inputs of global stock and commodity price. This model has a shorter time horizon and tends to turn over about 4-6 times a year. In essence, it seeks to answer the question, "Is the trend in the global economy expansion (bullish) or contraction (bearish)?"


My inner trader uses the trading component of the Trend Model to look for changes in the direction of the main Trend Model signal. A bullish Trend Model signal that gets less bullish is a trading "sell" signal. Conversely, a bearish Trend Model signal that gets less bearish is a trading "buy" signal. The history of actual out-of-sample (not backtested) signals of the trading model are shown by the arrows in the chart below. The turnover rate of the trading model is high, and it has varied between 150% to 200% per month.

Subscribers receive real-time alerts of model changes, and a hypothetical trading record of the those email alerts are updated weekly here. The hypothetical trading record of the trading model of the real-time alerts that began in March 2016 is shown below.


The latest signals of each model are as follows:
  • Ultimate market timing model: Buy equities*
  • Trend Model signal: Neutral*
  • Trading model: Bearish*
* The performance chart and model readings have been delayed by a week out of respect to our paying subscribers.

Update schedule: I generally update model readings on my site on weekends and tweet mid-week observations at @humblestudent. Subscribers receive real-time alerts of trading model changes, and a hypothetical trading record of the those email alerts is shown here.


A complacent market
The latest BAML Fund Manager Survey shows that the biggest tail risk is a trade war, followed by a China slowdown. In reality, both are related because the risk of a China slowdown is heightened by the Sino-American trade war.


At the same time, the US trade deficit is rising, and so are trade tensions.


It is therefore a puzzle why the market has largely been shrugging off the threat of rising protectionism.

The full post can be found at our new site here.

Wednesday, September 26, 2018

Everyone expects Mr. Bond to die

Mid-week market update: For a change, I thought it was more appropriate to write about bond yields instead of the usual tactical trading commentary about stock prices on this FOMC day.

Increasingly, there has been more and more bearish calls for bond prices (and bullish calls for bond yields) as the Fed continues its rate normalization program. Some analysts have pointed out a nascent inverse head and shoulders formation on the 30-year yield (TYX). With the caveat that head and shoulders formations are never complete until the neckline is broken, a decisive upside breakout in TYX would be bad news for long Treasury prices.


I would argue against an overly bearish view for bonds. At a minimum, bond yields are unlikely to rise as much as expected, and they may actually decline slightly from current levels.

The full post can be found at our new site here.

Monday, September 24, 2018

When should you buy gold?

Goldbugs got excited recently when the gold stock to gold ratio turned up sharply after the gold price consolidated sideways subsequent to breaking up from a downtrend. Past episodes have been bullish signals for bullion prices.


On the other hand, the front page of Barron's may also be a contrarian magazine cover bearish signal.


What should you do?

The full post can be found at our new site here.

Sunday, September 23, 2018

FOMC preview: Prepare for the hawkish surprise

Preface: Explaining our market timing models
We maintain several market timing models, each with differing time horizons. The "Ultimate Market Timing Model" is a long-term market timing model based on the research outlined in our post, Building the ultimate market timing model. This model tends to generate only a handful of signals each decade.

The Trend Model is an asset allocation model which applies trend following principles based on the inputs of global stock and commodity price. This model has a shorter time horizon and tends to turn over about 4-6 times a year. In essence, it seeks to answer the question, "Is the trend in the global economy expansion (bullish) or contraction (bearish)?"


My inner trader uses the trading component of the Trend Model to look for changes in the direction of the main Trend Model signal. A bullish Trend Model signal that gets less bullish is a trading "sell" signal. Conversely, a bearish Trend Model signal that gets less bearish is a trading "buy" signal. The history of actual out-of-sample (not backtested) signals of the trading model are shown by the arrows in the chart below. The turnover rate of the trading model is high, and it has varied between 150% to 200% per month.

Subscribers receive real-time alerts of model changes, and a hypothetical trading record of the those email alerts are updated weekly here. The hypothetical trading record of the trading model of the real-time alerts that began in March 2016 is shown below.


The latest signals of each model are as follows:
  • Ultimate market timing model: Buy equities*
  • Trend Model signal: Neutral*
  • Trading model: Bullish*
* The performance chart and model readings have been delayed by a week out of respect to our paying subscribers.

Update schedule: I generally update model readings on my site on weekends and tweet mid-week observations at @humblestudent. Subscribers receive real-time alerts of trading model changes, and a hypothetical trading record of the those email alerts is shown here.


Hawkish surprise ahead?
The FOMC is scheduled to meet next week for its September meeting. The market has fully discounted a quarter-point rate hike for the September meeting, and for the upcoming December meeting. Looking ahead to the March 2019 meeting, however, the market isn't fully convinced the Fed will continue its pace of quarter-point rate hikes every three months.


Peering further into the future, the CME's FedWatch tool for the June 2019 meeting shows that the market has only one rate hike penciled in between December and June.


Will the Fed pause as the Fed Funds rates nears neutral? The market thinks so. But I beg to differ for the following reasons:
  • Inflation pressures are rising, which will force the Fed to focus on its price stability mandate.
  • The Fed governors, including Fed Chair Jerome Powell, have shown little interest in pausing. Other key Fed officials have indicated that they are not afraid of inverting the yield curve.
In other words, prepare for a hawkish surprise from the September FOMC statement.

The full post can be found at our new site here.

Wednesday, September 19, 2018

Surprising conclusions from advanced rotation analysis

Mid-week market update: I have been asked to periodically update my sector leadership analysis as a guide to spot up and coming sector strength. The standard approach is to apply the Relative Rotation Graph (RRG) to the market.

As an explanation, RRG charts are a way of depicting the changes in leadership in different groups, such as sectors, countries or regions, or market factors. The charts are organized into four quadrants. The typical group rotation pattern occurs in a clockwise fashion. Leading groups (top right) deteriorate to weakening groups (bottom right), which then rotates to lagging groups (bottom left), which changes to improving groups (top left), and finally completes the cycle by improving to leading groups (top right) again.

The sector RRG chart shows that Healthcare stocks remain the leading sector. Up and coming sectors are Financial and Industrial stocks, and defensive sector such as Consumer Staples, Utilities, and REITs are starting to lose steam.


However, the recent reclassification of stocks into the newly formed Communication Services sector, which moved high octane names such as Alphabet, Amazon, and Netflix into the sector makes RRG analysis somewhat deceptive. Standard RRG analysis on sectors doesn't tell the entire story. As an alternative, I present a couple of two other ways of rotation analysis for insights for both leadership and market direction.

The full post can be found at our new site here.

Monday, September 17, 2018

How to watch for signs of another Lehman Crisis

It has been 10 years since the Lehman bankruptcy, which became the trigger for the Great Financial Crisis (GFC). The financial press has been full of retrospective stories of what happened, and discussions from key players.

The GFC was an enormous shock to investor confidence. Ever since that event, many investors have been living with the fear that another tail-risk shock to their portfolios, and they have searched for warning signs that another financial crisis is around the corner.

One of the commonly used indicators to measure financial tail-risk are the financial stress risk indicators produced by the Chicago Fed and St. Louis Fed. Right now, readings are relatively benign, as low and negative numbers indicate low levels of financial stress.


New Deal democrat also monitors the Chicago Fed's National Financial Conditions Leverage Subindex as a more sensitive indicator of systemic stress. The readings of this indicator are also relatively benign (low = low stress).


For investors and traders who demand real-time results, there may be even a better way.

The full post can be found at our new site here.

Sunday, September 16, 2018

Is China ready for the next downturn?

Preface: Explaining our market timing models
We maintain several market timing models, each with differing time horizons. The "Ultimate Market Timing Model" is a long-term market timing model based on the research outlined in our post, Building the ultimate market timing model. This model tends to generate only a handful of signals each decade.

The Trend Model is an asset allocation model which applies trend following principles based on the inputs of global stock and commodity price. This model has a shorter time horizon and tends to turn over about 4-6 times a year. In essence, it seeks to answer the question, "Is the trend in the global economy expansion (bullish) or contraction (bearish)?"


My inner trader uses the trading component of the Trend Model to look for changes in the direction of the main Trend Model signal. A bullish Trend Model signal that gets less bullish is a trading "sell" signal. Conversely, a bearish Trend Model signal that gets less bearish is a trading "buy" signal. The history of actual out-of-sample (not backtested) signals of the trading model are shown by the arrows in the chart below. The turnover rate of the trading model is high, and it has varied between 150% to 200% per month.

Subscribers receive real-time alerts of model changes, and a hypothetical trading record of the those email alerts are updated weekly here. The hypothetical trading record of the trading model of the real-time alerts that began in March 2016 is shown below.


The latest signals of each model are as follows:
  • Ultimate market timing model: Buy equities*
  • Trend Model signal: Neutral*
  • Trading model: Bearish*
* The performance chart and model readings have been delayed by a week out of respect to our paying subscribers.

Update schedule: I generally update model readings on my site on weekends and tweet mid-week observations at @humblestudent. Subscribers receive real-time alerts of trading model changes, and a hypothetical trading record of the those email alerts is shown here.


How much runway is left in China's long landing?
The bears have been warning about China's unsustainable debt for years. So far, it has been a "this will not end well" investment story, with no obvious bearish trigger and no time frame for a crisis.


Michael Pettis is one of the few China watchers who have established a time frame for China to resolve its problems. He outlined a scenario four years ago where China would not crash, but experience a "long landing" where growth gradually decelerates. Pettis elaborated on his best case scenario in an email to me (see Michael Pettis on the risks of the long landing scenario):
My "best-case" rebalancing scenario, as I think you know, consists of an upper limit to average GDP growth of 3-4% over the presumed decade of President Xi's administration (2013-23), driven by growth in household income of 5-7% and commensurate growth in household consumption. Although when it comes to China I have been the big, bad bear for so long that perhaps I tend to want to understate my pessimism, I nonetheless always try to remind my clients, sometimes not very loudly if I am in a public forum, that this is not my expected "most likely outcome".
He went on to elaborate that his best guess is the current pace of credit growth was only sustainable until 2017-2018:
My guess (and it is only a guess), is that China can continue the current pace of credit growth for another 3-4 years at most, after which it cannot grow credit fast enough both to roll over what Hyman Minsky suggested was likely to be exponential growth in unrecognized bad debt (and WMP and other shadow banking assets will almost certainly be absorbed into the formal banks), and to provide enough new lending to fund further economic activity. If there is less time, as I think Anne Stevenson might argue, or if Beijing cannot get credit and rebalancing under control before then, I think we can probably assume my "orderly long landing" scenario is less likely.
Here we are, four years later. How is China managing its long landing?

The full post can be found at our new site here.


Wednesday, September 12, 2018

Short-term bullish, long-term cautious

Mid-week market update: There are a number of signs that the pullback that began in late August has run its course. These conditions makes me short-term bullish, but I remain longer term cautious on equities.

The market's recent action of a correction to test its breakout level turned support is constructive. The index pulled back to form a bull flag, which is a bullish continuation pattern. It staged an upside breakout out of the flag this week, which suggests that the index may be poised for a test of its previous highs.


The full post can be found at our new site here.

Tuesday, September 11, 2018

Tech as the canary in the coalmine

Technology stocks have been on a tear in the last couple of years. Indeed, both the Tech sector and the Tech heavy NASDAQ 100 has been market leaders.


Tech earnings have surged in this cycle. By contrast, non-Tech earnings appear to be at or near a cyclical peak.


Can it continue?

The full post can be found at our new site here.

Sunday, September 9, 2018

Red sky in the morning

Preface: Explaining our market timing models
We maintain several market timing models, each with differing time horizons. The "Ultimate Market Timing Model" is a long-term market timing model based on the research outlined in our post, Building the ultimate market timing model. This model tends to generate only a handful of signals each decade.

The Trend Model is an asset allocation model which applies trend following principles based on the inputs of global stock and commodity price. This model has a shorter time horizon and tends to turn over about 4-6 times a year. In essence, it seeks to answer the question, "Is the trend in the global economy expansion (bullish) or contraction (bearish)?"


My inner trader uses the trading component of the Trend Model to look for changes in the direction of the main Trend Model signal. A bullish Trend Model signal that gets less bullish is a trading "sell" signal. Conversely, a bearish Trend Model signal that gets less bearish is a trading "buy" signal. The history of actual out-of-sample (not backtested) signals of the trading model are shown by the arrows in the chart below. The turnover rate of the trading model is high, and it has varied between 150% to 200% per month.

Subscribers receive real-time alerts of model changes, and a hypothetical trading record of the those email alerts are updated weekly here. The hypothetical trading record of the trading model of the real-time alerts that began in March 2016 is shown below.


The latest signals of each model are as follows:
  • Ultimate market timing model: Buy equities*
  • Trend Model signal: Neutral*
  • Trading model: Bearish*
* The performance chart and model readings have been delayed by a week out of respect to our paying subscribers.

Update schedule: I generally update model readings on my site on weekends and tweet mid-week observations at @humblestudent. Subscribers receive real-time alerts of trading model changes, and a hypothetical trading record of the those email alerts is shown here.


Global slowdown in progress
There is an adage among the nautical set:
Red sky at night, sailor`s delight
Red sky in the morning, sailors take warning
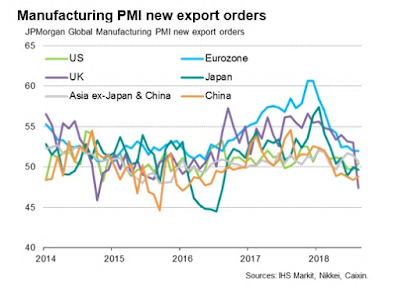
In the global economy, there are signs of a red sky in the morning. Last week, IHS Markit highlighted falling global manufacturing PMI.


Stagnant growth can be attributed to a slowdown in export orders in every major region of the world. In particular, the export order components of the UK, Japan, China, and much of Asia are below 50, indicating negative growth.

The global trade slowdown is confirmed by the OECD, which is a sign that the trade war is starting to bite.


Let's take a tour around the world and see how the global economy is progressing.

The full post can be found at our new site here.

Wednesday, September 5, 2018

The Dollar tail wagging the market dog

Mid-week market update: Here at Humble Student of the Markets, we believe that investors can gain great insight through the use of inter-market, or cross asset market, analysis. During this period of heightened trade tensions and emerging market stress, it is the US Dollar that is driving risk appetite, and the direction of stock prices.

Indeed, the stock market has weakened whenever the year/year increase in the USD Index has reached 5% or more. If the index were to rally up to about the 96 area this week from Wednesday`s closing level of 95.06, the 5% tripwire will be triggered.


Here are the bull and bear cases.

The full post can be found at our new site here.

Tuesday, September 4, 2018

American confidence with Chinese characteristics?

Ed Yardeni recently highlighted the surge in small business confidence, earnings and employment plans as part of a scenario of what could go right.


Beneath the surface, there were a number of contradictions that were evocative of official Chinese economic statistics.

The full post can be found at our new site here.

Sunday, September 2, 2018

The macro risks that keep me awake at night

Preface: Explaining our market timing models
We maintain several market timing models, each with differing time horizons. The "Ultimate Market Timing Model" is a long-term market timing model based on the research outlined in our post, Building the ultimate market timing model. This model tends to generate only a handful of signals each decade.

The Trend Model is an asset allocation model which applies trend following principles based on the inputs of global stock and commodity price. This model has a shorter time horizon and tends to turn over about 4-6 times a year. In essence, it seeks to answer the question, "Is the trend in the global economy expansion (bullish) or contraction (bearish)?"


My inner trader uses the trading component of the Trend Model to look for changes in the direction of the main Trend Model signal. A bullish Trend Model signal that gets less bullish is a trading "sell" signal. Conversely, a bearish Trend Model signal that gets less bearish is a trading "buy" signal. The history of actual out-of-sample (not backtested) signals of the trading model are shown by the arrows in the chart below. The turnover rate of the trading model is high, and it has varied between 150% to 200% per month.

Subscribers receive real-time alerts of model changes, and a hypothetical trading record of the those email alerts are updated weekly here. The hypothetical trading record of the trading model of the real-time alerts that began in March 2016 is shown below.


The latest signals of each model are as follows:
  • Ultimate market timing model: Buy equities*
  • Trend Model signal: Neutral*
  • Trading model: Bearish*
* The performance chart and model readings have been delayed by a week out of respect to our paying subscribers.

Update schedule: I generally update model readings on my site on weekends and tweet mid-week observations at @humblestudent. Subscribers receive real-time alerts of trading model changes, and a hypothetical trading record of the those email alerts is shown here.


What keeps me up at night
Last week, I outlined the technical reasons for my cautious investment outlook (see 10 or more technical reasons to be cautious on stocks), and I promised that I would write about the macro and fundamental headwinds facing the economy and the stock market. These concerns fall into three main categories:
  • The Fed's monetary policy;
  • Trade policy; and
  • Policy fallout from the midterm elections.
The combination of these factors have the potential to really tank economic growth. The latest Fathom Consulting forecast shows recession risk is rising dramatically.


Equally important is the analysis of New Deal democrat, who monitors economic statistics by splitting them into coincident, short leading, and long leading indicators. NDD reported that his set of long leading indicators have turned negative for the second time in three weeks. While he allowed that the data can be noisy, he is not sounding the recession alarm just yet.
[I]n the last month three of the long leading indicators have deteriorated enough to change from positive to neutral or neutral to negative, and a fourth is less than 0.1% away. The sole remaining positives are the Chicago Fed Adjusted Financial Conditions Index and Leverage subindex, and real estate loans. Corporate bonds remain neutral. Several weeks ago they were joined by the yield curve. Treasuries, refinance applications, mortgage rates, and real M2 all remain negative, plus purchase mortgage applications for the third week in a row, and joined for the first time this week by real M1...

I will require two events before this translates into a "recession watch" for over 12 months later: (1) The weekly reports must remain negative consistently for at least one full month, and (2) they must be reflected in a reliable monthly measure where available.
The full post can be found at our new site here.