We maintain several market timing models, each with differing time horizons. The "Ultimate Market Timing Model" is a long-term market timing model based on the research outlined in our post, Building the ultimate market timing model. This model tends to generate only a handful of signals each decade.
The Trend Asset Allocation Model is an asset allocation model that applies trend-following principles based on the inputs of global stock and commodity prices. This model has a shorter time horizon and tends to turn over about 4-6 times a year. The performance and full details of a model portfolio based on the out-of-sample signals of the Trend Model can be found here.

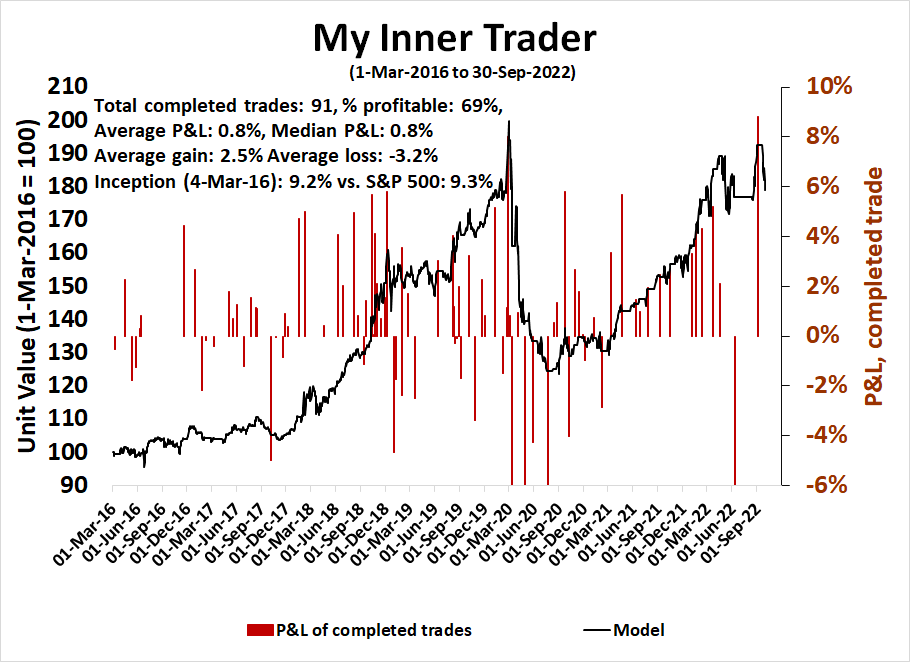
My inner trader uses a trading model, which is a blend of price momentum (is the Trend Model becoming more bullish, or bearish?) and overbought/oversold extremes (don't buy if the trend is overbought, and vice versa). Subscribers receive real-time alerts of model changes, and a hypothetical trading record of the email alerts is updated weekly here. The hypothetical trading record of the trading model of the real-time alerts that began in March 2016 is shown below.

The latest signals of each model are as follows:
- Ultimate market timing model: Sell equities*
- Trend Model signal: Neutral*
- Trading model: Bullish*
Update schedule: I generally update model readings on my site on weekends and tweet mid-week observations at @humblestudent. Subscribers receive real-time alerts of trading model changes, and a hypothetical trading record of those email alerts is shown here.
Subscribers can access the latest signal in real time here.
Still a single macro trade
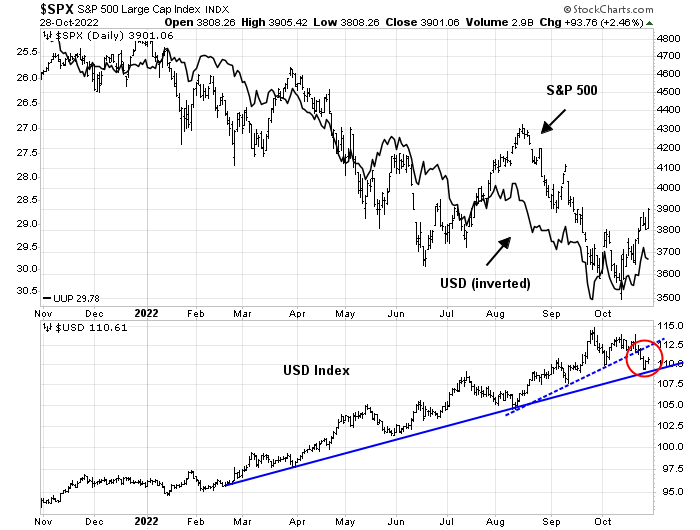
How should investors interpret the recent risk-on episode? It's all still one big macro trade. The S&P 500 continues to be inversely correlated to the USD Index, which is mainly driven by the expectations of a less hawkish Fed. The USD Index helpfully broke down through a minor rising trend line, which is a positive sign for risk appetite.
I call it the Fed Whisperer rally (h/t Walter Deemer).
The full post can be found here.