Wednesday, March 31, 2021

Making sense of the Archegos Affair

Mid-week market update: You can tell a lot about the character of a market by how it reacts to news. In response to the Archegos Affair, the contagion effect has mostly been contained. Other than the share prices of Nomura, Credit Suisse, and the liquidated stocks, the market averages have been steady and this is not a repeat of the Long-Term Capital Management debacle.

Still, there are still nagging doubts about pockets of hidden financial leverage in the banking system. Is there another shoe waiting to drop?


The full post can be found here.

Monday, March 29, 2021

Turkey: Contrarian opportunity or value trap?

It has been a week since Recep Erdoğan`s decision to fire Turkey`s central-bank governor, Naci Agbal, for raising interest rates. Both Turkey`s stock market and currency, the Turkish lira (TRY), have shown some signs of stabilization after a dramatic drop last Monday. However, TRY weakened today but the fall is likely attributable to the fears of a margin call contagion despite a Bloomberg report that the new central bank governor's refused to commit to an interest cut.

Turkish central bank Governor Sahap Kavcioglu said markets shouldn’t take for granted that he’ll cut interest rates as soon as April, when he sets monetary policy for the first time since his surprise appointment.

“I do not approve a prejudiced approach to MPC decisions in April or the following months, that a rate cut will be delivered immediately,” Kavcioglu said in a written response to questions emailed by Bloomberg News, referring to monetary policy committee meeting next month.

“In the new period, we will continue to make our decisions with a corporate monetary policy perspective to ensure a permanent fall in inflation. In this respect, we will also monitor the effects of the policy steps taken so far,” Kavcioglu said.

From an equity perspective, the MSCI Turkey ETF (TUR) is oversold and it is testing a key relative support level.


Do Turkish stocks represent a contrarian buying opportunity or a value trap?

The full post can be found here.

Sunday, March 28, 2021

Will portfolio rebalancing sink equities?

Preface: Explaining our market timing models 
We maintain several market timing models, each with differing time horizons. The "Ultimate Market Timing Model" is a long-term market timing model based on the research outlined in our post, Building the ultimate market timing model. This model tends to generate only a handful of signals each decade.

The Trend Asset Allocation Model is an asset allocation model that applies trend following principles based on the inputs of global stock and commodity price. This model has a shorter time horizon and tends to turn over about 4-6 times a year. In essence, it seeks to answer the question, "Is the trend in the global economy expansion (bullish) or contraction (bearish)?"

My inner trader uses a trading model, which is a blend of price momentum (is the Trend Model becoming more bullish, or bearish?) and overbought/oversold extremes (don't buy if the trend is overbought, and vice versa). Subscribers receive real-time alerts of model changes, and a hypothetical trading record of the email alerts are updated weekly here. The hypothetical trading record of the trading model of the real-time alerts that began in March 2016 is shown below.


The latest signals of each model are as follows:
  • Ultimate market timing model: Buy equities*
  • Trend Model signal: Bullish*
  • Trading model: Bullish*
* The performance chart and model readings have been delayed by a week out of respect to our paying subscribers.

Update schedule: I generally update model readings on my site on weekends and tweet mid-week observations at @humblestudent. Subscribers receive real-time alerts of trading model changes, and a hypothetical trading record of those email alerts is shown here.

Subscribers can access the latest signal in real-time here.


Theme du jour: Rebalancing
I had a discussion last week with another investment professional about the possible short-term asset price effects of portfolio rebalancing. Equities had handily beaten fixed income investments during the quarter, and balanced fund managers will have to rebalance their portfolios by selling stocks and buying bonds.


How important is the rebalancing effect? It seems that all the trading desks are talking about it. To add to the confusion, JPMorgan's derivatives analyst Marko Kolanovic put out a research note stating that "there will be no monthly selling, and indeed there could be buying of equities into month-end. A lack of these flows, and broad anticipation of ‘month/quarter-end’ effect, could result in the market moving higher near term, all else equal."

What's the real story?

The full post can be found here.

Saturday, March 27, 2021

Has the reflation trade become too crowded?

In light of last week's partial NASDAQ reversal, I had a number of discussions with readers about whether the reflation trade has become overly consensus and crowded. To be sure, bond prices have become wildly oversold while the cyclically sensitive copper/gold ratio has surged upward and appears extended.


Is the reflation trade, which is another shorthand for cyclical and value stocks, due for a reversal?

The full post can be found here.

Wednesday, March 24, 2021

Year 2 of the bull

Mid-week market update: The equity bull market began about a year ago. Ryan Detrick observed that the second year of past major bulls have averaged gains of 16.9%, though investors should not ignore pullback risk.


The full post can be found here.

Sunday, March 21, 2021

A new trading framework

Preface: Explaining our market timing models 
We maintain several market timing models, each with differing time horizons. The "Ultimate Market Timing Model" is a long-term market timing model based on the research outlined in our post, Building the ultimate market timing model. This model tends to generate only a handful of signals each decade.
The Trend Asset Allocation Model is an asset allocation model that applies trend following principles based on the inputs of global stock and commodity price. This model has a shorter time horizon and tends to turn over about 4-6 times a year. In essence, it seeks to answer the question, "Is the trend in the global economy expansion (bullish) or contraction (bearish)?"

My inner trader uses a trading model, which is a blend of price momentum (is the Trend Model becoming more bullish, or bearish?) and overbought/oversold extremes (don't buy if the trend is overbought, and vice versa). Subscribers receive real-time alerts of model changes, and a hypothetical trading record of the email alerts are updated weekly here. The hypothetical trading record of the trading model of the real-time alerts that began in March 2016 is shown below.


The latest signals of each model are as follows:
  • Ultimate market timing model: Buy equities*
  • Trend Model signal: Bullish*
  • Trading model: Neutral*
* The performance chart and model readings have been delayed by a week out of respect to our paying subscribers.

Update schedule: I generally update model readings on my site on weekends and tweet mid-week observations at @humblestudent. Subscribers receive real-time alerts of trading model changes, and a hypothetical trading record of those email alerts is shown here.

Subscribers can access the latest signal in real-time here.


A tale of two markets
It was the best of times. It was the worst of times. This doesn't happen very often, but the character of the stock market has made an abrupt turn recently, as evidenced by the performance disparity between the S&P 500 and the NASDAQ 100. 

The weekly chart of the S&P 500 shows that it survived a brief corrective scare, but the index went on to fresh highs. By contrast, the growth-heavy NASDAQ 100 is acting like a sick puppy. NDX violated a rising trend line and last week's rally attempt was rejected at the 50 dma level.


The violent change in market character, or leadership, has created a two-tiered market of extreme winners and losers. Traders need to be aware of this shift and adjust their analytical framework accordingly.

The full post can be found here.

Saturday, March 20, 2021

The sum of all fears: Inflation! Inflation!

The latest BoA Global Fund Manager Survey shows that respondents believe the biggest tail-risks to be inflation and its effects on the bond market.


Are these worries overblown? How will these concerns affect asset prices?

The full post can be found here.

Wednesday, March 17, 2021

There are no more bulls and bears, here's why

Mid-week market update: If you hadn't known that it was FOMC day, you would have looked at the closing market diary and shrugged. The S&P 500 closed only +0.3% on the day. Beneath the surface, however, a lot has been going on in the past few weeks.

Analysts who try to call the direction of the US equity market are facing an especially difficult time as they are encountering a bewildering array of both bullish and bearish sentiment readings. That's because the stock market has bifurcated into a growth stock market and a value stock market. There is no more single stock market anymore.

This chart of the Russell 1000 Value to Russell 1000 Growth ratio tells the story. After value stocks opened a "Vaccine Monday" runaway gap last November, value stocks have made their way higher against growth stocks. The ratio became extended and exhibited a negative 5-day RSI divergence in early January. Both value and growth stocks proceeded to pull back, with value the underperformer. The ratio exhibited another negative RSI divergence in early March. This time, growth stocks rallied with a vengeance while value stocks were mostly flat. The Russell 1000 Growth Index skidded but recovered and its advance is currently testing technical resistance defined by the 61.8% Fibonacci retracement level.


This account of internal rotation underscores my point that this is a tale of two markets. Indeed, it was the best of times and the worst of time for growth and value. There are no more bulls and bears. You can be a value bull and growth bear, or a growth bull and value bear.

The full post can be found here.

Monday, March 15, 2021

FOMC preview: Dot plot, YCC, and SLR

As the markets remain in risk-on mode, readers should be aware of several lurking risks that may appear from the FOMC meeting. Undoubtedly, Powell will repeat his dovish mantra that the Fed is a long way from neutral and policymakers are focused on the labor market. 


Nevertheless, here is what I am watching:
  • What will the "dot plot" convey about the path of interest rates and how does that differ from market expectations?
  • Will the Fed do anything about the soaring 10-year yield, which has risen above 1.6%, i.e. yield curve control (YCC)?
  • What will happen to the Supplementary Leverage Ratio (SLR), and will the banks get SLR relief after March 31?
The full post can be found here.

Sunday, March 14, 2021

Here comes the recovery

Preface: Explaining our market timing models

We maintain several market timing models, each with differing time horizons. The "Ultimate Market Timing Model" is a long-term market timing model based on the research outlined in our post, Building the ultimate market timing model. This model tends to generate only a handful of signals each decade.


The Trend Asset Allocation Model is an asset allocation model that applies trend following principles based on the inputs of global stock and commodity price. This model has a shorter time horizon and tends to turn over about 4-6 times a year. In essence, it seeks to answer the question, "Is the trend in the global economy expansion (bullish) or contraction (bearish)?"

My inner trader uses a trading model, which is a blend of price momentum (is the Trend Model becoming more bullish, or bearish?) and overbought/oversold extremes (don't buy if the trend is overbought, and vice versa). Subscribers receive real-time alerts of model changes, and a hypothetical trading record of the email alerts are updated weekly here. The hypothetical trading record of the trading model of the real-time alerts that began in March 2016 is shown below.


The latest signals of each model are as follows:
  • Ultimate market timing model: Buy equities*
  • Trend Model signal: Bullish*
  • Trading model: Bullish*
* The performance chart and model readings have been delayed by a week out of respect to our paying subscribers.

Update schedule: I generally update model readings on my site on weekends and tweet mid-week observations at @humblestudent. Subscribers receive real-time alerts of trading model changes, and a hypothetical trading record of those email alerts is shown here.

Subscribers can access the latest signal in real-time here.


From shutdown to re-opening
About a year ago, the World Health Organization declared the coronavirus a pandemic. Governments around the world shut down their economies and the global economy crashed into a recession. Fast forward a year, fiscal and monetary authorities have responded with unprecedented levels of stimulus, vaccinations are proceeding, caseloads are dropping, and economies are re-opening again.

The Dow Jones Industrials and Transports made new all-time highs last week. That's a Dow Theory buy signal.


Here is how to play the bull market. 

The full post can be found here.

Saturday, March 13, 2021

60/40 resilience in an inflation age

The fiscal and monetary authorities of the developed world are engaged in a great macroeconomic experiment. Governments are spending enormous sums to combat the recessionary effects of the pandemic and central banks are allowing monetary policy to stay loose in order to accommodate the fiscal stimulus. Eventually, inflation and inflation expectations are bound to rise.

Here is what that means for investor portfolios. I recently highlighted a relationship from a Credit Suisse chart indicating that 50/50 balanced fund drawdowns rise during periods when stock-bond correlations are high (see Are you positioned for the post Great Rotation era?). Stock-bond correlations tend to rise during periods of rising inflation expectations. Balanced funds composed of simple stock and bond allocations will therefore experience greater volatility and higher drawdowns. Simply put, fixed-income holdings don't perform well in such environment which lessen their diversification effects against stocks and damage the resilience of balanced fund portfolio to unexpected shocks.


Bloomberg reported that sovereign wealth funds are becoming anxious about the 60/40 portfolio model.
Two of the world’s largest sovereign wealth funds say investors should expect much lower returns going forward in part because the typical balanced portfolio of 60/40 stocks and bonds no longer works as well in the current rate environment.

Singapore’s GIC Pte and Australia’s Future Fund said global investors have relied on the bond market to simultaneously juice returns for decades, while adding a buffer to their portfolio against equity market risks. Those days are gone with yields largely rising.

“Bonds have been in retrospect this gift,” with a 40-year rally that has boosted all portfolios, said Sue Brake, chief investment officer of Australia’s A$218.3 billion ($168.4 billion) fund. “But that’s over,” she added, saying “replacing it is impossible -- I don’t think there’s any one asset class that could replace it.”

Thanks to declining returns from bonds, the model 60/40 portfolio may eke out real returns -- after inflation -- of just 1%-2% a year over the next decade, said Lim Chow Kiat, chief executive officer of GIC. That compares with gains of 6%-8% over the past 30 to 40 years, he said.
Norway, whose SWF is the largest in the world at $1.3 trillion in assets, had already shifted to a 70/30 target asset mix.
Norway’s $1.3 trillion sovereign wealth fund has already made the shift, winning approval to adjust its equity-bond mix to 70/30 in 2017. At the end of last year, it held about 73% in equities, and 25% in bonds.
Inflation expectations will rise in the next market cycle. The only debate is over timing. How can balanced fund investors build resilient portfolios to control risk and enhance returns during such periods?

I have some answers.

The full post can be found here.

Wednesday, March 10, 2021

Growth's dead cat bounce

Mid-week market update: The rebound in the NASDAQ and growth stocks was not a surprise. Value outperformed growth by the most on record last week - and that includes the dot-com crash that began in 2000. 


Make no mistake. Growth stocks are experiencing an unsustainable dead cat bounce.

The full post can be found here.


Tuesday, March 9, 2021

Tech's kryptonite, revealed

In his latest letter to Berkshire Hathaway shareholders, Warren Buffett reported that even Berkshire's largest publicly listed holding is asset-light Apple, and Berkshire is a very asset-heavy company. Its two major holdings are railroad BNSF and electric utility BNE, which has a large capital project to upgrade the electrical transmission grid in the western US, due to be complete in 2030.
Recently, I learned a fact about our company that I had never suspected: Berkshire owns American-based property, plant and equipment – the sort of assets that make up the “business infrastructure” of our country – with a GAAP valuation exceeding the amount owned by any other U.S. company. Berkshire’s depreciated cost of these domestic “fixed assets” is $154 billion. Next in line on this list is AT&T, with property, plant and equipment of $127 billion.
However, he extolled the virtues of asset-light platform businesses:
Our leadership in fixed-asset ownership, I should add, does not, in itself, signal an investment triumph. The best results occur at companies that require minimal assets to conduct high-margin businesses – and offer goods or services that will expand their sales volume with only minor needs for additional capital. We, in fact, own a few of these exceptional businesses, but they are relatively small and, at best, grow slowly.
In the past decade, investors have bid up the price of technology stocks, which have been the main beneficiaries of the asset-light platform business model. On a relative basis, technology forward P/E ratios are stretched relative to the S&P 500. 


Recent events have revealed the fatal weakness, or kryptonite, of the asset-light platform company's business model.

The full post can be found here.


Sunday, March 7, 2021

Momentum crashes, market now oversold

 Preface: Explaining our market timing models

We maintain several market timing models, each with differing time horizons. The "Ultimate Market Timing Model" is a long-term market timing model based on the research outlined in our post, Building the ultimate market timing model. This model tends to generate only a handful of signals each decade.

The Trend Asset Allocation Model is an asset allocation model that applies trend following principles based on the inputs of global stock and commodity price. This model has a shorter time horizon and tends to turn over about 4-6 times a year. In essence, it seeks to answer the question, "Is the trend in the global economy expansion (bullish) or contraction (bearish)?"

My inner trader uses a trading model, which is a blend of price momentum (is the Trend Model becoming more bullish, or bearish?) and overbought/oversold extremes (don't buy if the trend is overbought, and vice versa). Subscribers receive real-time alerts of model changes, and a hypothetical trading record of the email alerts are updated weekly here. The hypothetical trading record of the trading model of the real-time alerts that began in March 2016 is shown below.


The latest signals of each model are as follows:
  • Ultimate market timing model: Buy equities*
  • Trend Model signal: Bullish*
  • Trading model: Bullish*
* The performance chart and model readings have been delayed by a week out of respect to our paying subscribers.

Update schedule: I generally update model readings on my site on weekends and tweet mid-week observations at @humblestudent. Subscribers receive real-time alerts of trading model changes, and a hypothetical trading record of those email alerts is shown here.

Subscribers can access the latest signal in real-time here.


Momentum crashes, S&P 500 wobbles
I have been warning for the past few weeks that sentiment was overly frothy and due for a reset. The reset finally began in the last two weeks. The weekly S&P 500 chart shows the index fell, but held a rising trend line support after the 5-week RSI flashed a negative divergence for most of 2021. The high-flying momentum stocks, as represented by the NASDAQ 100 (NDX), were not as fortunate. NDX violated its rising trend line indicating significant technical damage has been done.


At its deepest, the S&P 500 was -5.7% off its all-time highs. The carnage in the high-octane NASDAQ 100 was even worse. That index was off -11.3% on a peak-to-trough basis indicating a definitive loss of growth stock leadership. As Big Tech comprise nearly half of S&P 500 weight, this has important consideration for the overall market direction.

However, the short-term market action indicates an oversold market poised for a relief rally.

The full post can be found here.

Saturday, March 6, 2021

Are you positioned for the post-Great Rotation era?

Is the US stock market in a bubble? Yes and no, according to Ray Dalio of Bridgewater Associates. Using a proprietary technique to create a "bubble indicator", Dalio concluded that "the aggregate bubble gauge is around the 77th percentile today", compared to a 100th percentile reading in 1929 and 2000.


Dalio qualified his analysis with some parts of the market are indeed very bubbly, but others are not.
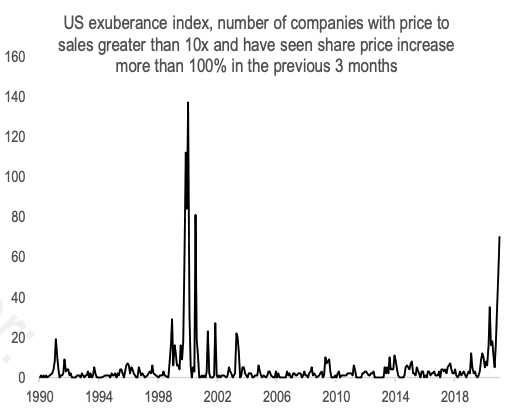
There is a very big divergence in the readings across stocks. Some stocks are, by these measures, in extreme bubbles (particularly emerging technology companies), while some stocks are not in bubbles. 
Credit Suisse came to a similar conclusion with their US Exuberance Index. The number of companies with price-to-sales over 10 have surged, but readings are not at the levels seen during the dot-com peak.


At the same time, the market is undergoing a secular shift from growth to value. Here are some important implications for investor portfolios in the next market cycle.

The full post can be found here.

Wednesday, March 3, 2021

Bond market panic!

Mid-week market update: Is the bond market panic over yet? The 10-year Treasury yield touched a high of 1.6% last week. It fell when the Reserve Bank of Australia began to engage in yield curve control, but it is edging back towards 1.5% again.


Based on this week's market action, I conclude that stock prices have unfinished business, both on the upside and downside.

The full post can be found here.

Monday, March 1, 2021

Q4 earnings: Good news, bad news

With 96% of S&P 500 companies having reported, Q4 earnings season is all but over. For the markets, the earnings reports contained both good news and bad news. 

There was plenty of good news. Both EPS and sales beat rates were well above their historical averages. In addition, consensus earnings estimates have been rising steadily, and forward 12-month EPS estimates have nearly recovered to pre-pandemic levels.


The full post can be found here.