Marketwatch documented a small sample study (n=8) indicating that Santa rallies that began with an advance of 1% or more tended to be strong.
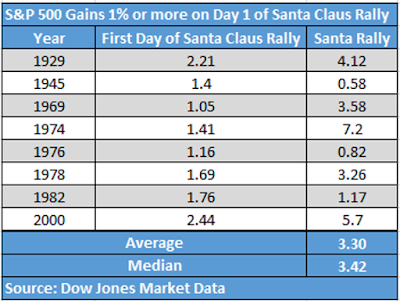
The full post can be found here.
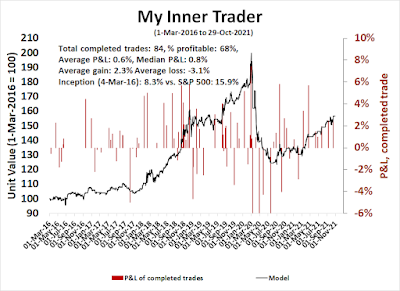
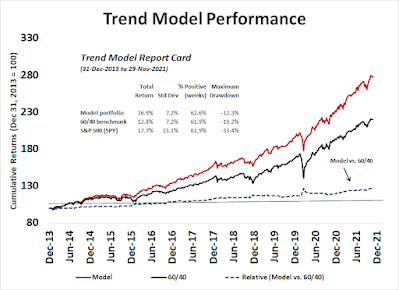
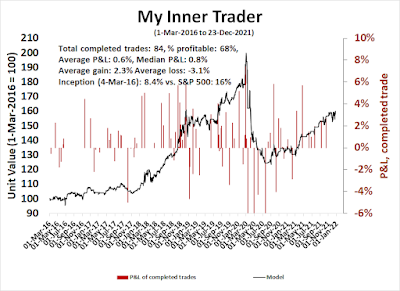
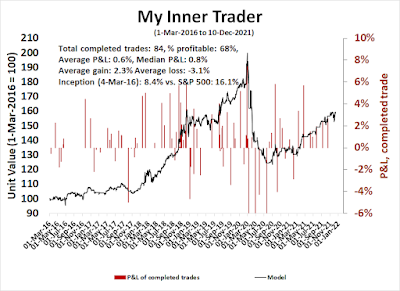
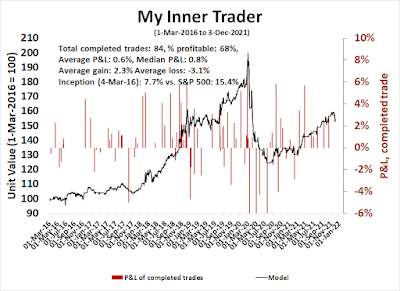
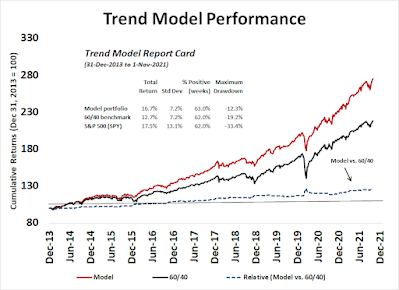
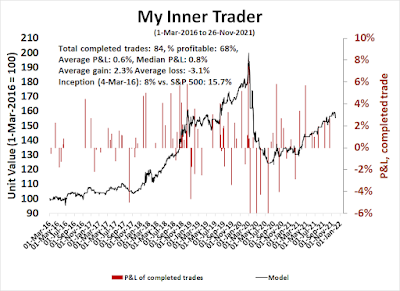
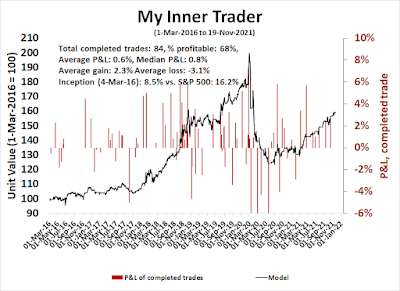
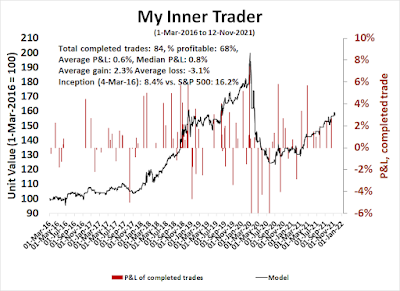
The year 2021 is nearly complete and it's time to issue a report card for my three investment models. Going in order of short to long time horizons, these are:


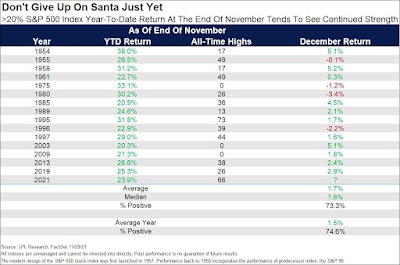
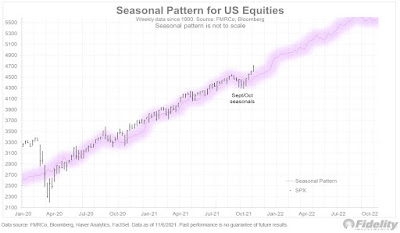
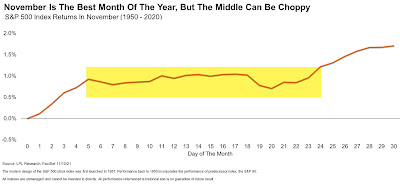
When the S&P 500 is up >20% for the year going into December, the final month of the year is actually stronger than normal.
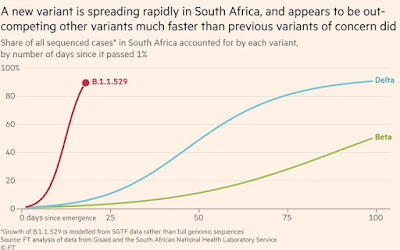
Researchers in South Africa are racing to track the concerning rise of a new variant of the coronavirus that causes COVID-19. The variant harbours a large number of mutations found in other variants, including Delta, and it seems to be spreading quickly across South Africa.A top priority is to follow the variant more closely as it spreads: it was first identified in Botswana this month and has turned up in travellers to Hong Kong from South Africa. Scientists are also trying to understand the variant’s properties, such as whether it can evade immune responses triggered by vaccines and whether it causes more or less severe disease than other variants do.“We’re flying at warp speed,” says Penny Moore, a virologist at the University of Witwatersrand in Johannesburg, whose lab is gauging the variant’s potential to dodge immunity from vaccines and previous infections. There are anecdotal reports of reinfections and cases in vaccinated individuals, but “at this stage it’s too early to tell anything,” Moore adds.“There’s a lot we don’t understand about this variant,” Richard Lessells, an infectious disease physician at the University of KwaZulu-Natal in Durban, South Africa, said at a press briefing organized by South Africa’s health department on 25 November. “The mutation profile gives us concern, but now we need to do the work to understand the significance of this variant and what it means for the response to the pandemic.”


The classic Buy signal is developed as follows: After the low point of a primary downtrend in a Bear market is established, a secondary uptrend (this is the most often debated part of the Theory) bounce will occur. After that, a pullback on one of the averages must exceed 3%, according to Robert Rhea in his 1930's The Dow Theory, must then, ideally, hold above the prior lows on both the Industrial and the Transportation Averages. Finally, a breakout above the previous rally high by both, constitutes a BUY Signal for the developing Bull market.The chart represents how the Dow Jones Industrial Average and the Transportation Average might look under the most usual BUY signal (B-1):


The Fed doesn't want to drop the new framework at the first sign of trouble. The issue of full employment still obstructs the path to rate hikes. If the Fed were to pull tapering forward, the implication would be either the Fed is abandoning its new shiny new framework or that it has redefined full employment. Remember, there is institutional inertia at play here...The new framework sets the Fed apart from its central banking peers that are quickly pivoting in a hawkish direction. Indeed, the new framework is intended to prevent such a pivot, which means that if the Fed were to move in the BoC/BoE/RBA/RBNZ direction, it would amount to abandoning the new framework.
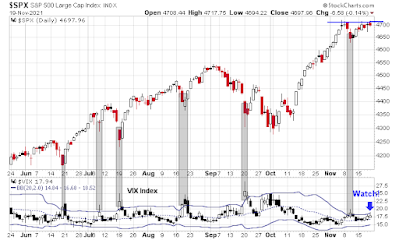
We got a dovish taper, which is what I expected. The 2-year Treasury yield eased in reaction to the FOMC decision and the yield curve steepened.

The full post can be found here.