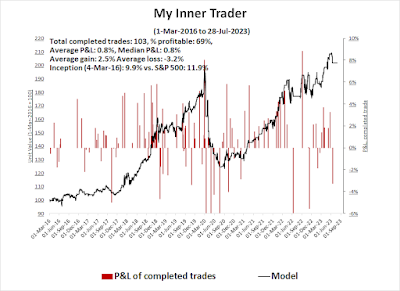
The Trend Asset Allocation Model is an asset allocation model that applies trend-following principles based on the inputs of global stock and commodity prices. This model has a shorter time horizon and tends to turn over about 4-6 times a year. The performance and full details of a model portfolio based on the out-of-sample signals of the Trend Model can be found here.
- Ultimate market timing model: Sell equities (Last changed from “buy” on 26-Mar-2023)*
- Trend Model signal: Neutral (Last changed from “bullish” on 17-Mar-2023)*
- Trading model: Neutral (Last changed from “bearish” on 15-Jun-2023)*
Update schedule: I generally update model readings on my site on weekends. I am also on Twitter at @humblestudent and on Mastodon at @humblestudent@toot.community. Subscribers receive real-time alerts of trading model changes, and a hypothetical trading record of those email alerts is shown here.
Subscribers can access the latest signal in real time here.
A likely buy signal ahead
- Buy when the monthly MACD histogram changes from negative to positive.
- Sell the market exhibits a negative 14-month RSI divergence.
The month isn’t over yet, but when this model is applied to the broadly based NYSE Composite, it is on the verge of a buy signal, with the caveat that it’s never a good idea to front-run model readings. Significant market strength on Monday, which is the month-end, could tip the model reading into buy territory. Otherwise, the model should flash a buy signal in August barring a major pullback.
This model has performed well on an out-of-sample basis. It was timely in flashing a sell signal in late 2018. It bought back into the market in 2019 and sold just as the market topped in early 2020. It turned bullish again in late 2020 and became bearish in early 2022.
The history of past buy signals has usually indicated relatively long-lived bull runs with only minor drawdown risk.
The full post can be found here.


No comments:
Post a Comment