Tuesday, June 9, 2015

What would happen after a "Speech of Hope"?

Greek finance minister Yanis Varoufakis recently penned a Project Syndicate essay in which he challenged German Chancellor Angela Merkel to give a "Speech of Hope" in Greece in the manner of US Secretary of State James Byrnes did in 1946. In that speech, Byrnes' speech signaled an about face in American foreign policy towards Germany by reversing its intention to de-industrialize the conquered and shattered nation:
Byrnes’ speech signaled to the German people a reversal of that punitive de-industrialization drive. Of course, Germany owes its post-war recovery and wealth to its people and their hard work, innovation, and devotion to a united, democratic Europe. But Germans could not have staged their magnificent post-war renaissance without the support signified by the “Speech of Hope.”

Prior to Byrnes’ speech, and for a while afterwards, America’s allies were not keen to restore hope to the defeated Germans. But once President Harry Truman’s administration decided to rehabilitate Germany, there was no turning back. Its rebirth was underway, facilitated by the Marshall Plan, the US-sponsored 1953 debt write-down, and by the infusion of migrant labor from Italy, Yugoslavia, and Greece.
Varoufakis went on to challenge Merkel to deliver a similar "Speech of Hope" and presumably echo the same kinds of policies that America did with Germany in 1946. Varoufakis seems to be very good at evoking the kinds hope that Greece can embark on a growth path to prosperity:
Europe could not have united in peace and democracy without that sea change. Someone had to put aside moralistic objections and look dispassionately at a country locked in a set of circumstances that would only reproduce discord and fragmentation across the continent. The US, having emerged from the war as the only creditor country, did precisely that.
Suppose we were to fantasize for a moment and imagined that Varoufakis got everything he wanted, namely some form of debt relief and a stimulative Marshall Plan. What would happen to Greece under such circumstances?


The Competitive Advantage of Nations
To answer that question, I would use a development economics framework by following the work of Michael Porter, who wrote The Competitive Advantage of Nations, and Jane Jacobs, whose works included The Economy of Cities and Cities and the Wealth of Nations. The ideas of Porter and Jacobs are quite similar. One of Porter's formulas for success is the existence and development of industry clusters, e.g. Silicon Valley, which becomes a hub that spawns industry excellence, development and employment. Jacobs' work more or less says the same thing, except that her unit of development is the city-state instead of Porter`s focus on country-specific development.

Now consider the cases of post-war Germany and Greece today. Even though it was shattered by war, 1946 Germany was endowed with a considerable amount of human capital. The Germans had a tradition of excellence in science and engineering that went back years. As an example, German companies had a technological lead in chemicals in the late 19th and early 20th Century. Today, companies like Bayer and BASF carry on that tradition of German chemistry. The Second World War was marked by German "wonder weapons". It was therefore not a surprise that there was a scramble for former German rocket scientists after the war.

What competitive advantages does Greece have today?

A glance at the chart of GDP per capita (via Ian Bremmer) shows that Greece is one of the poorest regions in the eurozone, with the "rich" eurozone regions being Germany, northern Italy, northern Spain, the Low Countries and Ireland.

Supposing that Greece were to get some form of debt relief and growth stimulus, how could it lever its competitive advantages and get on a growth path?

The Telegraph recently featured a photo essay of the derelict factories of Greece. Perhaps we can see what industries Greece had before its economy cratered. While the photo essay may not entirely be representative of Greek industry, it does give us some idea of what was there. The photos included abandoned plants specializing in:

  • Textiles
  • Building supplies (marble, insulation)
  • Food processing (cooking oil, grains, dry nuts)
None of these are high value-added industries. In particular, textiles manufacturing has been un-competitive in developed countries for years as most of the production has gone to emerging market economies.

With the exception of tourism and limited food processing, Greek industry has few competitive advantages to lever to return to a superior growth path.

There is one other possible competitive advantage that Greece possesses in the form of its geographical location. Various people have suggested that Athens could play the Russian card and perhaps move into Moscow`s orbit. Such a development would be an enormous blow to the EU and NATO. The accusations of "Who lost Greece" would begin. However, I would tend to discount that possibility. Russia had the opportunity to insert itself into the Mediterranean during the Cypriot crisis in 2012 at a far lower cost but declined (see Europe dodges another bullet (not the Catalan election)). Given Russia`s somewhat shaky finances, it is difficult to see how Putin could rescue Greece in a meaningful fashion.


Micro vs. macro solutions
This is the story of a Greek tragedy. Greek tragedies are marked by the clash of good vs. good, where different parties approach a situation with good intentions but end in tragedy.

It is also the story of two parties talking at each other instead of with each other. The Greek approach, which is top-down and macro oriented, rests with the idea that somehow the country can return to sustainable growth if the macro problem of excessive debt were to be lifted (and hopefully coupled with some form of stimulus plan).

By contrast, the (mostly) German plan is highly bottom-up and micro-economic oriented. Its underlying philosophy calls for getting the right market mechanisms in place, e.g. cost structures, labor market reforms, the right incentives, etc., and growth will naturally follow. The problem with this approach is that Greece, unlike countries like Ireland, has few competitive advantages. The EU mandated solution amounts to forced internal devaluation. It would mean that, in the example of textiles, that Greek wages would have to fall even further to levels that competes with the likes of China, Vietnam or Thailand.

Putting it another way, if Greece was a troubled company, Tsipras and Varoufakis believe that it has an over-levered capital structure and could be fixed with an equity injection. Merkel et al believe that it is poor operation and therefore needs to be remedied with better management and business rationalizations. They are both right and both wrong. It is both.

That`s why it`s a tragedy. The problems of Greece are very difficult and possibly intractable. The solution is well beyond my pay grade.

Monday, June 8, 2015

What behavioral finance tell us about the Greek negotiations

How would you like a loan at an interest rate of 600%? What rational person would agree to such terms?

Some do. Here is a screenshot of a local payday loan website:


It turns out that extreme stress makes people act in a less than optimal fashion. I came upon this profile of Sendhil Mullainathan, who is a Harvard professor specializing in behavioral finance. Mullainathan found that poverty makes people behave in a less than rational way:
If the mind is focused on one thing, other abilities and skills—attention, self-control, and long-term planning—often suffer. Like a computer running multiple programs, Mullainathan and Shafir explain, our mental processors begin to slow down. We don’t lose any inherent capacities, just the ability to access the full complement ordinarily available for use.

But what’s most striking—and in some circles, controversial—about their work is not what they reveal about the effects of scarcity. It’s their assertion that scarcity affects anyone in its grip. Their argument: qualities often considered part of someone’s basic character—impulsive behavior, poor performance in school, poor financial decisions—may in fact be the products of a pervasive feeling of scarcity. And when that feeling is constant, as it is for people mired in poverty, it captures and compromises the mind.

This is one of scarcity’s most insidious effects, they argue: creating mindsets that rarely consider long-term best interests. “To put it bluntly,” says Mullainathan, “if I made you poor tomorrow, you’d probably start behaving in many of the same ways we associate with poor people.” And just like many poor people, he adds, you’d likely get stuck in the scarcity trap.
That brings me to the point about payday loans:
Take payday loans, for instance: high-interest loans that provide cash on demand, to be paid back when the borrower’s paycheck arrives. According to Mullainathan and Shafir, in 2006, there were more than 23,000 payday lender branches in the United States— more than all the McDonald’s (12,000) and Starbucks (nearly 9,000) locations combined. It’s a popular way to get money today, particularly for those without bank accounts. But for people without reliable incomes, debts must often roll over into the following month, incurring exorbitant fees. “This type of high-risk borrowing seems ridiculous,” Mullainathan says, but “we wanted to prove that thinking like this doesn’t come from a lack of financial understanding or foolishness—it comes from putting out fires.”
Mullainathan conducted a non-financial experiment that proved his point:
In 2011, in collaboration with Anuj Shah, now assistant professor of behavioral science at the University of Chicago Booth School of Business (then a graduate student at Princeton), they devised a study that they hoped would prove their point, inducing that same high-risk borrowing behavior in Princeton undergraduates by having them play a version of the American TV game show Family Feud.

In the show, contestants are asked to name things that belong to categories—for instance, “Things you might find in a professor’s office.” Unlike regular trivia games that have right and wrong answers, there are no right responses in Family Feud, just popular ones (the list of answers is gathered from a survey of 100 people prior to the show). Because contestants must think through an array of options before answering, time pressure limits the number of paths they can explore before hazarding a guess, so scarcity’s effects are in full bloom.

At Princeton, contestants were randomly split into “rich” and “poor” groups—the rich having more time to guess than the poor. All were given the option to borrow time: each additional second borrowed would cost them two seconds of “interest” deducted from their total time.

“The results mimicked everything we see in the real world,” Mullainathan reports. At first, the poor performed better than the rich did; scarcity made them focus more intently on the task. But when, in the next round, the subjects were allowed to roll over their loans and “repay” in subsequent rounds (thus making future rounds shorter), things quickly fell apart for the poor contestants. Early borrowing created a vicious circle for the poor; pressed for time, they needed to borrow more seconds, and borrowing more made them more pressed for time. By the final rounds, most of their time went to paying back loans, and the poor lost rounds that the rich won handily.

These students were randomly assigned to “poverty,” Mullainathan explains, so there could be nothing substantially different between them and those fellow students labeled “rich.” “The study shows the intimate link between success and failure under scarcity,” he and Shafir write in Scarcity. And scarcity, no matter whom it menaces, inevitably leads to more scarcity.

Greece as an example of poverty
That got me to thinking. The Greek economy has not only tanked, its growth rate parallels that of the American experience during the Great Depression (via Quartz).
That collapse in economic output puts the Greek recession right up there with the worst depressions in recent memory. At its trough in the first quarter of 2014—which was revised lower in today’s report—the decline in Greek GDP was roughly 33% from the peak. That’s actually worse than the US peak-to-trough GDP decline of 27% between 1929 and 1933, during the most acute phase of the Great Depression.

A simple analysis of the numbers doesn't convey the depth of economic depression. Consider these anecdotal accounts of what`s happening in Greece by Sky News economics editor Ed Conway:
The moment the people of Lamia realised things had really hit rock bottom was when the firemen started turning up on their doorsteps.

They went from house to house through the small, sleepy town about 200km north of Athens, knocking on doors and asking for contributions. The brigade’s funding has fallen so far that they now have little option but to go begging for cash.

Some households gave them a few pennies. Some donated odds and ends from their homes. Some even gave them new tyres for their trucks, which had been worn down to destruction. The police have been doing something similar for some time.
And there's this:
It is hard to get a sense of the scale until you look deep into the numbers. Consider the budget for hospitals across the country. In the first four months of last year, they received funding of €670m. In the first four months of this year they received €43m. That’s right: a 94% cut, which makes any austerity you’ve seen elsewhere around the world look piddling.

The director of the Elpis Hospital, Theodoros Giannaros, lost his own son to suicide two weeks ago.

He described how the country had hit "rock bottom".

"People are dying", he added.
His observations are nothing short of astounding:
I’ve been in developing countries facing fiscal and capital market crises. But I've never been in a developed economy like this as it literally runs out of money.

I've never been to a hospital where the director says he is essentially having to treat patients with no money, where people are not able to get treatments because they, and the hospital, can’t afford them.

It is an unsettling experience - made more so by the fact that even those in authority seem next-to-clueless about what is really happening.

Usually when you're covering economics or politics you assume that someone, somewhere knows what's going on and has a plan. Here, with the best will in the world, I simply don’t think there is one.
Could an entire country that is going through an economic depression make its leaders behave and bargain in an "irrational" way, or in a way that is contrary to "normal" behavior?

That seems to be the current position of the Syriza dominated government in Athens, which is: "We are hurting so much that we want the most short-term expedient way to make the pain go away, regardless of the cost."

The interpretation of Alex Andreou of the current round of negotiations between Greece and its creditors is highly revealing. Though what Andreou says has to be taken with a grain of salt as he is highly sympathetic to the Syriza position, the EU-IMF negotiation strategies may need to be reviewed in light of the Mullainathan analytical framework. First and foremost, each side is so focused on its own priorities that it is becoming blind to the other side's needs. Andreou described the EU position this way:
The entrenched position of the players has to do with domestic rather than international policies. The battle between Merkel and Schäuble behind the scenes for leadership of their party before the next German election; the threat Rajoy faces in Spain from Podemos, underlined by recent municipal results; resistance to Dijsselbloem’s programme of ultra-right-wing economic policies in the Netherlands within his own Labour Party; the failure of Renzi to stimulate a stagnating Italian economy; – all these factors, and many besides, play a much bigger part in shaping players’ position towards the Greek crisis, than anything to do with the Greek crisis.
Viewed in this context, the Yanis Varoufakis Project Syndicate essay that pleaded for growth over strangling austerity is similarly tone-deaf to the priorities of Merkel et al.

As well, the creditor institutions should not behave as if Tsipras is just another typical European leader who wants to maintain the status quo:
There was a catastrophically widely held belief among the European establishment that, once elected, Tsipras would “play ball”. There is still palpable shock at his sticking to his election commitments, often expressed as the accusation that he is being unreasonable. Every statement out of EU institutions for the last five months has been practically underlined by the subtext “shit, he wasn’t bluffing”.
Things are so bad (at least for the typical Syriza supporter) that their sensibilities are dulled by threats of dire consequences:
After living on the brink of disaster for so many years, I sense a que-sera-sera attitude in most people. This is not to say they don’t fear capital controls, the threat of Grexit, austerity, hunger, poverty and degradation. It is to say that they have lived with them for so long, they have become an ordinary part of the landscape.
In a separate article, Andreou explained why he voted for Syriza and the reasons sound remarkably like how Mullainathan described how the value system of people who are forced into poverty changes:
Syriza’s supporters were accused of being irrational, were threatened and cajoled not to destroy the country in advertising campaigns of breathtaking negativity. This confirmed in my mind that conventional politics supported the very system that collapsed globally and spectacularly only a few years ago; a system that eschews taxation, but required unprecedented bailouts from taxation; a system that, somehow, has now gone back to being considered infallible, supreme and self-correcting.

I concluded that voting for that would be irrational and that trying something different with Syriza, however risky, made better sense. Dignity might be an abstract concept, but its absence is a very real and practical thing. Stand outside a central Athens supermarket at closing time, to see elderly women, dressed in black, rummaging through bins for food and you will see it. Spend a day with my mother, who worked two jobs for 45 years, paid every cent of tax and now finds herself diagnosed with Alzheimer’s, with no decent health or social provision and a monthly pension of €400 (£300), and she will explain it to you.

Added to this, Syriza gave me a way to voice dissatisfaction with the EU without aiming to dismantle it. To ask for radical change without victimising migrants. As a migrant myself, this was very important to me. It was possible to be pro-EU and still want to punch its current monetarist policies in the face. The EU as a project is very worthwhile. We need to fight for the Europe we want. The idea that what stands between each of us and a life of prosperity is a hypothetical Romanian cleaner is the most ludicrous one we have ever been sold.
In particular pay attention Andreou's comment about ”bringing back dignity” without discussion of the costs, or what is possible under the current circumstances:
The only promise Tsipras made that truly mattered to me was to “give dignity back to the people”. Of course, he cannot deliver that. Only people can deliver that for themselves. But even mention of that word, “dignity”, in a political context, struck an important chord. It was hugely refreshing to have someone speaking that sort of language, instead of tired neoliberal dogma of privatisation equalling efficiency. To start from priorities and then define the method.
The latest polls indicate that Syriza`s popularity has soared since the last election. If an election were to be held today, it would gain a majority and be able to govern without a coalition partner (via Ekathimerini):
According to the poll by Metron Analysis, if elections were held now, 45 percent of Greeks would vote for SYRIZA and 21.4 percent for ND. Such a result would allow SYRIZA, which co-governs with the right-wing Independent Greeks, to rule autonomously. Potami garnered 6.1 percent, followed by Golden Dawn on 4.4 percent, the Communist Party with 4.3 percent, ANEL with 3.2 percent and PASOK falling below the 3 percent threshold to enter Parliament with 2.9 percent. The survey found that 79 percent of Greeks want to stay in the eurozone.
If this is indeed the mood in Athens, then it may be time to pay attention to Mullainathan's work about what motivates the Greeks. Otherwise, each side winds up talking at each other instead of with each other and the entire project goes over a cliff. Leonid Bershidsky put it another way when he said that Greece and its creditors need marriage counselling.


That sounds about right. If I am right in my analytical framework, then the current market-based estimated probability of a Greek default of 38-40% before year-end may be too low (see data and links from Bears wake up, but they're not out of the woods).

Sunday, June 7, 2015

Bears wake up, but they`re not out of the woods

Trend Model signal summary
Trend Model signal: Risk-off (downgrade)
Trading model: Bearish

The Trend Model is an asset allocation model which applies trend following principles based on the inputs of global stock and commodity price. In essence, it seeks to answer the question, "Is the trend in the global economy expansion (bullish) or contraction (bearish)?"

My inner trader uses the trading model component of the Trend Model seeks to answer the question, "Is the trend getting better (bullish) or worse (bearish)?" The history of actual out-of-sample (not backtested) signals of the trading model are shown by the arrows in the chart below. In addition, I have a trading account which uses the signals of the Trend Model. The last report card of that account can be found here.


Update schedule: I generally update Trend Model readings on my blog on weekends and tweet any changes during the week at @humblestudent.


Rising rates = Equity sell-off
Last week, I wrote that from a technical perspective, the US equity market was ready to fall but it lacked a fundamental or macro trigger (see In search of a major bearish trigger). I went on to speculate on possible bearish triggers, namely a growth scare combined with the fear of Fed tightening, Greek default and rising geopolitical tensions in the South China Sea.

I was wrong. Equity markets declined because of rising interest rates. It began when Europe saw higher than expected inflation, which pushed up bund yields. The next day, Mario Draghi didn`t help matters when he said in the post ECB decision press conference that the markets should get used to higher bond market volatility.

William Dudley of the New York Fed also more or less said the same thing in a speech on Friday (emphasis added):
When the FOMC begins to raise short-term interest rates, this will occur in a very different environment than in the past. Reserves in the banking system are very plentiful, reflecting the large increase in the Federal Reserve’s balance sheet over the past few years. But this circumstance should not adversely affect our ability to push the federal funds rate into a higher target range. We have the appropriate tools to push up short-term interest rates. However, lift-off may not go so smoothly in terms of the impact on financial asset prices. After all, lift-off will represent a regime shift after more than six years at the zero lower bound.

More important for financial market asset prices than the precise timing of lift-off is the expected trajectory of short-term rates over the next few years following lift-off. Most likely, this will be a shallow, upward path. Because of the persistent headwinds associated with the recent financial crisis, the level of real short-term interest rates consistent with a neutral monetary policy seems considerably lower now than in the past. And, if potential GDP growth is much lower—due to slower labor force growth and productivity growth—the long-run equilibrium real short-term rate is also likely to remain lower than normal in the future even after those headwinds fully dissipate.

But there must be considerable uncertainty about the path for short-term interest rates. After all, the economic outlook is uncertain. Moreover, the appropriate stance of monetary policy will be influenced by how financial market conditions respond to the Federal Reserve’s actions. All else equal, if financial conditions tighten sharply, then we are likely to proceed more slowly. In contrast, if financial conditions were not to tighten at all or only very little, then—assuming the economic outlook hadn’t changed significantly—we would likely have to move more quickly. In the end, we will adjust the policy stance to support the financial market conditions that we deem are most consistent with our employment and inflation objectives.
As a consequence, 10-year German rates rose to levels above the last Bundegeddon episode and US rates followed. The chart below shows that both US and German rates have risen above a downtrend that went all the way back to January 2014. Both recent rising rate periods, which are shown by the shaded regions, stock prices fell.


An article in the FT suggested that a reversal of the QE trade, in which investors buy risk and search for yield, hasn`t happened yet and there could be a sudden rush for the exits. That`s a recipe for volatility in the bond markets:
“Investors remain trapped in the twilight zone, the transition period between the end of QE and the first rate hike, the start of policy normalisation,” noted one recent research report from Bank of America Merrill Lynch. “The investment backdrop will probably continue to be cursed by mediocre returns, volatile trading rotation, correlation breakdowns and flash crashes.” In addition to that sobering message, Merrill warned of this year’s’ “liquidity paradox”.

“In a world of infinite central bank liquidity, asset markets can suddenly turn extremely illiquid. Reducing risk rather than maximising return is the smarter mid-2015 strategy,” Merrill’s strategists add.

Merrill is right to sound the alarm. Since it is QE that has driven the markets up, it is reasonable to assume that the end of QE and zero rates will trigger a downdraft in the markets in the absence of any fundamental reason to be optimistic about either economic prospects or corporate earnings, especially given the elevated levels at which shares and corporate debt now trade.
So what happens when too many investors try to de-risk at the same time, especially in an era of reduced bond market liquidity?
The combination of a swollen buy side and a shallow sell side could be a formula for a meltdown when managers try to unwind riskier positions. “A sell-off triggered by an unwinding of leverage and magnified by poor liquidity could sink many boats,” BlackRock adds.

A few weeks before the crisis in 1998, it was not clear that Long Term Capital Management was about to blow up either. It is high time for greed to yield to fear.

Global risk-off
The technical damage done by the current rising rates has been widespread. I am seeing a synchronized risk-off across virtually all stock markets around the world and asset classes. The implications of this global move in asset prices is worrisome from an inter-market analytical perspective.

The chart below shows the charts of the SPX, DJ Global Index, Euro STOXX 50 (eurozone) and FTSE 100 (UK). Each and every one of those indices have fallen below its 50 day moving average (dma), indicating a loss of price momentum. In some cases, such as the Euro STOXX 50, the weakness has been more pronounced.


Moving to Asia, the only standout has been the Shanghai market, which seems to exist in its own bubble. The stock markets of China's Asian trading are all struggling. As the chart below shows, most market indices have violated their 50 dma and uptrends. The only exception is the HK Hang Seng Index, which is now testing a key support area and its own 50 dma.


Commodity prices have weakened as well. The charts below show the prices of the cyclically sensitive industrial metals (top panel) and CRB Index (second panel), both of which are weakening. Commodity prices are inversely correlated to USD (bottom panel), so I have shown industrial metals in EUR and AUD. Both of these charts are indicating weakness net of currency effects.


In the US, market internals are tilted bearishly. We are seeing negative divergences in breadth in the form of the equal vs. float weighted SPX (green, top panel) and On Balance Volume (blue, top panel). As well, credit risk appetite continues to roll over (second panel) as I pointed out last week.


However, there are some indications that the bears haven't totally taken control of the tape  The bottom two panels show two breadth metrics, % bullish and % above the 200 dma, as weak but they haven't decisively broken downwards indicating overwhelming bearish momentum.

The Trend Model uses a combination of global equity prices and commodity prices as inputs. The coordinated weakness across all asset classes have caused the Trend Model signal to be downgraded from a "neutral" to a "risk-off" reading.


The bulls fight back
Despite these negatives, the bulls are fighting back. Sector internals have started to improve. In particular, the performance of high-beta groups and cyclically sensitive groups like semiconductors were all in relative uptrends.


That said, Dana Lyons pointed out that the Rydex data showed a rush into the high beta tech sector, which could be interpreted as the last hurrah of the bulls - and that could be contrarian bearish.


Fortunately, there are other bullish signs to consider. One of the most likely bearish triggers that I had mentioned before was a possible growth scare. The macro data last week started to show a turnaround, starting with much better than expected auto sales, generally upbeat Beige Book and ending with the unambiguously positive Jobs Report on Friday. As a result, the Citigroup ESI has started to turn up.


Ed Yardeni found that forward 12 month EPS was rising again across all market cap bands, in large caps:


Mid caps:


And small caps:


Better growth is equity bullish, right?


Interest rate volatility rears its ugly head
Well, yes - to a certain extent. It depends on the interplay between growth and PE multiples. Everything else being equal, a 50bp rise in bond yields would amount to chopping roughly 1.3 multiple points off the PE multiple right now*. It then becomes a question of whether rising EPS growth can offset PE compression headwinds.

Macro Man wrote about the recent bout of interest rate volatility last week. His linear regression model is unambiguously bullish on equities, but there is a big caveat:
A linear regression is, by definition, linear, thereby assuming a constant proportional change in output for each change in the inputs. In normal circumstances, this is perfectly fine. When there are outliers and extremes, however, things can get quite messy when working with factors that are in reality asymptotic rather than truly linear. Such is the case with this model, where the extremely low readings of headline CPI have perhaps exerted an "overly bullish" influence on the output.

To be sure, when dis-aggregating the model's output into "growth" and "liquidity" dynamics, we can see that the former has actually been quite bearish while the latter has been close to an all-time high. As this model sees it, low oil prices have provided more financial market accommodation than QE ever did!

In other words, linear regression models may not perform well when some inputs are asymptotic, such as what happens when interest rates and inflation rates are near the zero-bound. He concluded that once he did a "sanity check" on his model, he wasn't so sure of its results because of the non-linear nature of interest rate changes on expected returns (emphasis added):
So how are we left? If one believes that markets are linear and that liquidity trumps all (call it the 'Funny Money' model), then by all means, buy with both hands, particularly on dips. A more pragmatic (and, dare your author opine, realistic) viewpoint is that while the wheels haven't fallen off, neither is the equity market trucking along with the same momentum (both price and fundamental) that has characterized the last several years.

Much like the case for the US economic rebound, Macro Man at this juncture can neither confirm nor deny that "sell in May" will be a wise call in 2015. What he does know, however, that any legitimate rebound in economic activity will be met with renewed speculation of Fed tightening, which could push growth and liquidity drivers of equities in ways not observed for a number of years. It therefore behooves him to continue to assess these factors from a number of different perspectives as he attempts to tease out the trajectory of equities and other asset markets.
Wise words indeed from a street smart and book smart quant!


Greece: The second bearish catalyst
I believe that interest rate volatility can take stock prices down maybe 10%, but not much more. Let me explain why.

Imagine that if the market were to correct 10% and your broker called you up and said, "We had been somewhat cautious and raised 30% for such an occasion. Let's put the money to work now." If you got that call and macro and fundamental conditions were unchanged from today, chances are that you would have little hesitation about buying.

In order for stock prices to fall further, we need a second bearish catalyst to change investor psychology so that if a typical investor got that call, he would be hesitant about buying.

At this point, the most likely second bearish catalyst is Greece. To recap the latest Greek drama, Angela Merkel hurried convened a meeting Monday night with French President Francois Hollande, ECB President Mario Draghi and the head of the International Monetary Fund Christine Lagarde in Berlin. Together they agreed to present a united front and a last ditch aid-for-reform plan to Greece. On Wednesday, EC President Jean-Claude Juncker and Eurogroup head Jeroen Dijsselbloem formally presented Greek PM Alexis Tsipras with the creditors' plan to resolve the Greek crisis.

There is little point in going through all the details of the plan, but the reaction from the Greek side was overwhelmingly negative. Instead of paying €305 million due to the IMF on Friday, Athens made a surprise last-minute request to bundle all of its IMF payments at month end, which would total about €1.6 billion, an amount that they don't have unless there was an agreement. In a defiant speech to the Greek Parliament on Friday, Tsipras made a number of inflammatory and odd remarks:
  • He called the creditors' demands "absurd" and vowed that "they won't humiliate us".
  • He would not accept an agreement without debt re-structuring, or debt relief, which the creditors have long stated would be a non-starter.
  • Before tabling a counter-offer, he wanted to hear from the opposition parties so that he knows where they stand. This was an astute political move to put his opponents on the record in case he has to either call a referendum or election.
How much of what has been said, on both sides, is grandstanding and how much is the real negotiating position? In the end, what is the actual likelihood of a deal? 

First of all, a glance at the chart of the Athens General Index shows that the bad news may already be in the market. The index appears to be trying to bottom and briefly staged a rally out of a downtrend. The rally occurred during a period of tough negotiations. Such price action is often indicative that the bears have become exhausted and moved into a crowded short position.


However, a crowded short doesn't mean that events can't go south. There are four key issues  to consider:
  1. There may be some room for negotiation on the level of primary budget surplus, which is the budget balance before debt service.
  2. Debt write-offs, which the ECB and Eurogroup have refused to consider, have been a key plank of the Syriza electoral platform.
  3. What happens with reforms of the Greek tax and spending regime? Greece has a complex VAT system that needs to be reformed, which is up for negotiation. The creditors also want pension reform, which is one of Syriza's "red lines", reform of the public service, another possible "red line" and privatization.
  4. Finally, there is the "soft" matter of trust. After many years, both sides don't trust each other. In particular, past Greek governments have dragged their feet on reform initiatives that the creditor institutions cannot trust future governments to carry out their promises. Hence the need for supervision, which the Greeks have interpreted as outside interference.
Here is my take. On the first matter of primary budget surplus, Benn Steil pointed out that, by the numbers, the two sides aren't that far apart and therefore there may be room for convergence in order to make a deal.


However, the two sides diverge considerably on the key issues of reform and trust. On one hand, Greek finance minister Yanis Varoufakis has written eloquently and rhetorically about how Greece needs growth instead of just austerity and hope, such an approach appears to have fallen on deaf ears as his entreaties are philosophically foreign to core Europe.

More importantly, I have been watching Angela Merkel very carefully throughout these negotiations. Merkel is an astute politician and she has had a record of being silent. She has allowed others like Dijsselbloem and Schäuble to speak, but preferred to have the last word. She does not speak until she makes up her mind as to where to invest her political capital.  So when in the wake of the late night emergency meeting with Hollande, Draghi and Lagarde that she spoke up to say that the Greeks had to undergo reforms, I sat up and listened (via CNN, emphasis added):
Greece needs to return to the path of tough economic reforms to secure its future in the eurozone, German Chancellor Angela Merkel said Thursday.

Speaking to CNN after hours of talks Wednesday between Greece and its creditors failed to produce a breakthrough, Merkel said a solution to the current crisis needed "big efforts" by both sides.

But she made clear that Greece should look to the example of other countries in the eurozone -- such as Ireland -- that had implemented painful changes to their economies in response to the financial crisis.

"They went through such a program and now have the best growth in the eurozone," she said.

"That is the kind of course Greece needs to get on. And that is why the negotiations are tough, but they are clearly aimed at keeping Greece in the eurozone."
I interpreted these remarks as the EU`s last words on the topic and the "red lines" that Europe will not cross. It's implement the outlined reforms or it's no deal. In effect, Merkel has made the calculation that she has to hold the line because of the Eurozone Domino Theory. Give in to Greece and you will have to give in to Spain, Portugal, Ireland and Italy, not to mention the kind of message it sends to poor countries that have not received bailouts, such as Slovenia, Slovakia and Lithuania.. The price is too high. Plan B is a Greek default. At the time of the Cypriot crisis, Eurogroup President Dijsselbloem stated that the blueprint for dealing with eurozone bank crises was to have large depositors take haircuts along with bank shareholders, bondholders and holders of subordinated debt. That will most likely be part of the Plan B for Greece - a default within the eurozone.

As for Alexis Tsipras, it is unclear how far he will go. On one hand, one of Syriza's platforms was to make a humane deal and that Greece stays in the eurozone. On the hand hand, if Tsipras goes to far he faces a possible revolt by the left wing of his own party, which flexed its muscle by torpedoing the appointment of an economist who was part of the previous regime to be the Greek IMF representative. According to FT Alphaville, a recent poll indicated that 58% of Syriza supporters would prefer bring back the drachma over implementing the hated Memorandum of Understanding. Moreover, analysis from Oxford Economics indicate that the cost of Grexit may not be that bad.
  • A devaluation would make Greece more competitive
  • Greek businesses and households could repatriate their euro-denominated savings back into devalued Drahmas and provide a much need boost to the economy.
From that perspective, it is difficult to know the how endgame plays out as there are incentives to default and Grexit. The latest bookmaker odds from PaddyPower indicate that the payoff to a Greek default before year-end has moved from 11/8 to 6/4 since the last update (see Ode to a Grecian Deal, or Acropolis Now?). The probability of default, despite the slightly lengthened odds, still amount to about 38%. My own estimates, based on the price of a at-the-money CBOE-listed put option on the National Bank of Greece on the theory that NBG shareholders would get wiped out in a Greek default came to about 40% - still a significant risk.


The week ahead: Sell the rip!
As we approach the week ahead, the US stock market has descended to levels that approach support and it is unclear whether the bears, though re-invigorated, have totally seized control of the tape. Short-term momentum measures like RSI(5), which is useful for short-term swing trading, have become oversold. Medium-term momentum indicators like RSI(14) are still stubbornly range-bound, indicating that the bears haven't been able to exert sufficient downside pressure to push the market into a series of "bad" oversold readings indicating sustained selling pressure. As well, the VIX Index touched its upper Bollinger Band late last week but was unable to close above those levels, indicating possible bearish exhaustion. Moreover, the equity market was unable to sell off on Friday in the face of bad news (a strong NFP release indicating pressure on the Fed to raise interest rates and a defiant message from Greek PM Tsipras).


In particular, the market reaction to the Tsipras speech was revealing. While he made his speech to the Greek Parliament after the European markets had closed, they were not closed in the US. Here is a 15-minute tick chart of GREK, the Greek stock ETF. The ability of the market to rally in the face of bad news is bullish and indicate that the bears are exhausted.


In light of the market action on Friday, my inner trader reduced his short positions in anticipation of a possible counter-trend rally early next week. The intermediate term trend remains down, but the market is likely to see a short-term rally. It seems that the bears have finally woken up from their hibernation, but they aren't out of the woods yet. My lines in the sand of the full onset of a bear phase haven't been crossed yet. I continue to watch for signs of downside momentum in the form greater follow-through on bearish moves and more "bad" oversold readings where the market gets oversold and stays oversold.

This chart from Index Indicators show the magnitude of the difference. The market is currently mildly oversold (blue circle) by the wimpy standards of 2015, but readings could get much more extreme (red circles).


My inner investor remains cautious. He is neutrally weighted and he is waiting for a correction in order to buy stocks are lower levels.


Disclosure: Long SPXU


* The stock market is trading at roughly 17x forward earnings, which is an earnings yield of 5.9%. Supposing we raise the earnings yield to 6.4% because rates have moved have moved 0.5%, forward earnings would then become 15.7x, or a difference of 1.3 PE multiple points.

Friday, June 5, 2015

Cautionary tales for the gold standard crowd

As I watched the Greek drama unfold, it occurred to me that this episode represents a cautionary tale for the gold standard cheerleaders who would like to return to an era of rigid monetary policy and fixed exchange rates. The modern story of Greece is the tale of a country locked into a currency that it cannot print or devalue.


The Great Depression in Greece
While there are benefits of the gold standard, namely the inability of governments to print money and inflate, the price is a high degree of economic volatility that citizens of developed economies have been unaccustomed to in the last 50 years. An article in Quartz shows that the Greek GDP has tanked so much that it rivals America during the Great Depression:
That collapse in economic output puts the Greek recession right up there with the worst depressions in recent memory. At its trough in the first quarter of 2014—which was revised lower in today’s report—the decline in Greek GDP was roughly 33% from the peak. That’s actually worse than the US peak-to-trough GDP decline of 27% between 1929 and 1933, during the most acute phase of the Great Depression.

Wow, talk about rigidity and adjustments! For another perspective, RBS showed the scale of the kind of austerity measures that the Greeks have to endure:


Hope, not despair
The pain has been so great that a number of prominent economists written an open letter in the FT to Greece`s creditors, pleading for "hope not despair":
Sir, The future of the EU is at stake in the negotiations between Greece and its creditor institutions, now close to a climax. To avoid failure, concessions will be needed from both sides. From the EU, forbearance and finance to promote structural reform and economic recovery, and to preserve the integrity of the Eurozone. From Greece, credible commitment to show that, while it is against austerity, it is in favour of reform and wants to play a positive role in the EU.

In a letter to the FT in January, several of us said: "We believe it is important to distinguish austerity from reforms; to condemn austerity does not entail being anti-reform." Six months on, we are dismayed that austerity is undermining Syriza's key reforms, on which EU leaders should surely have been collaborating with the Greek government: most notably to overcome tax evasion and corruption. Austerity drastically reduces revenue from tax reform, and restricts the space for change to make public administration accountable and socially efficient. And the constant concessions required by the government mean that Syriza is in danger of losing political support and thus its ability to carry out a reform programme that will bring Greece out of the crisis. It is wrong to ask Greece to commit itself to an old programme that has demonstrably failed, been rejected by Greek voters, and which large numbers of economists (including ourselves) believe was misguided from the start.

Clearly a revised, longer-term agreement with the creditor institutions is
necessary: otherwise default is inevitable, imposing great risks on the economies of Europe and the world, and even for the European project that the eurozone was supposed to strengthen.

Syriza is the only hope for legitimacy in Greece. Failure to reach a compromise would undermine democracy in and result in much more radical and dysfunctional challenges, fundamentally hostile to the EU.

Consider, on the other hand, a rapid move to a positive programme for recovery in Greece (and in the EU as a whole), using the massive financial strength of the Eurozone to promote investment, rescuing young Europeans from mass unemployment with measures that would increase employment today and growth in the future. This could both transform the economic performance of the EU and make it once more a source of pride for European citizens.

How Greece is treated will send a message to all its eurozone partners. Like the Marshall plan, let it be one of hope not despair.

Tech bubble and the Commercial Crisis of 1847
Still not convinced? Liberty Economics, the blog of the NY Fed, had a fascinating post recounting what happened during the railway tech bubble of 1840s and its aftermath.
British railway mania had a long fuse. The nation went through a lesser, “hypomanic” railway episode in the 1830s, but with the economy weak in the late 1830s and early 1840s, owing partly to the aftermath of the Panic of 1837, the spark did not catch. By 1843, however, the economy was recovering, interest rates were low, railroad construction costs were falling, and railway revenues were rising, thus setting the stage for a full-blown manic episode.

As is usually the case with technology booms, extravagant claims about the transformative powers of the new technology abounded: “Verily railways are the wonder of the world! Nothing during the last few years has created so marvelous a change as the great iron revolution of science” (Evans). Instead of “Internet speed,” as heard during the telecom bubble, the talk then was of “railroad speed.” The growing middle class in Britain, thanks to the industrial revolution, created a larger new cohort of eager investors wanting in on the action. With investors crowding, the number of railroad securities listed on the London exchange—and their prices—roughly tripled between 1843 and 1845 (see chart below).

To make a long story short, the railway bubble ended the same way as the NASDAQ bubble:
The mania, or “collective hallucination,” subsided in late 1845 as expectations seemed to turn, in part because of naysaying by the Economist (founded in 1843) and the London Times. On October 16 of that year, the Bank of England raised discount rates, and as credit tightened, railroad share prices began a long, steep decline, wiping out many fortunes along the way.
That wasn't the end of the story. The effects of the railway crash was exacerbated by a crop failure:
With collapsing railroad prices as background, the proximate cause of the Commercial Crisis of 1847 was the shock to the agricultural sector and the subsequent financial and monetary fallout (Dornbusch and Frenkel). Both Ireland and England suffered massive harvest failures in 1846, which led to food shortages and drove up commodity prices. As food imports from the United States and elsewhere surged, the British trade deficit turned sharply more negative (doubling in absolute terms between 1845 and 1847) and gold bullion reserves drained from the Bank of England to finance food imports. In April, to hoard its dwindling reserves, the Bank raised the discount rate and severely limited the bills it would discount (lend against), causing, as C.N. Ward-Perkins (p.78) mildly put it, “much complaint in financial and commercial circles.”

Aggravating the tightening monetary conditions was a rash of failures of “commercial” firms occasioned by failed speculative plays (via derivatives!) in foodstuffs, particularly corn. With the failed 1846 harvest as prologue, many merchant houses bought corn and other foodstuffs forward, expecting higher prices in the future. By the time these contracts matured in mid-1847, prospects for a strong harvest that summer caused spot prices to fall sharply, catching many speculators short. Further, the Bank of England raised rates again in August, and the confluence of falling prices and higher rates led to widespread financial panic that brought down more than fifty corn merchants in August and September, along with many of the commercial firms that funded their positions. The deflating railway bubble, which bankrupted many enterprises and raised doubts about the stability of the financial system, set the stage for the panic (Dornbusch and Frenkel).
The Bank of England’s ability to respond to the crisis was limited because its hands were tied because the currency was tied to gold. The crisis ended when the Parliament suspended the gold link (emphasis added):
The Bank of England’s ability to contain the crisis as a lender of last resort was severely constrained by the Bank Charter Act of 1844 (Humphrey and Keleher). The Act gave the Bank of England a monopoly on new note (essentially money) issuance but required that all new notes be backed by gold or government debt. The intent, per Currency School doctrine, was to prevent financial crises and inflation by inhibiting currency creation. Adherents recognized that the Act might also limit the central bank’s discretion to manage crises, but they argued that limiting currency creation would prevent financial crises in the first place, thus obviating the need for a lender of last resort. But, of course, not all crises originate in the financial sector. In the case of the Commercial Crisis, the perverse effect of the Act was to cause the Bank to tighten monetary conditions in both April and October as gold reserves drained from the Bank (Dornbusch and Frenkel). In July, a coalition of merchants, bankers, and traders issued a letter against the Bank Charter Act, blaming it for “an extent of monetary pressure, such as is without precedent” (Gregory 1929, quoted in Dornbusch and Frenkel).
The panic culminated in a “Week of Terror,” October 17-23, with multiple banks failing or suspending payments to depositors in the midst of runs. The Royal Bank of Liverpool shuttered its doors on Tuesday, followed by three other banks, and by the end of the week the Bank of England held less than two million pounds in reserve, down from eight million in January. Systemic collapse seemed imminent. On Saturday of that week, London bankers petitioned Parliament to suspend the Bank Act, and by midday Monday it had done so, thus enabling the Bank to issue new notes without gold backing and to “enlarge the amount of their discounts and advances upon approved security” (J. Russell and Charles Wood, Bank of England). The ability to expand fiat note issuance increased liquidity and helped the Bank restore confidence, and the seven percent discount rate the Bank was charging attracted gold reserves back to its vaults (hence the maxim “seven percent will draw gold from the moon”). By December, interest rates were down substantially from their panic levels.
Volatility indeed! The New York Fed then compared the BoE response in 1847 to the Fed response to the Lehman Crisis:
In contrast to the Bank of England in 1847, the Federal Reserve during the Panic of 2007-2008 was authorized to act as lender of last resort, and, in fact, the Fed acted aggressively to provide liquidity to the financial system in unprecedented ways. Through a variety of newly created facilities, the Fed expanded the types of institutions it would lend to, including nonbanks, and the types of collateral it would lend against, including asset-backed securities.
What about the inflation that a gold standard that was supposed to prevent? Here is how inflation has behaved after several years of QE and ”money printing” (via the Brookings Institute):


Here is what has happened to inflationary expectations:


So what is more important, an adherence to a rigid ideological dogma, which creates wild and unwanted economic volatility in the form of economic depressions, or a more flexible regime that has resulted in a benign inflationary outlook?

Wednesday, June 3, 2015

Ode to a Grecian Deal, or Acropolis Now?

I won't write much about the latest details on Greece, as events are moving fast and any updates I have will be out of date within hours. Needless to say, we are down to the wire again as the Greeks have threatened to withhold their payment due to the IMF this Friday should there be no deal.

So will we have a deal (Ode to a Grecian Deal), or will the Greeks metaphorically take to the Acropolis for a last stand as the Athenians planned to do had their army had lost to the Persians at the Battle of Marathon (Acropolis Now!)?

Here are a couple ways to handicap the outcome. The chart below of the Athens General Index show the index to be in a downtrend (solid line), but it has rallied out of a minor downtrend (dotted line). Moreover, the inability of the index to fall further on bad news and actually try to bottom has to be regarded as good news. In other words, the stock market believes that we will see an eleventh hour deal.


On the other hand, the latest odds from PaddyPower, where people are also putting real money on the line, shows the odds of Greek defaulting in 2015 to be 11/8, which works out to be around 40%, and the odds that Greece will adopt its own currency by the end of 2017 to be even.

The probability of Grexit in 2015, which is a less likely event than a straight default, is coming in at between 25% and 30%.


Who should you believe? I'm not sure, but there is a big divergence there between what the stock market believes and the bookmaker odds of Greek default.

Tuesday, June 2, 2015

Trend Model report card: Lessons learned

For much of 2014, the returns of the account based on my Trend Model signals of 30-40% (see An intriguing Trend Model interim report card) seemed too good to be true. I have long believed that the long-term return estimate on my long-short  was about 20%. Little did I expect that returns would adjust from the 30-40% level to 20% so quickly though.

The Trend Model account fell -8.1% in May; the one-year return was 21.1%; and the return from inception of September 30, 2013 was 20.1%. Peak-to-trough drawdown was -15.5%.


I reiterate my disclaimer that I have nothing to sell anyone right now. I am not currently in a position to manage anyone`s money based on the investment strategy that I am describing.


Trend Model description
For readers who are unfamiliar with my Trend Model, it is a market timing, or asset allocation, model which uses trend following techniques as applied to commodity and global stock market prices to generates a composite Risk-On/Risk-Off signal (risk-on, risk-off or neutral). I have begun updating readers on the Trend Model signals on a weekly basis and via Twitter @humblestudent as new developments occur.

The chart below shows the actual out-of-sample (not back-tested) changes in the direction of the signal, which are indicated by the arrows, overlaid on top of a chart of the SP 500. You can think of the blue up arrows, which occurred when the trend signal changed from negative to positive, as buy signals and the red down arrows, which occurred when the trend signal changed from positive to negative, as sell signals.

Trend Model Signal History
As the chart shows, the market pattern for much of 2015 has been choppy and consequently the signals have suffered from whipsaw. The stock market remains above the level shown by the latest Sell signal, which accounts for the recent poor performance.


A proof of concept
Backtests are always a good starting point for model building, but there is no substitute for actual performance. As a proof of concept, I started to manage a small account that traded long, inverse and leveraged ETFs on the major US market averages and, on occasion, sector and industry ETFs. Trading decisions were based on Trend Model signals combined with some short-term sentiment indicators. The inception date of the account was September 30, 2013 and the chart below represents an interim report card of that account. (For more details on how the Trend Model or how the account is managed, see my post Trend Model FAQ).

When evaluating the performance of this trading account, keep in mind that this is intended to be an absolute return vehicle. While I do show the SPY total return, which includes re-invested dividends, for illustrative purposes, the SP 500 is not an appropriate benchmark for measuring the performance of this modeling technique.


A difficult environment
The account performance continued to be challenging this years, though one year returns at 21.1% and returns from from inception (September 2013) of 20.1% are quite respectable. The difficult returns are not surprising. Wisdom Trading compiles the performance of different trend following CTA managers and the results have been spotty this year.


I have also documented in the past how choppy markets have been unfriendly to trend following models (see All washed up!). The chart below of the SPX shows that the index has moved through its 50 day moving average (dma) and snapped back at least once a month in 2015. Trend following models simply do not perform well under these circumstances.


Possible bear trend ahead
Further research showed that while long-term trends were strong, as evidenced by a steadily rising market with no 10% correction since 2011, shorter term trends were weak. Using monthly DJIA data going back to 1900, such conditions have resulted in trends that happen to be bearish.

A study by James Paulsen of Wells Capital Management which showed that when a long-term stock market price trend is extended, as it is now now, such conditions have led to reversals. My own analysis (How to make your first loss your best loss).showed that the differential between the long-term (3-year) trend and short-term (6-month) trend is at levels consistent with past major inflection points like the Crash of 1929 and 1987 (bottom panel of chart). However, I would like to emphasize this analytical approach only predicts direction, not magnitude and therefore a major market crash is unlikely.


Recent market conditions are showing widespread technical deterioration, in breadth, momentum and risk appetite metrics. These reading suggest that a bear trend is about to assert itself. For a trend following model, any trend is a good trend.


Strategy characteristics still promising
Despite the challenging environment and near-term returns, keep the following in mind:
  • You can't expect to make 20% (my best guess long-term estimate for this strategy) without a 10-15% drawdown. So far, the maximum drawdown is 15.5%. Most hedge funds aim for a return to maximum-drawdown ratio of 2 to 1, but a 1.5 to 1 to 1 is a more realistic target. By comparison, the drawdown for equities was in the order of 50% and most balanced funds saw losses of about 20% during the 2008-2009 period. Using even a 1 to 1 ratio and working backwards, it would be hard to envisage a long-term return expectation of 50% for stocks and 20% for balanced funds today.
  • Long term returns continue to be respectable. The one-year return was 21.1% and return from inception (September, 30, 2013) was 21.1%.
  • Monthly returns continues to be skewed positively. The chart below of the distribution of monthly returns show that, despite the disappointing -8.1% return in May, there were many more instances of high positive returns than negative ones.
  • Returns are highly diversifying compared to major asset classes. They are uncorrelated with equities (correlation of -0.21 with SPY) and bonds (0.11 with AGG).
  • Returns are still positive, with a 65% monthly batting average. The investment business is an industry where portfolio managers have very low signal-to-noise ratios. Someone with a batting average of 55% will make a decent living. A batting average of 65% will make you a superstar.


Two lessons learned
The market environment in 2015 has been challenging for the Trend Model trading strategy in 2015. Throughout this difficult period, I can point to a couple of lessons learned.

First, tighten up risk control when you see an unfriendly market environment. I had already anticipated this in a 2014 year-end review when I postulated a positive year for US stock prices but with a much higher volatility (see 2015: Bullish skies with scattered periods of volatility). I followed up with a similar comment in January (see All washed up!). In hindsight, the correct response would have been to reduce the level of capital commitment until market trend becomes more friendly.

Second, be patient! Trend following models work, but not all models work well all the time. Alpha Architect recently conducted a study of several asset allocation modeling approaches, namely Max Sharpe, Risk Parity, Minimum Variance, Momentum and Trend Following. It concluded that Trend Following showed the best results (emphasis added).
The results can be summarized as follows:
  • The tangency portfolio, or “max-sharpe” method perform the worst and cannot even compete with the benchmarks.
  • Minimum variance beats the tangency portfolio, which is ironic, given the theoretical underpinnings for the tangency portfolio. Nonetheless, the strategy, while risk-managed, does poorly on upside returns, underperforming the simply 10-Year bond CAGR.
  • The risk parity methodology performs admirably, with strong risk-adjusted statistics and strong drawdown containment.
  • Momentum also performs admirably, with the highest CAGR, however, the strategy has to contend with large drawdowns.
  • The EW index with trend-following performs the best, capturing much of the upside, but preventing large drawdowns.

But the trend following TAA model has performed abysmally since 2008:
There is no panacea when it comes to tactical asset allocation. The evidence seems to suggest that trend-following rules are the most effective and the most robust, but as the recent 5 year run highlights, NOTHING WORKS ALL THE TIME.

To summarize, investment results this year have been challenging but continue to be promising for this model longer term. I am comfortable with the current hiccup in returns is a characteristic of a difficult environment for this class of model and that environment become more favorable in the near future. Readers who want to monitor the signals of the Trend Model to subscribe to my blog posts here, which include Trend Model updates, or follow me via Twitter @humblestudent.

Monday, June 1, 2015

Uh-Oh Canada!

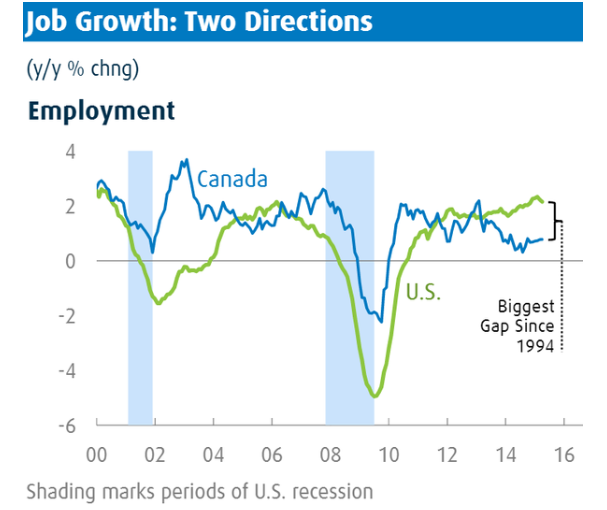
I don't write much about Canada but I have been watching this trend for quite some time. This analysis from BMO came across my desk (via Sober Look):


While some top-down macro analysts might dismiss the spread in job growth due to the cratering oil price, the divergence began in late 2013/early 2014, when oil prices were still relatively robust. This picture of falling labor demand is even more disturbing in light of analysis from David Andolfatto of the St. Louis Fed, who showed that Canadian labor participation rates are well above the US for the current economic cycle.


So what we have is a picture of slower labor demand (BMO analysis, first chart) and higher than usual labor supply (St. Louis Fed analysis).


Declining competitiveness
Despite what non-Canadians macro analysts think, Canada is not just one big oil producer. In past cycles, falling commodity prices would see the economies of the resource-rich West recede while the manufacturing base in Ontario and Quebec boom. Unfortunately, Canada may not see the same kind of offsetting rise in manufacturing employment as it had in past cycles.

A 2014 Boston Consulting Group (BCG) study showed the manufacturing competitiveness of major exporting countries around the world. Canadian costs are higher than its NAFTA partners, the US and Mexico. In the past, where American manufacturing might have looked at locating plants in Central Canada because of its proximity to markets, educated labor force and costs, either staying home in America or moving to Mexico is a more compelling choice today.


The BCG study also showed how manufacturing costs have shifted between 2004 and 2014. While American and Mexican manufacturing competitiveness has stayed the same or improved, Canadian competitiveness has declined.


Loonie bearish
The bottom line is that all these long-term developments are bearish for the Canadian Dollar, otherwise known as the loonie. The chart below depicts the CADUSD exchange rate (top panel, black), the WTI oil price (top panel, green) and the USD Index (bottom panel). While the loonie is thought of as a petro-currency and therefore highly correlated to oil prices, oil prices have stabilized recently while the loonie has fallen, possibly because of these differences in competitiveness.


There are several reasons to continue to be bearish on CADUSD:

  • The Fed and BoC have divergence monetary policies, which are supportive of further USD strength and CAD weakness.
  • Technically, the CADUSD remains in a downtrend and therefore the momentum trade is further loonie weakness.
  • The BCG analysis implies an equilibrium exchange rate of 0.72 to 0.78. The BCG study showed a Canadian cost of 115, compared to 100 for the USD and 91 for Mexico. That study was done when the CADUSD exchange rate was about 0.90. If all of the adjustment were to made through the exchange rate mechanism, CADUSD would have to fall to 0.78 to be competitive with American manufacturing and would have to fall to 0.72 to be competitive with Mexican manufacturing.
I have moved a fair amount of my liquid cash from CAD into USD in anticipation of a much lower loonie over the next few years. Given the propensity for markets to overshoot, I wouldn't be totally surprised to see the exchange rate trade with a 6-handle before it finally bottoms.