Showing posts with label Monetary policy. Show all posts

Saturday, January 3, 2026

Opportunities and Challenges of 2026

The accompanying chart from Jeffrey Hirsch of Almanac Trader shows the expected seasonal price pattern for the S&P 500. As with any seasonality analysis, direction is more important than the magnitude of the move. If history is any guide, expect a volatile year until October, followed by a rally into year-end.
I agree with the broad strokes of the seasonality analysis, and the pattern forms the base case of my S&P 500 market expectations for 2026.

But I still have questions for the market, and here are the opportunities and challenges for investors in the new year.

The full post can be found here.

Saturday, July 20, 2024

Positioning for Trump 2.0

In the wake of Biden’s subpar debate performance and the assassination attempt on Trump, the prediction markets’ odds of a Trump victory in November have substantially risen. Equally important is Wall Street’s reaction, which has investors sitting up to take notice of the implications of a second Trump Administration in 2025.


Despite the real-time information from the betting markets, financial markets haven’t fully discounted the possibility of a Trump win. Here’s how you can take advantage of that arbitrage opportunity.

The full post can be found here.

Saturday, April 20, 2024

Are we in for a 1970's style inflation revival?

When Fed Chair Jerome Powell spoke at a moderated Q&A last Tuesday, he confirmed the higher-for-longer message of virtually all other Fed speakers: “The recent data have clearly not given us greater confidence and instead indicate that it is likely to take longer than expected to achieve that confidence [to reduce rates]”.
 
As a consequence of the shift to a higher-for-longer narrative, different versions of this ominous CPI chart have been making the rounds. Could we be in for a 1970s-style inflation revival?


The full post can be found here.

Saturday, October 7, 2023

What's spooking the bond market, and why it matters to equities

What’s bothering the bond market? The 10-year Treasury yield (blue line) has shot up to levels last seen just before the GFC. The surge in yields has occurred just as investors are seeing better news on inflation. At the same time, core PCE (red line) has been falling. Shouldn’t that be good news for the trajectory of monetary policy? Why are yields rising?


 The full post can be found here.

Saturday, September 16, 2023

How the USD could sink the S&P 500

Correlation isn’t causation, but the USD Index has shown a close inverse correlation to the S&P 500. The relationship partly ended when the S&P 500 surged on AI mania. However, small-cap stocks, which are less subject to the enthusiasm over the AI revolution, maintained their inverse correlation.


The USD Index is approaching a key resistance level. Assuming the inverse correlation were to continue, what are the bear and bear cases for the USD, and consequently U.S. equities?

The full post can be found here.

Saturday, February 18, 2023

Is there an inflation threat in your future?

On Valentine's Day, the European Central Bank tweeted a poem to underscore its commitment to fighting inflation.


The ECB tweet is also indicative of the tight monetary policy undertaken by most major central banks. Only two central banks, the BoJ and the PBoC, are meaningful suppliers of global liquidity. The rest are raising interest rates and engaged in quantitative tightening. While the Fed may be on the verge of a pause, last week's hot PPI report and slightly stronger than expected CPI print has raised doubts about a dovish pivot.

Inflation is becoming a threat again.

The full post can be found here.


Saturday, October 15, 2022

Why the pivot may be closer than you think

Richard Nixon's Treasury Secretary John Connally famously said in 1971, "The dollar is our currency, but it is your problem". Nixon's actions at the time closed the gold window, imposed a number of tariffs, and drove the USD down in the aftermath of the collapse of the Bretton Woods Agreement of fixed exchange rates.

Fast forward to 2022, and the situation is different. The Federal Reserve is one of the most hawkish of advanced economy central banks. The Fed's actions are exporting disinflation abroad and forcing major trading partners to engage in a series of competitive tightening to defend their own currencies. 


While US financial conditions are still relatively stable, financial cracks are appearing abroad and USD strength has become a wrecking ball wreaking havoc around the world. In spite of the hot September CPI print, the Fed's pivot may be closer than the market expects.

The full post can be found here.

Saturday, July 16, 2022

How the Fed is acting like a bull in the china shop

The June CPI and PPI reports both came in higher than expectations. The good news is core CPI is decelerating. The bad news is both core sticky price CPI and Owners' Equivalent Rent, which is about one-third of core CPI, are rising rapidly. 


These readings confirm the market's expectations that the Fed will continue to tighten until something breaks. In effect, the Fed is behaving like the proverbial bull in a china shop.

The full post can be found here.

Saturday, February 26, 2022

Wars are equity bullish, but there's a catch...

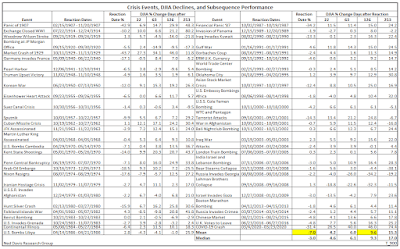
Four weeks ago, I suggested that investors buy to the sound of cannons. Now that the cannons have sounded, is that still a good idea?

Yes, but there's a catch. A detailed list of past crises from Ed Clissold of Ned Davis Research reveals that stock prices usually rebound strongly after sudden shocks such as war. On average, the DJIA is up 4.2% after a month and 15.3% a year later.


Here's the catch...

The full post can be found here.

Monday, November 1, 2021

Hawkish expectations

Short-term rates are freaking out. 2-year yields are rising based on the expectation of a tightening bias by global central bankers.


The market should gain greater clarity on central bank intentions soon. Both the Fed and the BoE will announce their interest rate decisions this week and the BLS will report Non-Farm Payroll Friday.

The full post can be found here.

Saturday, July 17, 2021

How to engineer inflation

Both the June CPI and PPI came in hot and well ahead of expectations. There was the inevitable debate about the transitory nature of the price increases. Looking longer-term, however, the conventional models for explaining inflation have been unsatisfactory. 

Notwithstanding the numerous failures by Japanese policymakers, consider the US as another example. Let's begin with fiscal policy. It is said that deficit spending would lead to currency devaluation and inflation in the manner of the Weimar Republic. Nothing could be further from the truth. The blue line represents federal government deficits as a percentage of GDP. Deficits began to balloon in the early 1980`s with the Reagan Revolution and continued during the Bush I era. Did inflation (purple line) explode upward?

Monetary policy had its own failure. Monetarist Theory, as popularized by Milton Friedman, was another model that backtested well but failed out of the box. Friedman postulated that the PQ=MV, where the Price X Quantity of goods and services (or GDP) = Money Supply X (Monetary) Velocity. Friedman theorized that, over the long run, monetary velocity is stable, and therefore money supply growth determines inflation. All central banks had to do was to control money growth in order to control inflation.

It worked until about 1980. Monetary velocity had been stable until about then. Money growth didn't generate inflation because monetary velocity fluctuated wildly. Growth in money supply, as measured by M1, was often matched by declines in velocity. The Fed could engineer money growth and inject liquidity into the financial system without creating inflation.


In the face of the apparent failure of these conventional models, I offer an alternative vision of inflation and discuss the implications for investors.

The full post can be found here.

Saturday, May 8, 2021

Do valuations matter anymore?

How expensive are US equities? Fed Governor Lael Brainard warned about "stretched valuations" in the preamble to the May 2021 Financial Stability Report:
Vulnerabilities associated with elevated risk appetite are rising. Valuations across a range of asset classes have continued to rise from levels that were already elevated late last year...The combination of stretched valuations with very high levels of corporate indebtedness bear watching because of the potential to amplify the effects of a re-pricing event.
By most measures, the market is highly extended. As an example, the S&P 500 trailing P/E looks unreal. But stock markets always look expensive when the economy recovers from a recession because the E in the P/E ratio is compressed.


Do valuations matter anymore? Yes and No. Let me explain my reasoning.

The full post can be found here.

Saturday, April 3, 2021

Biden's American Rescue Plan: Bullish or bearish?

If you thought that Biden would govern as a centrist, you were wrong. In the wake of the passage of a $1.9 trillion stimulus package, President Joe Biden is planning to attack the enduring challenge of inequality by expanding government spending with a second ambitious $3 trillion economic renewal plan and a revamp of the tax code. It is intended to be a repudiation of the Reagan Revolution and the neoliberal consensus that has dominated economic thinking for decades. He reportedly decided to go big on reform for the following reasons:
  • Biden is enjoying his honeymoon period, and his approval ratings are strong. The New York Times reported that a Republican pollster found that even 57% of Republican voters supported Biden's recent $1.9 trillion spending package.
  • The Democrats have full party control of Congress, and a short window before the mid-terms to enact legislation.
  • The pandemic recovery is offering both economic and political tailwinds to enact legislation.
What does this mean for investors?

The full post can be found here.

Saturday, October 10, 2020

A valuation puzzle: Why are stocks so strong?

One of the investment puzzles of 2020 is the stock market's behavior. In the face of the worst global economic downturn since the Great Depression, why haven't stock prices fallen further? Investors saw a brief panic in February and March, and the S&P 500 has recovered and even made an all-time high in early September. As a consequence, valuations have become more elevated.


One common explanation is the unprecedented level of support from central banks around the world. Interest rates have fallen, and all major central banks have engaged in some form of quantitative easing. Let's revisit the equity valuation question, and determine the future outlook for equity prices.

The full post can be found here.

Saturday, September 5, 2020

How the Fed's Policy Review got an incomplete grade

It has been over a week since Jerome Powell's virtual Jackson Hole speech in which he laid out the Fed's revised its updates to its Statement on Longer-Run Goals and Monetary Policy Strategy after a long and extensive internal review. There were two changes. one was a shift towards an "average inflation targeting" regime, where the Fed "seeks to achieve inflation that averages 2 percent over time". The other was an emphasis on to target low unemployment. Instead of minimizing “deviations from the maximum" employment, it will minimize “shortfalls of employment from its maximum level.”

The results of the review were much like a student handing in a term paper after much effort, but the assignment is incomplete, and leaves many questions unanswered.
  • How will the Fed calculate the average inflation rate? In other words, what decision rules will the Fed adopt to raise interest rates?
  • How credible is the 2% inflation target? How does the Fed expect to raise the inflation rate, when it was unable to do so for many years? Is it because its lab partner, fiscal policy, failed to work on the assignment?
  • How will the Fed manage the bond market's expectations? If the average inflation target of 2% is credible, how far above 2% will the 10-year Treasury yield be, and what will that do to the economy and stock prices?
On the last point, I had a discussion with a reader about the implications for the bond market in the wake of Powell's speech. Wouldn't a credible 2% average inflation target translate into a substantial surge in bond yields? How far above 2% does the 10-year Treasury have to trade? What does that mean for equity valuations?

Supposing that you knew for certain that inflation will average 2% over the next 10 years, you would certainly demand a Treasury yield of over 2%, say 2.5%. The 10-year yield needs to rise by at least 1.8%. What would that do to the economy, and the stock market?

Forward P/E ratios are stratospheric compared to their own history, but some investors have justified the high multiple by pointing to low rates. TINA, or There Is No Alternative. Valuations are reasonable based on equity risk premium (ERP), which is some variation of E/P - interest rates. Here is the Q2 2020 ERP calculation of Antonio Fatas, professor of economics at INSEAD. While the stock market appears reasonably priced based on ERP today, raising rates by 1.8% (everything else being equal) would make stocks far less attractive compared to fixed income alternatives.


Something doesn't add up. The Fed's review appears incomplete. There are too many unanswered questions.

The full post can be found here.

Saturday, July 25, 2020

Analyzing the bull case

Regular readers will know that I have been cautious about the equity markets over the past few months. Good investors cannot be overly dogmatic, and in that spirit, I contemplate what the bull case may be,

From a strictly technical perspective, price momentum has been strong. The Wilshire 5000 is on the verge of flash a monthly MACD buy signal, depending on what level the index closes at month-end. Past signals have usually seen the market rise strongly afterwards.


Let's put on our rose-colored glasses, and consider all the elements of the bull case.

The full post can be found here.

Sunday, July 12, 2020

Risk levels mildly elevated, but no signs of panic

Preface: Explaining our market timing models
We maintain several market timing models, each with differing time horizons. The "Ultimate Market Timing Model" is a long-term market timing model based on the research outlined in our post, Building the ultimate market timing model. This model tends to generate only a handful of signals each decade.

The Trend Asset Allocation Model is an asset allocation model which applies trend following principles based on the inputs of global stock and commodity price. This model has a shorter time horizon and tends to turn over about 4-6 times a year. In essence, it seeks to answer the question, "Is the trend in the global economy expansion (bullish) or contraction (bearish)?"

My inner trader uses a trading model, which is a blend of price momentum (is the Trend Model becoming more bullish, or bearish?) and overbought/oversold extremes (don't buy if the trend is overbought, and vice versa). Subscribers receive real-time alerts of model changes, and a hypothetical trading record of the those email alerts are updated weekly here. The hypothetical trading record of the trading model of the real-time alerts that began in March 2016 is shown below.


The latest signals of each model are as follows:
  • Ultimate market timing model: Sell equities*
  • Trend Model signal: Neutral*
  • Trading model: Bearish*
* The performance chart and model readings have been delayed by a week out of respect to our paying subscribers.

Update schedule: I generally update model readings on my site on weekends and tweet mid-week observations at @humblestudent. Subscribers receive real-time alerts of trading model changes, and a hypothetical trading record of the those email alerts is shown here.

Subscribers can access the latest signal in real-time here.


A holding pattern
After several weeks of back-and-forth, the stock market remains in a range-bound holding pattern. A breakout or breakdown may be depending on upcoming news in the form of Q2 earnings season, and the resolution of negotiations in Congress over a second round of fiscal stimulus.


How will the headlines develop over the next couple of months? Will the narrative be an out-of-control pandemic, no or inadequate fiscal stimulus, an economic disaster, and skyrocketing bankruptcies; or will it be a vaccine by late 2020, renewed fiscal stimulus, and an economic revival in 2021? Long-dated implied option volatility and the SKEW Index, which measures the price of tail-risk hedge, are telling the story of mildly elevated risk, but there are no signs of outright panic,

The full post can be found here.

Saturday, June 20, 2020

The bears are capitulating

Last week, I discussed the professional career risk challenges in this market (see What professional career risk looks like).
During these unusual periods of severe bifurcation between valuation and macro risk and price momentum, the investment professional is forced to make a decision based on what he believes the dominant investment regime will be in order to minimize career and business risk. This amounts to the classic Keynesian investing beauty contest, where investors do not try to determine the winner based on some investment criteria, but based on what he believes other investors think will be the winner.
I highlighted the differences in thinking between the fast-moving hedge fund manager, Stanley Druckenmiller, and the cautious approach of Jeremy Grantham, whose firm, GMO, reduced its target equity weight from 55% to 25%.

This week, it seems that even Grantham has capitulated and called this market a bubble in a CNBC interview.
“My confidence is rising quite rapidly that this is the fourth ‘Real McCoys’ bubble of my investment career,” Grantham, co-founder of GMO, told CNBC’s Wilfred Frost on Wednesday in an interview which aired on “Closing Bell.” “The great bubbles can go on for a long time and inflict a lot of pain.”

The previous three bubbles Grantham referred to were Japan in 1989, the tech bubble in 2000 and the housing crisis of 2008.
Not only has Jeremy Grantham capitulated and called this market a bubble, but also the latest BoA Global Fund Manager Survey shows signs of capitulation by cautious bears. Even though a record net 78% of survey respondents acknowledged that equities are overvalued, which is the highest reading since the survey began in 1998, their investment outlooks turned less bearish between the May and June survey.

As global stock prices continue to grind upward, managers are giving greater weight to their career risk, and reluctantly turning bullish. The bears are capitulating. How should investors approach this market?

The full post can be found here.

Monday, September 16, 2019

3 supply shocks could derail the economy

As the market reacts the weekend attack on Saudi oil facilities, the level of anxiety is mounting. Forbes published an article on Sunday entitled "Attacks on Saudi Arabia are a recipe for $100 oil".

Bloomberg that this represents the biggest disruption to global oil supply since the Iraqi 1990 invasion of Kuwait.


As visions of the 1974 Arab Oil Embargo and the ensuing recession dance in traders' heads, this is a timely reminder that the FOMC is meeting this week. Should the supply curtailment become prolonged, how should policy makers react to supply shocks? As well, there is a case to be made that the world is facing more than just one supply shock.

The full post can be found here.

Sunday, September 15, 2019

Is this the long awaited value investing revival?

Preface: Explaining our market timing models
We maintain several market timing models, each with differing time horizons. The "Ultimate Market Timing Model" is a long-term market timing model based on the research outlined in our post, Building the ultimate market timing model. This model tends to generate only a handful of signals each decade.

The Trend Model is an asset allocation model which applies trend following principles based on the inputs of global stock and commodity price. This model has a shorter time horizon and tends to turn over about 4-6 times a year. In essence, it seeks to answer the question, "Is the trend in the global economy expansion (bullish) or contraction (bearish)?"

My inner trader uses a trading model, which is a blend of price momentum (is the Trend Model becoming more bullish, or bearish?) and overbought/oversold extremes (don't buy if the trend is overbought, and vice versa). Subscribers receive real-time alerts of model changes, and a hypothetical trading record of the those email alerts are updated weekly here. The hypothetical trading record of the trading model of the real-time alerts that began in March 2016 is shown below.


The latest signals of each model are as follows:
  • Ultimate market timing model: Buy equities*
  • Trend Model signal: Bearish*
  • Trading model: Neutral*
* The performance chart and model readings have been delayed by a week out of respect to our paying subscribers.

Update schedule: I generally update model readings on my site on weekends and tweet mid-week observations at @humblestudent. Subscribers receive real-time alerts of trading model changes, and a hypothetical trading record of the those email alerts is shown here.


Is value investing back?
Have some pity on the long suffering value investing. The value style has lagged growth investing for so long that almost a generation of investors have only known about growth and FAANG stocks. The style enjoyed a recent short and short revival. Is this the start of a long awaited reversal?


Let us consider the pros and cons.

The full post can be found here.