Sunday, July 19, 2015

From oversold to overbought to...

Trend Model signal summary
Trend Model signal: Risk-off
Trading model: Bearish (downgrade)

The Trend Model is an asset allocation model which applies trend following principles based on the inputs of global stock and commodity price. In essence, it seeks to answer the question, "Is the trend in the global economy expansion (bullish) or contraction (bearish)?"

My inner trader uses the trading model component of the Trend Model seeks to answer the question, "Is the trend getting better (bullish) or worse (bearish)?" The history of actual out-of-sample (not backtested) signals of the trading model are shown by the arrows in the chart below. In addition, I have a trading account which uses the signals of the Trend Model. The last report card of that account can be found here.

Trend Model signal history
Update schedule: I generally update Trend Model readings on my blog on weekends and tweet any changes during the week at @humblestudent.


After the euphoria, what next?
The trading model turned bullish last week, but I warned that the "trading model 'buy' signal flashed this week may turn out to be very short-lived, depending on how the market action develops" (see Back to our regular programming (of 2011)). Indeed, the SP 500 advanced 3.9% from an oversold oh-no-Greece-oh-no-China-the-world-is-going-to-end extreme to an overbought buy-buy-buy-Greece-and-China-are-solved reading in the space of seven trading days.

At these levels, it would be very difficult to get bullish in the short term and, indeed, the intermediate term picture has deteriorated rapidly for several reasons:
  • Greece isn't fixed
  • Neither are problems in China
  • US fundamentals have turned a little wobbly
  • Market internals look terrible
Let's go through these issues, one at a time.


Greece: The good news is in the market
In the week just past, the Greek parliament passed the package of "reforms" demanded by the Eurogroup as a pre-condition for rescue funds. In addition, various eurozone parliaments passed resolutions approving a bridge loan for Greece and giving authority to the national government to negotiate a third Greek bailout. These resolutions were passed in key countries, namely Finland and Germany. As well, the ECB came to the rescue by raising the ELA limit for the Greek banking system. The can has been kicked a little bit down the road.

What's next? Now comes the hard part of negotiating a third bailout package. In the middle of all this, the IMF released a shocker of a study on the sustainability of Greek debt. The summary read (emphasis added):
Greece’s public debt has become highly unsustainable. This is due to the easing of policies during the last year, with the recent deterioration in the domestic macroeconomic and financial environment because of the closure of the banking system adding significantly to the adverse dynamics. The financing need through end-2018 is now estimated at Euro 85 billion and debt is expected to peak at close to 200 percent of GDP in the next two years, provided that there is an early agreement on a program. Greece’s debt can now only be made sustainable through debt relief measures that go far beyond what Europe has been willing to consider so far.
According to IMF staff projections, the eurozone will either have to cough up a lot more than they ever expected to rescue Greece, or give them interest-free loans for the next 30 years.

The long-term problem of Greece in the eurozone can be summarized by Dany Bahar and Michael Kransdorff at the Brookings Institute, where they studied the competitiveness of Greek exports and productivity and concluded (emphasis added):
Greece’s productive know-how corresponds to a much lower GDP per capita, far below that of its peers, even after years of economic contraction. It effectively has an export basket with similar sophistication to that of Tunisia supporting a lifestyle like Sweden.
Conclusion: The good news is already in the market on Greece. There will be more drama and ups and downs of negotiations in the next few months. Expect the perception of Grexit to rise again.


China: Don't look at the stock market!
The gyrations of the Chinese stock market is mesmerizing, but I have urged readers to avoid paying attention to that market as it is not truly reflective of China's economy. Pay attention to the more important matter, which is the fact that Chinese economic growth is slowing.

Last week, China report that its 2Q GDP growth came in at 7.0% and the report was greeted with disbelief. As an example of the many skeptical reports, Fathom Consulting estimated that its own growth estimate was closer to 3%, instead of the official 7%:
With its usual efficiency, China’s National Bureau of Statistics released its 2015 Q2 growth estimate earlier this week. Reportedly, GDP rose by 7.0% in the four quarters to Q2. We remain sceptical about the accuracy of China’s GDP data, and the speed with which they are compiled. Our own measure of economic activity — the China Momentum Indicator — suggests the current pace of growth is nearer 3.0%.


Who actually believes that 7.0% figure? To be sure, there were some "special effects" in that GDP growth report (via Business Insider):
Bloomberg's chief Asia economist Tom Orlik points out that the recent boom in the Chinese stock market boosted the financial sector, and caused it to grow at more than twice the growth rate of the whole economy.

The sector may have added a whopping 0.5 percentage point to the GDP print, according to Orlik.

As I have pointed out before, China has been a major engine of global growth and slowing growth will impact many of her trading partners. Here is William Pesek:
Singapore is the closest thing Asia has to an economic barometer. Its highly open, trade-reliant economy usually signals when trouble is approaching the global stage. And at the moment, Singapore is flashing clear warning signs.

The city-state's gross domestic product plunged 4.6 percent last quarter, a downturn almost certainly triggered by China. Singapore's plight may mark a dangerous inflection point not just for Asia, but for the entire global economy.

After the 2008 global crisis, China's 9-percent-plus growth picked up the slack from a West licking its financial wounds. But as Asia's biggest economy cools, officials from Seoul to Brasilia are finding themselves without a reliable growth engine. Uneven recoveries in the U.S. and Europe have already slowed the exports that power most Asian economies, including Japan. China's downturn could now throw Asian manufacturing into reverse.
The combination of slowing Chinese growth and Fed rate increase later this year could prove to be very bad news for many emerging market economies, such as South Africa and Brazil, as well as Asia. This is a key risk that does not appear to be fully discounted by the market.


US fundamentals looking shaky
In the US, the economy seems to be stuck in second gear and starting to show signs of deceleration. The BoAML economist pointed to a study of the usefulness of economic indicators, based on their timeliness, revision noise and the relation to fundamentals (via Business Insider).


The top two indicators on that list is showing signs of slowdown. Here is a chart of the Philly Fed Index, whose YoY rate of change appears to be fairly well correlated equity returns - and the index is showing signs of deceleration.


The second most important indicator, initial claims, is flashing signs that employment growth may be hitting its speed limit. (also see this analysis from New Deal democrat where he lays out the case that hiring is hitting a mid-cycle pause). Last week was the first week in four that initial unemployment claims have beaten expectations. As a reminder, this chart shows the high level of correlation between initial claims (in blue, inverted scale) and stock prices (in red).


Here is a close-up of the above chart, which shows the worrisome uptrend trend in initial claims (recall the initial claims inverted scale where down=up).


The bottom line is changes in growth outlook impact sales and earnings, which drive stock prices. 2Q earnings season is just getting under way and results are coming in a tad below expectations. The latest report from John Butters of Factset shows that both the earnings and revenue beat rates are slightly below historical averages. More importantly, forward EPS estimates have begun to tick down again, which is worrisome as the direction of forward EPS estimates have been highly correlated with stock prices (chart annotations are mine).


Ed Yardeni provided some confirmation of the fundamental weakness. The YRI Fundamental Stock Market Indicator, which is described as a coincidental indicator of stock market strength, has been flat in the past few weeks and may be rolling over, even as stock prices have risen (annotations are mine).


All of these possible negative macro and fundamental are highly preliminary, but they do serve as an advance warning of incipient weakness. As changes occur at the margin, further deterioration in macro and fundamental factors have the potential to depress stock prices.


Market internals are awful
The technical picture of the US stock market is frankly awful. Even as the major indices advanced last week, I saw widespread instances of glaring negative divergences. On Friday, I tweeted the following chart of the negative breadth divergence in the NASDAQ 100:


Jason Goepfert pointed out that the huge Friday NASDAQ advance was achieved on negative breadth, which has negative historical implications.


The SPX breadth picture wasn't much better. Even as the index advanced to test the old highs, the equal-weighted index dramatically underperformed the float weighted index, bullish percentage remained in a downtrend and the same could be said of SPX above their 200 dma. All of these are key indicators of non-confirmation of market strength.


In addition, credit market risk appetite was not improving. As the chart below shows, the relative price performance of junk bonds against Treasuries is showing a pattern of lower lows and lower highs even as stock prices rallied.


Sentiment models are mixed. Retail investor sentiment is pointing a crowded long. Mark Hulbert was at the San Francisco Money Show and he was disturbed by the number of greedy investors that he found there:
Here’s another straw in the wind that we’re close to a stock market top: Greed sells, while fear does not.

I draw this worrisome conclusion from this week’s San Francisco Money Show, where hundreds of investment gurus are giving workshops and seminars to thousands of investors. I count on the fingers of one hand the presentations dedicated to managing risk and how to avoid losses.

In contrast, there were numerous workshops catering to greed, with advisers enticing investors with the prospect of triple- and even quadruple-digit returns.

This is a worrisome situation, according to contrarians, because at market tops greed completely replaces fear as investors’ primary concern. (Disclosure: I am also speaking at the Money Show, focusing on a contrarian analysis of prevailing market sentiment.)
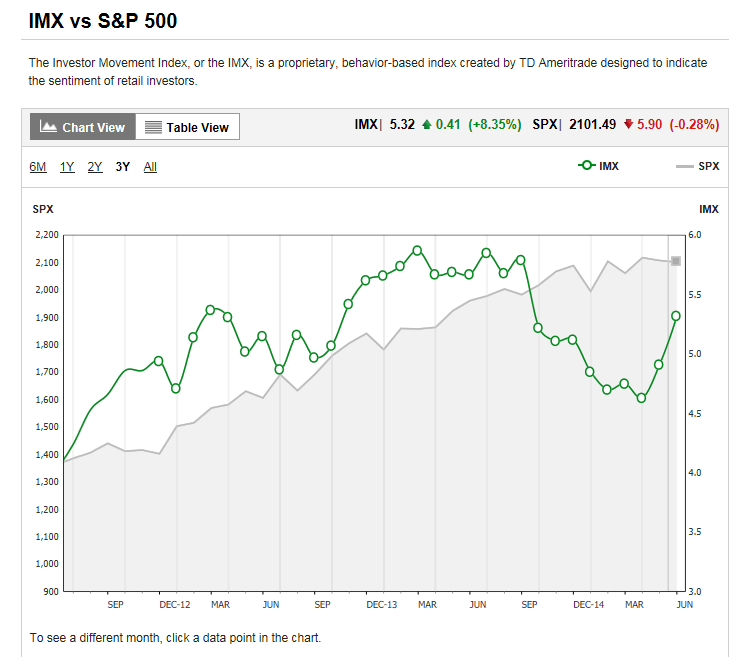
The latest TD-Ameritrade IMX index, which is a measure of TD-Ameritrade client activity, confirms rising individual investor bullishness as it showed that they have been buying stocks hand over fist:


There was some excitement when the latest BoAML Fund Manager Survey showed a high cash level, which is contrarian bullish. However, Urban Carmel pointed out that an examination of manager sector weighting showed them to be overweight high-beta sectors and underweight defensive sectors. So call that result a wash.


Silver linings
Despite these negatives, I could find a few silver linings in the dark cloud from other sentiment indicators. The latest survey of NAAIM managers, which consists of RIAs who mainly manage retail money, shows that their equity exposure is falling hard, which is contrarian bullish.


Despite the flaws in its construction, the CNN Money Fear and Greed Index is still showing a bearish reading. Stock prices may not be ready to stage a major retreat until this index gets back to at least a neutral level.


I interpret these readings as the market being overbought, but not sentiment models need to return to a more neutral condition before a sustainable drop can be seen.


The week ahead: More choppiness
Last week ended with SPY, the SP 500 ETF, rallying on falling volume and ended the week testing a key resistance level, RSI at either overbought levels or at resistance and VIX trading at a keys support.


In the meantime, this chart from IndexIndicators shows that the market has screamed upwards and moved from an oversold to an overbought condition in a very brief period. Moreover, the tick down of the last couple of days in the net 20-day highs-lows is also indicative of the breadth deterioration that have I pointed out.


Notwithstanding the breadth divergences, which may not matter over a one-week time frame, these conditions are worrisome. The most obvious conclusion that I can draw is the market is likely to decline and retrace its gains in the week ahead. Even if you were bullish and believed that the market is likely to break out to new all-time-highs, it would be difficult to be buying here with so many overbought readings across the board.

This chart of the % of stocks above the 50 dma may outline a possible possible scenario that resolves the excessively fear readings in the Fear and Greed and other sentiment indicators.We see the deterioration even as the market advanced (purple line). A pullback and rally could see bullish sentiment improve, but see the mirror image of the positive divergence seen about a week ago (in red circles) of the indicator as the SPX grinds up again to test the highs again. If a pullback does emerge, then the bulls' first key test is holding the 50 dma at the about 2100 level.


Bottom line: Expect a near-term bearish bias early in the week but further market volatility in the days ahead. My inner trader took profits on his long positions last Wednesday and took a preliminary short position in the markets Thursday. He is staying flexible and waiting to see how the market reacts in the days ahead before taking on further commitments.

My inner investors remains calm and he has some dry powder so that he can pick up stocks at lower levels. There is minimal risk of a recession on the horizon and therefore a major bear market is highly unlikely.

Disclosure: Long SPXU

Wednesday, July 15, 2015

Can you actually replace an analyst with a robot?

Last week, the WSJ had an article entitled "Can You Tell the Difference Between a Robot and a Stock Analyst? Wall Street tries out research reports written by artificial intelligence":
Each day, Wall Street churns out millions of words encouraging investors to buy or sell stocks, bonds and mutual funds.

In the future, more of those words might not be written by humans.

As automation in financial services grows, computers and algorithms have taken on some of the traditional work of traders, clerks and financial advisers. Now, a host of startups that use artificial intelligence to write news stories and other reports have set their sights on writing work at banks and financial-service companies.
The article claimed that Artificial Intelligence, or AI, is taking over much of the task of analysis:
Narrative Science Inc., which launched in 2010 with computer-generated news articles, added products for financial-services businesses in 2013. Those firms now account for 60% of the company’s client base. Last year, Automated Insights added insurance company Allstate Corp. to a roster of clients that includes Yahoo! Inc.and the Associated Press. Other startups offering automated reports for financial-services firms include Yseop, Capital Cube and Goldman Sachs GS 0.37 % -backed Kensho Technologies Inc.

As artificial intelligence takes on ever more tasks, Wall Street is getting more comfortable putting it to use. Services launched in recent years are now gaining traction because the technology has become more sophisticated and banks are looking for ways to cut costs and increase efficiencies.


What do analysts do?
To evaluate the claim that AI could take over the job of company analysts, let`s consider the job of a sell-side equity analyst, from the tasks that are the easiest to replicate to the ones that are the hardest:

  1. Report on industry and corporate developments
  2. Issue buy and sell recommendations
  3. Communicate insights about a company and its industry
Most individual investors focus on (1) and (2), while institutional investors appreciate and pay for (3). Indeed, the job of reporting on industry and corporate developments could be automated today. A number of news organizations have experimented with using software to put out company earnings reports using a standardized template.


The "quant" investing robot
The task of issuing buy and sell recommendations have also been computerized for years. It's called quantitative investing, but differs from fundamental investing in a key way. Typical quantitative investing techniques rely on factors, such as the insight that "low P/E stocks tend to beat the market". So what you do is buy a whole bunch of low P/E stocks.

Where quantitative investing differs from the kind of fundamental investing done by company analysts is the degree of confidence in the forecast. Quants tend to take a statistical approach and buy a large and broad portfolio of low P/E names, whereas a company specific fundamental analyst will have a far higher level of confidence in his forecast.

Richard Grinold pioneered a principle of portfolio management called "The Fundamental Law of Active Management" which boiled down to the idea that you should bet in proportion to the degree of confidence you have in your forecast alpha (see my previous discussion Examining your assumptions: The Fundamental Law of Active Management). Based on those ideas, a typical quant portfolio will hold between 100-300 stocks, because it is betting on factors or models, whereas a typical fundamentally driven stock picking portfolio will have 20-60 names.

Today, you can buy quantitative system insights from outfits like Value Line, which has had an impressive multi-decade track record, and ranks stocks with Timeliness rankings of 1 (best) to 5 (worst). Does that count as a robot replacement? (Yes, I know that Value Line has human analysts, but not all ranking systems do and I use Value Line purely as an example of a quantitatively driven buy-hold-sell system.)


What is fundamental analysis?
It is the more "creative" part of fundamental analysis that will be difficult for AI software to replicate and model. 

Let me give you an example. Early in my career, I had the privilege to work with a small cap analyst who went on to be a portfolio manager and now the co-head of equities of a major asset management firm. From watching what "Doug" did, I gained invaluable insights that made me a much better quant later in my own career. Small cap analysis is different from being an industry analyst because the drivers for each company and industry are different. When he picked up coverage of a company, Doug would spend several weeks chasing down what he believed the important drivers of value for a company by speaking to the company, its competitors, suppliers, customers and industry association. He would often waste days and weeks chasing down blind alleys only to discover that the issue that he was researching was irrelevant. Only once he had developed a framework for understanding how the business worked would he actually build the spreadsheet for valuing the company`s shares.

Can AI software do that? I doubt it, largely because we don't fully understand how human creativity works yet.

No doubt, we can build software to perform analysis according to certain standardized templates. Perhaps smart software might have been able to read financial statement footnotes to figure out the kinds of risks that Enron had been taking, as the Street seemed oblivious. Can software do channel checks to gain insights as to the public perception of a new product launch, maybe. Those levels of sophistication are probably one or two generations ahead - for now.

As well, investment insights are multi-dimensional and different fundamental analysts may have different insights that institutional investors find valuable and will pay for. As an example, I recall that as a portfolio manager, I derived different levels of understanding of tech darling Nokia during the late 1990's from different analysts. 

The American analysts were much better at business strategy. Nokia was the dominant producer of cellphones and had enormous economies of scale advantages to their then rivals like Motorola, Ericsson, Samsung and others. Nokia's handset operating margins were in the high teens whereas the margins of their best competitors were in either high single digits or low teens. That, reasoned many US analysts, was a source of competitive advantage for Nokia and what made the stock a buy.

By contrast, the European analysts were much better at on-the-ground analysis of the success (or failure) of new handset models rolled out by the major European handset makers. That kind of channel check insight was also a source of tactical advantage. In effect, I read research from the American brokers for the big picture and spoke to the local European brokers because they knew where all the bodies were buried.

Risk is multi-dimensional. Alpha is multi-dimensional. We are not at that stage of software development where AI can give us insights for everything. True, many of the basic reporting functions can be replaced by software - that's not where the real analytical insight comes from.


Tuesday, July 14, 2015

Profit by buying America, selling China and Iran

Regular readers will know that I am fond of trend following models that spot persistent macro trends, but stock indices have been rather choppy and range-bound for most of 2015. However, I believe that I have identified a couple of macro trends that are likely to be long lasting.

First, consider this three-year chart of the relative performance of US equities (SPY) against global stocks, as represented by the MSCI All-Country World Index (ACWI). US stocks have been in a relative uptrend against global stocks and that trend is continuing.


Second, I have been written much about China and its slowing economy. Investors should not get overly mesmerized over the wild gyrations of the Chinese stock market, as they are not representative of the economy. Instead, I have long advocated using more indirect means to gauge the health of their economy, such as the stock markets of China's major Asian trading partners. Recently, I wrote (see Back to our regular programming (of 2011), emphasis added):
Here is a chart of the "Greater China" markets, which consists of the stock markets of China's major Asian trading partners. Every single market is struggling with its 200 day moving average (dma), which is often used to delineates bull and bear markets, and, with the except of the Korean KOSPI, below its 200 dma. Investors have been overly focused on the gyrations of the Chinese stock market, which is divorced from the Chinese economy. If you want to really watch what is happening with Chinese growth, watch the "Greater China" markets - and they don't look healthy at all.


China is the largest marginal consumer of most commodities. If Chinese growth were to slow, then commodity prices are likely to suffer the most. 

Putting the theme of global US equity leadership together with the idea of slowing Chinese growth, we can search for profit opportunities by buying sectors that are most exposed to the US economy and selling or shorting the sectors most exposed to the Chinese economy, namely commodities. In addition, the idea of commodity weakness also dovetails well with the news of the Iranian nuclear deal, in which additional Iranian crude is likely to flood an already oversupplied oil market this December.


Leaders and laggards
I therefore offer for your consideration, a few leading and lagging sectors. The charts below show the relative performance of US healthcare stocks (XLV), consumer discretionary stocks (XLY), energy stocks (XLE) and metal and mining stocks (XME) compared to the SPX. Sectors that are most sensitive to the US economy have been outperforming, while commodity sensitive sectors have lagged.


Four pair trades
This leads me to consider four pair trades, from the most timely to the least, at least for now. Here is Healthcare vs. Energy, which has been in a steady relative uptrend. The Relative Strength Indicator (RSI) is flashing as series of what my former Merrill Lynch colleague Walter Murphy used to call "good" overbought readings indicating an uptrend.


Here is the chart of Consumer Discretionary vs. Energy. This pair is also showing a solid relative uptrend and what appears to be the start of some "good" overbought readings.


The chart of Healthcare vs. Metals and Mining stocks appear a bit extended technically, largely because of the weakness of the Metals and Mining group.


The same could be said of the Consumer Discretionary vs. Metals and Mining pair trade.


Pairs trading is a relatively sophisticated strategy and it isn't for everyone, particularly for neophytes who are uncomfortable with short positions. As well, traders should understand some of the subtleties of risk control in pairs trading. However, these are some pair trades that represent some macro themes that are likely to be persistent into the future.

Sunday, July 12, 2015

Back to our regular programming (of 2011)

Trend Model signal summary
Trend Model signal: Risk-off
Trading model: Bullish (upgrade)

The Trend Model is an asset allocation model which applies trend following principles based on the inputs of global stock and commodity price. In essence, it seeks to answer the question, "Is the trend in the global economy expansion (bullish) or contraction (bearish)?"

My inner trader uses the trading model component of the Trend Model seeks to answer the question, "Is the trend getting better (bullish) or worse (bearish)?" The history of actual out-of-sample (not backtested) signals of the trading model are shown by the arrows in the chart below. In addition, I have a trading account which uses the signals of the Trend Model. The last report card of that account can be found here.
Trend Model signal history

Update schedule: I generally update Trend Model readings on my blog on weekends and tweet any changes during the week at @humblestudent.


Short term bullish, but...
Last week, I suggested that 2011 served as a template for near-term market action, but I wasn't sure what part of 2011 we were in. Were we in the initial stages of the decline (the SPX is only down -4% peak-to-trough in 2015), or in the choppy part after the fall in the summer of 2011? Whatever the outcome, the stock market is likely to be volatile going forward (see Getting set for the market of 2011).


Indeed, we saw more volatility last week, but at the end of the day it appeared that the US equity market had seen the conditions for a short-term bottom (see my last post Another short-term bottom?). While I am cautiously optimistic about the upward near-term path for stock prices and the trading model flipped from "bearish" to "bullish", I am less certain about the duration and magnitude of the next bull move. Depending on how the markets react to events, the trading signal could easily change back to "bearish" next week.

Let me summarize the bull and bear cases.


Bull case: Falling tail-risk + Continued US economic growth
The bull case can be summarized quite easily this way. Tail-risk is diminishing and the US economy looks fine. So chill!

In the last couple of weeks, the market has been mesmerized by the market crash in China and the drama over Greece. In both cases, tail-risk has been falling, though the underlying problems aren't fixed yet.

Despite Beijing's rather heavy-handed attempts at intervention, Bloomberg has a great summary of what has been happening in the Chinese stock market:
  • $3.9 trillion in wealth destruction;
  • Over 1400 companies had their trading halted;
  • Shanghai is 5X more volatile than the SPX;
  • $232 billion in margin loans outstanding (and the market is falling faster than margin loans, which indicates further margin selling pressure ahead);
  • $19 billion committed to support the market; 
  • Dual-listed shares are 33% cheaper in Hong Kong, which indicates that market equilibrium prices are below Mainland quoted prices; and
  • 90 million retail investors in China feeling the heat.
I had been concerned about two effects of the Chinese stock market crash on US equities. First, could contagion risk leak into global market? The second was the effects of slowing growth on the Chinese and global economy. An examination of the dim sum bond ETF, which are RMB bonds issued in Hong Kong, show that the credit markets were not overly disturbed by what was happening the Chinese stock market. This suggests that contagion risk remains relatively low.


In addition, the immediate economic economic effects of the stock market crash appears to be limited. Here is Marketwatch:
Although an estimated 80% of Chinese shares are owned by retail investors — ordinary Chinese — less than 7% of the country’s overall population own stocks, based on government figures. And a study by Charles Schwab estimates that just 20% of Chinese household wealth is tied up in stocks. More than half of their wealth is in more liquid cash or bank deposits.

By contrast, the Federal Reserve estimates that nearly 14% of individual Americans own stocks directly, while a Gallup survey calculates that 55% of Americans own stocks through a variety of investment vehicles such as 401(k)s, pension plans or mutual funds.
No doubt, the household sector will get hurt. However, attempts to quantify the effects amount to no more than 0.5% of GDP growth in a worst case analysis:
Using common economic assumptions related to the wealth effect and taking into account the smaller influence of the Chinese stock market on the Asian economy as a whole, Barclays estimates that a more severe contraction in equity prices would trim a few tenths off gross domestic product.

But with China growing about 7% a year it wouldn’t amount to much.

“This looks to us like an unwelcome but far from insuperable headwind, not a knockout blow,” wrote Michael Gapen, senior economist at Barclays.

Another study by Bank of America Merrill Lynch predicts up to a 1/2-point reduction in Chinese growth in a worst-case scenario. The firm also pointed out, however, that “cratering Chinese stocks in 2007-08 had little discernible impact” on its own growth or the economies of other countries such as the United States.
As for Greece, events are fast changing even as I write these words. We went into the weekend believing that this would be a make-or-break 48-hours for Greece. Either the creditors accept the latest Greek proposals or there would be an EU-wide discussion of how to effect Grexit in an orderly fashion. In hindsight, such an expectation would have be way too easy for European theatre.

Without going into more excruciating details about what happened on the weekend, consider the motivations of the major players:
  • Alexis Tsipras has capitulated to the creditors' demands and, it would be unthinkable that he would backtrack despite the additional demands placed on Greece after expended the political capital to make the post-referendum U-turn.
  • Angela Merkel does not want to go down in history as the Chancellor to dismantle not only the eurozone and fracture the EU over French and Italian objections about how Greece is being treated. It would therefore be unthinkable that she would push Schaeuble's temporary Grexit plan in the end.
  • The ECB well understands the limits to its political role in the eurozone. With active discussions going on and a possible deal in sight, it would be unthinkable that the ECB Governing Council would take the political decision to pull the plug on the Greek banking system on Monday.
It appears that we will have another typical kick the can down the road European solution, with more drama and summit meetings in the week ahead.

In conclusion, we have seen much bad news endured by the markets in the last couple of weeks and the SPX has reacted by falling and then bouncing off its 200 dma. As  tail-risk from Greece and Chinese stock market related events is diminishing, any downside risk to US equities from these sources of tail-risk is therefore likely to be limited in the near future.


US fundamental supportive of gains
The other key ingredient of the bull case is the continued growth seen in the US economy. JP Morgan Asset Management recently wrote that past bear markets had these common features (with my comments in parenthesis):
  • Recession (no sign of a full-blown recession ahead)
  • Commodity spike (you have got to be kidding, commodity spike?)
  • Aggressive Fed tightening (instead we have an ultra cautious Fed)
  • Extreme valuation (valuations are elevated, but not stupidly high)

The latest update from John Butters of Factset indicates that, as we stand at the start of another earnings season, forward 12-month EPS estimates continue to rise. As the chart below shows, rising forward EPS has historically been highly correlated with high stock prices (annotations in red are mine):


At the same time, the markets have freaked out and sentiment and breadth readings are at extreme fear levels, which are consistent with short-term bottoms (see Another short-term bottom?). Two of the components of my Trifecta Bottom Model flashed another buy signal last week and this model has been 100% accurate in the last three years (though less so in more serious bearish episodes of 2010 and 2011).


Looking out the next few weeks, the Summation Index, a key measure of market breadth, is oversold and at levels that has seen the market rally in the past six years. I have shown the NYSE Common Stock only Summation Index, which my preferred metric, in the middle panel and the more commonly used NYSE Summation Index in the bottom panel. Both indices at about the -400 level and I have highlighted past instances when the respective indices have become oversold, as defined by the slow stochastic shown, and reached the current level of -400. If the past is any guide, current conditions should be good for a rally of at least 2-3 weeks.


So what are you so worried about?


Bear case: Unfinished downside business
I'll tell you what I'm worried about - the bear case for stocks consists of a poor technical outlook and signs of flagging global growth which could spook the markets after an oversold rally.

The technical damage done by the recent market swoon is evident worldwide. I thought that I would switch gears a little bit this week and show some point and figure charts of selected indices as the technique eliminates the noise of day-to-day volatility. For the sake of consistency across different charts, I have defined the box size as 0.5% with a 3-box reversal. Here is the SPX, which has rolled over and violated an uptrend line that began last October:

The technical breakdown in the more broadly based Wiltshire 5000 is more pronounced and looks more serious.

The Dow doesn't look any better. The key takeaway here is that we are seeing signs of a broad based technical breakdown across many US equity averages, which suggests that the intermediate term trend has changed from up to down.

As we look across the Atlantic, the Euro STOXX 50 peaked in April and has been rolling over. Despite the reflex rally we saw last week from a possible Greek deal, this index remains in a downtrend.

The decline in European stocks is a concern from an inter-market perspective. I continue to see broadly based weakness in global stock markets and commodities, which is a sign of falling global growth. 

Here is a chart of the "Greater China" markets, which consists of the stock markets of China's major Asian trading partners. Every single market is struggling with its 200 day moving average (dma), which is often used to delineates bull and bear markets, and, with the except of the Korean KOSPI, below its 200 dma. Investors have been overly focused on the gyrations of the Chinese stock market, which is divorced from the Chinese economy. If you want to really watch what is happening with Chinese growth, watch the "Greater China" markets - and they don't look healthy at all.


Commodity prices, which is a key barometer of Chinese demand, has been falling. In particular, the cyclically sensitive industrial metals have been weak in both euros and Australian Dollars during a period when the US Dollar Index has been flat.


My key takeaway from the charts of "Greater China" and commodity markets is the Chinese economy is slowing. As China is one of the major engines of global growth, a Chinese slowdown could see global repercussions.

Indeed, the IMF cut to its growth outlook in its July WEF update. What was surprising was the weakness did not come from China or the eurozone, whose growth estimates was left unchanged, but the US and emerging market economies. The IMF's estimated 2015 US growth rate fell from 3.1% in April to 2.5% in July. There were also significant 2015 growth downgrades in southeast Asian EM economies and Latin America.

A recent CNN Money report indicates that Latin America is especially vulnerable to a China slowdown:
The three "C's" are weighing down Latin America: China, commodities, and currency.

The region boomed last decade when its commodities, like iron, copper and food, were in high demand.

But China drove that demand. Now Chinese construction companies are pumping the brakes while the government tries to stop its bleeding stock market. That means less Chinese cash is coming to Latin American countries. Oil's tanking prices have hurt the region too.

And then comes currency. The U.S. dollar's strong rise this year has helped it gain a lot of ground on Latin American currencies. That makes it more expensive for Latin Americans to buy imports and, for some companies, more expensive to pay debt that's in U.S. dollars.

Colombia's currency has lost 13% of its value this year against the dollar. Brazil's real has lost 21% and Mexico's peso continues to slide too.

There's likely one more punch to Latin America from the U.S. this year: the Federal Reserve's long-awaited rate hike.
Indeed, credit market risk appetite as measured by HY bonds, which has been my most reliable short-term (2-4 week) indicator of market direction in 2015, continues to show a pattern of lower highs and lower lows.


The lack of enthusiasm by the credit market for risk has to be a cause for concern. However, Friday's rebound in HY vs. UST relative returns was quite dramatic and the pattern of falling risk appetite could improve significantly in the near future. I will be monitoring this very closely.


The week ahead: The bulls have much to prove
In a way, forecasting the market action last week was easy compared to next week. The grossly oversold conditions last week made the market ripe for a bounce, as shown by this chart from IndexIndicators of the average RSI(14) of SPX stocks.


This chart is somewhat more constructive for European equities, at least in the near-term. Note the positive divergence - the DAX Index is falling, but the average RSI(14) remains range-bound. These readings, in both cases, suggests that equities are oversold and the path of least near-term resistance is up.


Next week will be more challenging. My base case scenario calls for a rally of unknown magnitude lasting at least 2-3 weeks, which would be followed by a decline into the ultimate low for the year. As the chart below shows, the SPX bounced off its 200 dma, which acted as technical support. The next logical resistance level will be the 50 dma at about the 2100 level. Depending on the strength of the rally, we could see further strength that conceivably test the old highs.


On the other hand, the markets are never that simple. Despite a reduction of tail-risk as both the Greek and Chinese stock market situations appear to have stabilized, event risk continues to haunt the markets. An alternative scenario could see the SPX descend back to test the 200 dma and, depending on sentiment and technical conditions, fall through those support levels.

My inner trader got long when the crowded short readings appeared last week and he remains nervously long. Volatility has returned to the markets and he plans on defining his risk carefully, having a plan with different scenarios and reacting as necessary.

I wrote before that we are likely to see 2011-like volatility and it appears that scenario is more or less coming to pass. So I turn you back to our regular programming of 2011. Note that under 2011 scenario, that trading model "buy" signal flashed this week may turn out to be very short-lived, depending on how the market action develops.

My inner investor is keeping some powder dry in anticipation of buying stocks at better prices. The fundamentals for US equities remain positive and there is little to be afraid of.


Disclosure: Long SPXL

Wednesday, July 8, 2015

Another short-term bottom?

US equities are getting oversold again. Roughly a week after the last severely oversold signal (see Time for a market bounce?), I am seeing oversold signals all over the place.

In that post, I highlighted my Trifecta Bottom Model (for full details of the model see Time for a market bounce?), where two of the components had flashed buy signals, which sported a 100% batting average in the last three years. I have marked with blue vertical lines past instances where two of the three components have flashed buy signals and in red vertical lines past instances where all three components have simultaneously flashed buy at the same time.


Even though the last signal resulted in a wimpy 1% bounce in the SPX, here we go again with another buy signal a mere six trading days later.

To be sure, I would point out that the Trifecta model is an oversold model. During prolonged declines such as the ones we saw in 2010 and 2011, oversold models don`t necessarily work all the time because oversold markets can get more oversold.


Other signs of an oversold market
Besides my trusty Trifecta model, I am seeing other signs of a crowded short and oversold market. The CNN Money Fear and Greed Index fell to single digits at a reading of 8, which is a level where the market has bottomed in the past.


The CBOE equity-only put-call ratio has risen to 0.87, an elevated level indicating excessive fear while the SPX is testing a key support level.


Finally, this chart of the SPX shows that it breached its 200 day moving average, a key support level. However, RSI(5) is in oversold territory and showing a positive divergence. At the same time, RSI(14) is at the bottom of its 2015 range and stubbornly refuses to get oversold, suggesting that it is nearing a support level and may be due for a bounce.


How should we interpret all this? On one hand, the SPX violation of its 200 dma could be construed as a technical break and this could be the start of a cascade pointing to much lower prices. On the other hand, technical and sentiment indicators are flashing oversold signals which suggests that, even if we take the position that the intermediate trend is down, the market may need to stage an oversold rally first before falling further.

In all likelihood, we are on the verge of an oversold rally. Should it occur, the first logical resistance would be the 50 dma at about the 2100 level, but let`s take this one step at a time. Next week is option expiry week, which tends to lend an upward bias to stock prices. On the other hand, we do have the tiny detail that the EU may decide to blow up the Greek banking system this weekend, which is an event which could cause *ahem* a considerable reduction in global risk appetite.


Disclosure: Long SPXL

Tuesday, July 7, 2015

Greece: How both sides are right AND wrong

I really hope that this is my last post on Greece for a long, long time...

I recently wrote a post on Greece on how both sides are right and both are wrong at the same time (see What would happen after a "Speech of Hope"?). I lamented that both Greece and Europe were talking past each other instead of at each other. Part of the problem was that they were speaking different economic languages (macro vs. micro-economics):
It is also the story of two parties talking at each other instead of with each other. The Greek approach, which is top-down and macro oriented, rests with the idea that somehow the country can return to sustainable growth if the macro problem of excessive debt were to be lifted (and hopefully coupled with some form of stimulus plan).

By contrast, the (mostly) German plan is highly bottom-up and micro-economic oriented. Its underlying philosophy calls for getting the right market mechanisms in place, e.g. cost structures, labor market reforms, the right incentives, etc., and growth will naturally follow. The problem with this approach is that Greece, unlike countries like Ireland, has few competitive advantages. The EU mandated solution amounts to forced internal devaluation. It would mean that, in the example of textiles, that Greek wages would have to fall even further to levels that competes with the likes of China, Vietnam or Thailand.
Let me expand on those points.


The European Grand Plan
The European elites have a way of mapping their path for the European Project and not deviating from their plan. Mario Draghi revealed the Grand Plan back in 2012 (see Mario Draghi reveals the Grand Plan). First, the ECB would hold things together to buy time for member states to execute a set of reforms. This reforms that Draghi outlined in a WSJ interview had several components. The first was government austerity, but the right kind of austerity:
WSJ: Austerity means different things, what’s good and what’s bad austerity?

Draghi: In the European context tax rates are high and government expenditure is focused on current expenditure. A “good” consolidation is one where taxes are lower and the lower government expenditure is on infrastructures and other investments.

WSJ: Bad austerity?

Draghi: The bad consolidation is actually the easier one to get, because one could produce good numbers by raising taxes and cutting capital expenditure, which is much easier to do than cutting current expenditure. That’s the easy way in a sense, but it’s not a good way. It depresses potential growth.
The second is structural reform:
WSJ: Which do you think are the most important structural reforms?

Draghi: In Europe first is the product and services markets reform. And the second is the labour market reform which takes different shapes in different countries. In some of them one has to make labour markets more flexible and also fairer than they are today. In these countries there is a dual labour market: highly flexible for the young part of the population where labour contracts are three-month, six-month contracts that may be renewed for years. The same labour market is highly inflexible for the protected part of the population where salaries follow seniority rather than productivity. In a sense labour markets at the present time are unfair in such a setting because they put all the weight of flexibility on the young part of the population.
The purpose of structural reform is to attack the youth unemployment problem by getting rid of the idea of a job for life mentality (emphasis added):
WSJ: Do you think Europe will become less of the social model that has defined it?

Draghi: The European social model has already gone when we see the youth unemployment rates prevailing in some countries. These reforms are necessary to increase employment, especially youth employment, and therefore expenditure and consumption.

WSJ: Job for life…

Draghi: You know there was a time when (economist) Rudi Dornbusch used to say that the Europeans are so rich they can afford to pay everybody for not working. That’s gone.
What Draghi outlined in 2012 were micro-economic prescriptions. Get the economic structures and incentives right and growth follows. That has been the template all along.

There is one other important core element that`s been somewhat lacking in executing these structural reforms: Governance. George Magnus pointed to a book by Stathis Kalyvas, Modern Greece: What Everyone Needs to Know, as an explanation:
The clue is governance. Professor Kalyvas traces some roots here back to Greece’s emergence from an economically backward, agrarian corner of the Ottoman Empire into an aspiring modern state. Specifically, he notes the considerable challenge of trying to graft liberal and democratic institutions and practices on to such a society. Put another way, public administration, the structural backbone of the modern state, is in Greece’s case unfinished, and in some respects even un-started, business.

With this in mind, it becomes clearer why creditors have moaned that Greek governments often lacked the capacity to implement reforms properly or, in some cases, at all. In Syriza’s case, the problem of lack of capacity has been accentuated by lack of willingness. This year, both sides argued a lot about debt relief, primary surpluses, VAT rates and pension arrangements. But many of their disputes were bridged or narrowed significantly. What irks Europe most about Syriza is the latter’s inaction with regard to initiatives to overhaul governance. In other words, to improve the capacity to implement reforms by addressing dysfunctional institutions such as administrative capacity, a weak tax system, over-regulation and protection, corruption and the rule of law, and the privileges of oligarchies, professional associations and other vested interests.

Reflecting these flaws, Greece has tended historically to protect domestic sectors, nationalise weak or failing firms, rely on credit creation as a substitute for productivity growth, and use political patronage to expand growth in the public sector. The PASOK government (1981-89), for example, is argued to have created dysfunctional public administration, civil service and wage-setting institutions that were associated particularly with corruption, mismanagement, maladministration, and disregard of the rule of law.

Even in subsequent years, entrepreneurship and industry were left behind. Greece has not developed a vibrant, successful export sector, other than in tourism and a few agricultural products. Unlike, say Poland, the Czech Republic, Turkey, and much of Asia, including comparable per capita income countries such as Vietnam and Bangladesh, it hasn’t got a viable manufacturing sector. The World Bank’s annual Doing Business survey (2015) still ranked Greece at 61 of 189 countries around the world, with positions close to the bottom in the registration of property, and contract enforcement.
These kinds of cozy relationships are not unusual in cultures where the population doesn't trust the sovereign (government is the wrong word in this case) because the sovereign can change at any time. In such instances, trust is not formed based on bureaucratic structures such as the rule of law, but on family and clan-like relationships that have been created over the years. These cultural norms are common not only in southern Europe but in much of Asia.

In a way, the election of Syriza might have been a hope that a new administration could sweep away many of the cozy and corruption that have plagued Greek society. Magnus went on to complain that Syriza did nothing of the sort:
Ironically, Syriza articulated a made-to-measure analysis and diagnosis of governance problems in its 2014 Thessaloniki programme, which sought to end “decades of misrule”, and transform Greece’s political system and institutions. It argued quite coherently that this was essential to break the vicious circle between political and economic inequality.

Yet, since being voted into office, it has offered little and done less to live up to this transformation. It is telling that Europe’s final loan conditions before the referendum laid considerable emphasis on governance enhancement, spanning measures to strengthen transparency, price competition, privatisation, and the rule of law, and to attack corruption, fraud and tax evasion. Alexis Tsipras rejected these and other conditions, and lumped them together, accusing his counterparts of blackmail. But without addressing these crucial matters, Greece cannot hope to succeed inside or outside the eurozone.
A recent article in the Guardian echoed similar concerns:
What Syriza has done is to bring back some of the worst excesses of its predecessors. The state broadcaster ERT – scrapped abruptly by the previous government under the impulsive and irascible conservative, Antonis Samaras – has been reformed. But instead of fresh blood, the government put ERT’s tainted former leadership back in charge. The return as chief executive of Lambis Tagmatarchis, a television executive associated with the governments who ran up Greece’s debt pile, outraged even the ERT employees who were getting their old jobs back. From prefectures to court appointments, party hacks have been favoured over more qualified counterparts. This is indiscernible from the cronyism of old.

The gap between Tsipras’ rhetoric on social justice and progressive policy and his record in office has left some to conclude that Syriza is more intent on consolidating its power than delivering the reforms-for-cash deal with creditors that he claims to still want. If not a deal, then what does he want, critics ask?
So when Europe talks about reforms, that's really code for:
  1. Getting rid of the corruption that have plagued governance
  2. Austerity, but the right kind of austerity (which seems to have been given a lower priority in the latest round of negotiations) 
  3. Structural reforms, in order to get rid of the "jobs for life" mindset and make it easier to fire people
Without step (1), the entire task becomes monumental.


The top-down view of Greece
The Greeks, however, approach their debt problem from a top-down perspective. It's all well and good to talk about structural reforms, but there has to be a limit. This chart of Euro area statistics show that Greek unit labor costs have come down considerably compared to Germany. How much more micro-economic adjustment can Greeks take?

The Greek economy is a modern macro-economic disaster. This chart from RBS shows that Greece experienced a GDP collapse that has not been seen other than war or the Great Depression (via Business Insider).


Tom Keene at Bloomberg summed up a way of analyzing the Greek macro outlook with The Formula, as outlined by Paul De Grauwe:


Keene explained it this way:
The Formula is timeless and in each and every basic economics text. (It gets less respect because it is a dry-as-dust fiscal equation compared with the steamy romance of monetary math.) In fiscal crises, the best-and-brightest always trot The Formula out. The truth is the dynamic simplicity of The Formula's core -- the (r-g) in the above -- always bears repeating.

The relationship is: A nation's debt-to-GDP ratio is equal to the critical dynamic of its nominal interest rate (the "r" in the above formula) minus its nominal growth rate (the "g"), applied to the previous debt-to-GDP ratio and then all of that compared to the nation's overall growth rate. Then take that movable feast and subtract the massive weight of its primary budget surplus. It is a deceptive and simple relationship but, in crisis, there is one key moving part. The key moving part, again, is (r-g). The "g" must equal or be higher than the "r" in The Formula. If the nominal interest rate ("r") is higher than the nominal growth rate ("g") then the government will face an ever-increasing debt-to-GDP ratio.
Longer term, Greece needs growth to be higher than its nominal interest rate. Another way to get relief is to change D(t), its debt to GDP ratio, which is what Athens is seeking.

Greece was quick to seize on the IMF report that the Greek debt position is not sustainable without €50 billion in debt relief over the next three years. The Syriza government has seized on that report to bolster its position to ask for debt writoffs in its negotiations.

Ah, but the devil is always in the detail! Antonio Fatas pointed out some inconsistencies between the assumptions of the IMF report and Greek government positions (think about this in the context of The Formula above, emphasis added):
Can we be more realistic regarding Greek prospects of growth? That's what they IMF is doing now. It forecasts growth in Greece to be input 1.5% in the long term. This is what I would say a very pessimistic number (even if it might still be realistic). It assumes that a country that has a GDP per capita of less than 50% of the most advanced economies in the world will fail to converge to that level, in fact it is likely to get stuck at that level or even diverge.

And here is where the Greek government and the IMF projections might be at odds. The Greek government argument is that once debt is reduced and all the reforms are implemented, the Greek economy will take off and start finally growing. But if growth returns, is debt really unsustainable Greek debt is unsustainable because the Greek economy will not grow in the long run (and this is not just about austerity). But if the Greek government is right and the reduction in debt does indeed raise the potential growth of Greece then the current debt level might be closer to being sustainable than what the IMF says. In other words, the IMF tells the Greek government something that they want to hear (debt needs to be reduced) but in an scenario that the Greek government cannot accept (growth is going to be dismal for decades).
At the end of this debate, we have to ask ourselves as to who is right and who is wrong.


A pragmatic view
I am just a simple investor and trader. The question of who is right and who is wrong is well beyond my pay grade. I am more interested in what is likely to happen. I agree with Yves Smith, who has taken a far more pragmatic view of the situation (emphasis added):
Greece faces multiple impediments. The biggest is that financial time moves faster than political time. Greece needed a deal by June 30. Going past that event horizon, as events are going to prove out, tipped the scales decisively against Greece by given the creditors cover to give their real enforcer, the ECB, free rein. Changing values and ideology are decades-long projects, so moral appeals might make for nice op-eds but will not change the power dynamics in time to have any impact. Look at how long it took for women’s rights and civil rights to become accepted in the US, or even with extremely deep pockets and the most sophisticated messaging money can buy, how long it took corporate interests to move values in the US decisively to the right. Greece was far too small and economically weakened to confront the creditors and have any hope of succeeding unless it got support. Its only conceivable allies are nowhere to be found. The Obama Administration has gone all in with the Eurocrats and the European left has been missing in action.

As we’ve said from early on, many commentators on Greece have wanted to make Syriza into something other than what it is. Despite the bold talk and some Marxist trappings, the core of the party leadership is moderates and its base consists heavily of disaffected Pasok voters, not hard core leftists. And this sadly, is the flaw of the stirring call to action in this post. Even after its incredible suffering, Greece is not as radicalized as those outside Greece would like to believe. The high percentage of Greeks saying, even on the eve of the referendum, that they still wanted to remain in the Eurozone, shows that Greek society is not willing to make a break even from its punitive overlords Syriza’s new coalition with centrist, pro-business parties should dispel any doubt as to what Syriza really stands for, as opposed to what Tsipras would like you and Greek voters to believe.
Here are the two basic scenarios that I am working with. Either Tsipras' ultimate objective is to take Greece out of the euro, which would also put their EU membership at risk, or there will be a deal.

If there is a deal, everyone will have to save face. The EU will make Greeks swallow tough Grand Plan restructuring reforms. At the same time, they will be able to demonstrate that the Greeks are taking sufficient pain that the other euroskeptic parties watching this drama will be deterred from taking the same path. The Greeks will get some form of back door debt relief, either as NPV debt writeoffs* or some form of aid in the form of humanitarian or military aid to help with their budget.

In other words, it will be the typical European fudge solution. Everything else is theatre.


* Imagine if you owed $1 million but couldn't pay. You then negotiate a settlement where you pay $1 a year for the next million years. The face value of the debt stays the same, but the net present value drops dramatically.