The exact details of the Inflation-Deflation Timer model are proprietary, but I can answer that question in a number of indirect ways that address the big picture.
In general, I would characterize current market conditions as being akin to being in the bottom of the ninth inning, with the bulls trailing by two runs, with two outs and one man on base. The bulls still have a chance to tie the game but they face an uphill battle.
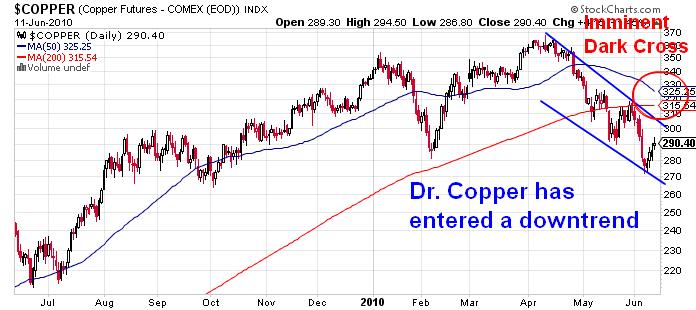
I see downtrends…
Putting my technician's hat on, I noted in my last post that Dr. Copper was in a downtrend. I would like to see a cyclically sensitive metal such as copper rally to break the upper band of the downtrend line before I feel comfortable that the threat of a deflationary panic has subsided.
The relative chart of the Morgan Stanley Cyclical Index (CYC) compared to the market tells the same story. CYC broke down out of a relative uptrend in mid-May and is now testing the upper band of a relative downtrend line. I would like to see CYC/SPX line to decisively break out of its relative downtrend line as a signal that the US economy is not moving into double-dip territory.

Over the weekend, I read other technicians coming to the same conclusion (a typical example here). The market is in a downtrend, but there has been support evident at the 1044 level on the SPX. While the existence of the downtrend suggests that the bears have the slight upper hand, technicians cannot discern a direction until the pattern is resolved (either by upside breakout or by support violation).
Macro forecasters: High risk zone
From a macro-economic perspective, respected forecasters are confirming my ninth inning assessment that the US economy is at serious risk of a double-dip recession. David Rosenberg (free registration required) wrote on Monday that the latest reading in the ECRI Weekly Leading Indicator shows an 80% probability of a double-dip recession:
[W]e can safely say that this barometer is now signalling an 80% chance of a double-dip recession. It is one thing to slip to or fractionally below the zero line, but a -3.5% reading has only sent off two head-fakes in the past, while accurately foreshadowing seven recessions — with a three month lag. Keep your eye on the -10 threshold, for at that level, the economy has gone into recession … only 100% of the time (42 years of data).
John Hussman of Hussman Funds came to a similar conclusion as Rosenberg and me. In his latest weekly comment, Hussman notes that the conditions for forecasting a double-dip recession are almost all fulfilled. It is possible, however, that his indicators could strengthen and a double-dip is avoided.
In short, both the technical and top-down macro picture are telling the same story. The bears are leading in the bottom of the 9th inning. Can the bulls rally and tie the game?
3 comments:
Perhaps it is 'Trailing by two bottom of the ninth', but it's also likely to be an early season game with a whole summer of bat'n'ball waiting for us.
Good post as always, Cam. Thanks for the brainfood.
My novice technical analysis comparing FXI with JCC seems to suggest that China equities is a leading indicator of Copper by 1-3 months, while Copper is more coincident indicator of global growth. Perhaps equity investors react first (to potential economic slowdown), then the commodity investors? Perhaps the recent relative strength of FXI could bring about rebound in Copper in the next 1-2 months?
Wimpy -
For what it's worth, David Rosenberg also observed some time ago that the Shanghai market seems to lead commodity prices by about 3-4 months.
Post a Comment