Showing posts with label markets. Show all posts

Monday, October 10, 2011

Sideways consolidation before the next downleg?

Last week featured some very volatile market action. Equities remained highly sensitive to newsflow and rallied on stories that the French and Germans were putting together plans to recapitalize banks (finally!). Then on Friday, you had the rally in the morning to the better than expected Non-Farm Payroll release and the fade when Italy, Spain and a number of UK banks got downgraded.

What's going on?

My interpretation is that the stock market had fallen too far too fast and it's now due for a multi-week period of sideways consolidation. The problems in Europe haven't gone away, nor has the threat of an American recession, which appears to be inevitable. As we move through 3Q Earnings Season in the next few weeks, the markets likely to be range-bound and volatile - until the newsflow worsens, which I believe will occur in about one or two months.


Market recap
I recently wrote about what the bulls need to do to take control and the bulls have achieved many of those objectives. The stock market rallied through its downtrend line, though considerable overhead resistance awaits. The technical picture spells stalemate, or a range-bound market in the near term. The bulls have managed to contain the damage and make a goal line stand, but they need to show more to win the game.


The rally through the downtrend is even more evident in the broader NYSE Composite


...and in the Euro STOXX 50, which has been the source of much market angst:


Cyclicals are behaving a bit better as they showed a similar pattern of rallying through a relative downtrend:


I had written before about my concerns about the banking sector. It is interesting to see that the Regional Banks have rallied through a short-term relative downtrend, though the longer term relative downtrend remains intact. In addition, this group remains below a multi-year relative support level that was violated in August (and now represents resistance).


How to interpret these conditions? Here is the take from a guest blogger on Slope of Hope that studied previous stances of support violations and subsequent market rallies [emphasis added]:
Two things I want to draw your attention to in all three of these charts are MINOR violations of established lows ESPECIALLY when followed by sharp reversals and the level of volume.  In each chart, following a sharp decline, we usually see a consolidation period lasting approximately two months at which time a minor break and recovery occurs (of course, sometimes a major break occurs such as in Nov 2008, but I’m talking about minor breaks followed by quick reversals).  Usually, a positive divergence also forms in the RSI and MACD indicators (which only means the trend is shallower).  At this point, we either see a rally or another leg down.
Given the negative news backdrop of an inevitable Greek default and imminent US recession, my base case scenario still calls for another downleg after a period of sideways consolidation.


Europe can't muddle through
I have come to the conclusion that most of the market is too short-term focused and doesn't really care or even want to understand the seriousness of the problems in Europe. Consider this interview with Satyajit Das. His best line was, "A orderly default is like an orderly car crash at 120mph". Right now, the Eurocrats are trying to install the airbags just before the crash and the markets are fixated on every one of their moves.

Over the next few weeks, there are likely to be some positive headlines out of Europe. The EU will likely acquiesce and give Greece the next tranche of aid in order to buy a few more weeks of time. France and Germany are finally trying to put together a plan to recapitalize banks. Barrosso at the European Commission has confirmed the work behind the scenes by making noises about recapitalization plans. However, there will no doubt be all sorts of squabbles about the scope of the plan and its details, as shown by Sunday's Merkozy non-statement of "we will do everything we can to support the banks" when it was evident that there were considerable divisions going into the meeting.

As you watch the headlines, don't forget the ultimate endgame. Greece is going to default. It's just a question of when and how. HSBC has written about the breakup of the eurozone, which was once unthinkable (via FT Alphaville). Under such a scenario, Greece would get kicked out of the EU and the results are going to be very, very, very ugly:
What would happen to the exiting country?

*The assets and liabilities of the banking system would, most likely, be redenominated at a rate of one-to-one with a view to a quick depreciation.
 *Capital controls would have to be put in place both because of the still large current account deficit and to limit daily cash withdrawals in order to avert a collapse of the banking system which would no longer have access to ECB liquidity. If a euro exit were in any way anticipated the bank runs would have already happened.
*Default would not eliminate the need for fiscal adjustment as primary balance is still in deficit so overnight even more austerity would have to be delivered than under the Troika plan. Assuming this is politically unfeasible, the central bank would undertake debt monetisation.
* Increased likelihood of defaults by companies now holding FX-debt which would also result in a raft of legal challenges in creditor nations.
*With no nominal anchor, there would most likely be a wage-price spiral (especially if the central bank is printing money) which would quickly eliminate any competitiveness gains unless it undertakes massive structural reforms
*Very hard to reinstate a legacy currency (probably become euro-ised particularly in the tourism sector and the large informal sector)
*Technical hurdles would be huge: legal, computer codes would have to be rewritten, ATM machines reprogrammed etc
*Would have to leave to EU and could face the imposition of trade tariffs from its members
That's just what happens to Greece. As for the rest of the eurozone:
*Huge contagion to other peripheral countries given that a precedent has been set for a country to leave: bond spreads blow out as foreign investors flee, widespread runs on banks which will have also suffered a credit event.
*The ECB has to respond to with vast liquidity provision and government bond purchases as the EFSF would not be able to issue debt quickly enough to make the necessary purchases
*ECB and all private sector and official creditors would have to completely write off their debt claims on the exiting country. The IMF would likely be the exception given its preferred creditor status and because its assistance may be sought again soon
*A full-blown credit crunch on a scale that would make 2008 seem mild and economy falls into a deep recession
*Member state governments could seek recourse under British Law for the loans extended under the bailout package
In other words, the global banking system would have a major heart attack. Other Apocalyptic scenarios are floating about. George Soros has likened the current European situation to the collapse of the Soviet Union. Others are talking about the 1930s and a Creditanstalt-like event. The blogger Fabius Maximus has compared the current state of affairs to 1914, when Europe stumbled into an inevitable Great War that eventually destroyed empires.
 
 
Controlled default = Amputation?
If a default could be "orderly", the procedure is, at best, like a limb amputation. Notwithstanding the consequences for the patient, its results would reverberate around the globe. An orderly default needs a few ingredients. Firstly, you need a credible plan to recapitalize the banks. Going Swedish is my preferred policy solution, but such an approach would devastate pension plans and the insurance sector all over Europe and most probably around the world too.
 
The second key ingredient of an orderly default is the cooperation of the ECB. Already, the Trichet ECB has said that they will supply eurozone unlimited liquidity until January 2013. Will Super Mario be more pragmatic and play ball? Or will he need to demonstrate that, despite being Italian, he is more German than the Germans as he becomes the head of the Vichy...err...European Central Bank in his attitude to QE? (Recall that the ECB doesn't have the dual mandate of the Federal Reserve and its only mandate is to control inflation.) If the ECB doesn't cooperate in a Swedish style banking recapitalization with a round of QE, then the recap plan would fail. (Note that the ECB itself has said that it will not be tendering to the "voluntary" Greek debt restructuring, largely because such a move would render the central bank insolvent. It would then either need to go to member states for more capital if they are unwilling to undergo quantitative easing).
 
Lastly, Greece has to cooperate and not do an Argentina. The Greek middle class is getting increasingly squeezed and it's unclear how much more austerity they can take (see stories here and here). Also, can someone tell me why they are buying 400 American tanks in the middle of a financial crisis?

Even under a best case scenario, an "orderly default" might be likened to the amputation of a limb in order to save the patient. Even after an "orderly default", what about the other periphery countries? In this week's commentary, John Mauldin visited Ireland and wrote the Irish believes that they will be "offered" a haircut by the EU:
When you press politicians and establishment types (and I did) who are against unilaterally disavowing the debt, a strange thing happens. I kept asking, "But the voters seem to want to forego the debt. And the math suggests that Ireland can't pay back these foreign bankers without great sacrifices." At first, they would point out that Ireland is doing what needs to be done: cutting spending and payrolls. We are not Greece, they say; there is a need for "respectability." But when pressed, they would come around to admitting that, "Yes, Ireland will get a haircut." Everyone I met expected it to happen. The difference was the path to the haircut. But while the politics matter, the destination is the same.

Some favor doing it outright. Others truly believe they will be offered a haircut when Greece and Portugal get theirs. They fully expect it. In a meeting with an establishment-insider economist (off the record), who was at the table when the first deal was done, he said there was an implicit understanding with the IMF (and ECB) that whatever was offered to Greece, et al. would be available to Ireland. So Ireland went along with the bailout to keep from imploding the euro and averting a crisis that would have been biblical in proportions. The future of the euro is now not in their hands, because by taking on the debt they did not blow the euro up. Which could have happened, because European politicians were not ready for such a crisis.

So rather than having to kick the door open for a haircut, they expect the door to be opened for them by the IMF and the ECB. A far more respectable path for those who are very pro-Eurozone. But Irish leaders clearly get that voters expect that something will be done. They have time, as it will be another three-plus years before elections. By then, the crisis will have fully evolved and resolved itself, as far as the political public is concerned. And politicians will take the credit, as they always and everywhere do.
Then don't forget Portugal, Cypress...

 
An imminent American recession
Across the Atlantic, the recent ECRI recession call was notable in that their model has not had a false positive in its history, which is quite an accomplishment. More puzzling is the recent flow of economic data, which has been weak, but not at recessionary levels.
 
Bruce Krasting has an interesting five-Friday hypothesis as an explanation for the recent non-recessionary data points. September 2011 had five Fridays. For workers who get paid every two weeks, this meant that they got paid three times in September - which would have distorted the data. Krasting went on the point out that October 2010 had five Fridays, whereas October 2011 has four Fridays. If the "five Friday effect" was the main cause of the distortion in the economic data, then we are likely to get a negative surprise when the October figures get released about a month from now.
 
My medium term outlook remains the same. I agree with seasoned analysts like John Hussman and ECRI that a US recession is baked in. In that case, earnings are likely to come down 20-40% as per James Bianco. If we were to see a market panic, trailing market P/Es could hit as low as 10, which means that US equities have the potential to revisit their 2009 lows.
 

What about China?
Then we need to consdier the China wildcard. As I pointed out in my commentary last week, the markets will start to price in the possibility of a Chinese landing as the American and European economies weaken into recession. Already, we are seeing headlines about a credit crunch in China and Chinese home prices dropping for the first time in a year. These developments are particularly worrying as the shadow banking system in China has grown by leaps and bounds, which is creating a Chinese subprime-like problem (see one discussion here). Significantly more negative developments out of China or other emerging market countries could throw a fright into equity markets and other risky asset classes.

 
Inner investor still defensive, inner trader mildly bearish
My inner investor tells me that a financial winter is coming but there is no need to panic. Just as spring follows winter, the global economy will heal itself and investors can survive and prosper again. Have a plan to manage your way through such periods of market volatility. With that in mind, he offers the following suggestions:

  • Be the predator and not the prey: Food is scarce in winter and predators will take the opportunity to pick off weakened prey. Should the markets panic, asset prices will sell off into unreasonably cheap levels as weakened investors raise cash to meet margin calls, or worse, pay their bills. If you are sufficiently liquid and have sufficient resources, then there will be great opportunities to pick up assets at distress prices as the weak sell to the strong. At the very least, make sure that you are not the weakened prey.
  • Store food for the winter: From a tactical viewpoint, either get more liquid or take positions in default-free US Treasury bonds whose prices are expected to rally from a rush into safe haven assets. A Canadian investor with a US Treasury bond position has even greater upside potential because the Canadian Dollar is likely to weaken against the US Dollar in such an environment. I use the Asset Inflation-Deflation Timer Model to time my entry and exit points.
  • Be opportunistically prepared to buy: Looking longer term, the Fed and other central banks will react to deflation. Low or negative real interest rates generally signal a friendly investment environment for commodity prices. Continued government and/or central bank accommodative policy responses will likely push real interest rates even lower and add to even more future asset inflation. Investors who are opportunistic or prepared to look over the valley can view periods of market weakness as opportunities to accumulate positions in commodities or commodity producers as a hedge against asset inflation.
My inner trader, on the other hand, is moving to a more neutral, though bearish, stance in wait for the next major move. He believes that near term volatility is highly likely and headline driven.

As BCA Research (via The Economist) points out, under these current conditions of European uncertainty the demand curve for periphery bonds is not necessarily well-behaved (i.e. monotonically downward sloping) but can twist and therefore multiple equilibria is possible. Hence the volatility depending on news. changing risk preferences and shifts in sentiment.


Cam Hui is a portfolio manager at Qwest Investment Fund Management Ltd. ("Qwest"). This article is prepared by Mr. Hui as an outside business activity. As such, Qwest does not review or approve materials presented herein. The opinions and any recommendations expressed in this blog are those of the author and do not reflect the opinions or recommendations of Qwest.

None of the information or opinions expressed in this blog constitutes a solicitation for the purchase or sale of any security or other instrument. Nothing in this article constitutes investment advice and any recommendations that may be contained herein have not been based upon a consideration of the investment objectives, financial situation or particular needs of any specific recipient. Any purchase or sale activity in any securities or other instrument should be based upon your own analysis and conclusions. Past performance is not indicative of future results. Either Qwest or Mr. Hui may hold or control long or short positions in the securities or instruments mentioned.

Friday, August 5, 2011

Reason over passion

The carnage in the markets on Thursday was truly breathtaking. By the time the European markets closed, it was clear that there was nowhere to hide in the US.

The broad based US stock market averages were down 4-5% on the day. "Defensive" sectors such as utilities, consumer staples and healthcare were down -3.3%, -3.2% and -4.0% respectively. While the returns of these sectors outperformed the averages, it was cold comfort to investors who lost 3-4% in a single day.

What about gold? Aren't we told by the gold bugs that it's the only "real money" and the only source of stability in a crisis? Oh, never mind...


In the words of Dennis Gartman, Thursday was the example of a "margin clerk market", where everything was liquidated to meet margin calls or to de-risk portfolios. The only green on my screen were bonds and bond ETFs.


Do you have a credible plan?
To be a successful investor, you must have a disciplined and credible plan and you must follow it during these periods of market turmoil. I have a plan and it's called the Asset Inflation Deflation Timer Model. I rely on it to be tactical in asset allocation and the Timer Model designed to make money in sustained bull markets (by buying risk) and sustained bear markets (by buying long-dated Treasuries).

To put the weakness into context, equities are down slightly over 10% on a peak-to-trough basis. Although short and dramatic, this recent bout of market weakness puts it into the category of a plain vanilla correction.

While I remain concerned about the risk of financial contagion in Europe and a double-dip recession in an already weakened US economy, I am relying on the discipline of the Timer Model to stabilize my portfolio during periods of extreme stress, e.g. a Russia or Tequila Crisis. Otherwise, I could be panicked into making self-defeating decisions at precisely the wrong time.

Do you have a credible plan and are you following it?

Monday, June 20, 2011

The dam breaks

When it rains, it pours. On Friday Macro Man detailed the big macro concerns the market faces (TMM=Team Macro Man), namely the US, Europe and China:
TMM reckon that the current state of the World can be described as follows:


The US: The slowdown is dramatic (more on this below) but positive actual GDP prints, a Pavlovian dog-like response in the form of dip-buying on weakness (learned over the past two years), and a belief in the Fed coming to the rescue have prevented both the PhD and punting community from embracing a negative view.

Europe: Smoke is coming out of the tail pipe, kangaroo-ing down the the road. Going to break down soon.

China: "DON'T TALK ABOUT ANYTHING NEGATIVE!" as China is the only hope the West has. It seems to TMM as though punters are looking through to the peak in inflation and holding onto the soft-landing view - something they sense from the fact that most commentaries on China they receive seem to talk about how too many people are fearful of a hard landing/inflation etc... where is the *real* consensus?
Of the three, I am least concerned about the US macro outlook. It appears that market is pricing in growth of about 2% but it is about to decelerate to 1%. Add in the end of a dose of QE2 market steroids, the adjustment process for the equity market will likely be painful, but such a move is best classified as a plain vanilla correction of 10-20%.


Europe's Bear Stearns moment?
The problems in Europe and China, however, have Russia Crisis or Lehman Crisis written all over them. Matthew Lynn, writing in Marketwatch, expresses the consensus opinion that a deal will be done to save Greece:
Forget all you’ve read about it being a catastrophe for the markets when it happens, however. Only things that nobody really forecast make prices move in any dramatic fashion. A Greek default is about as unexpected as Rafael Nadal making the finals at Wimbledon this year.

In reality, it is already priced in. And the Germans and the French aren’t going to let it happen until they know their banking systems are safe — so there isn’t going to be a Lehman-syle collapse.
Felix Salmon, on the other hand, believes that a Greek default has not been priced in by the market:
[N]o one has any idea what would actually happen in the event of a Greek default. In order for markets to be pricing in a default, traders would have to be buying debt now on the expectation that if Greece defaults the price of its debt would not fall further. I don’t think anybody’s doing that yet — as Stopford says, they might be taking risk off, but they’re not expecting catastrophe. If Greece were actually to default, I’m pretty sure that markets would fall further.

In 2008, Bear Stearns' hedge fund imploded in July - a precursor to the Lehman collapse a few months later. The Greek situation is starting to look a lot like Europe's Bear Stearns moment. Looking more closely, Joseph Cotterill at FT Alphaville writes that the ECB is caught between a rock and a hard place. Greek banks are experiencing a run on their assets, but where do they go for funding?
But whatever has caused the depositor flight, it’s odd that not many are making the connections to Greek bank funding at the European Central Bank. Having fewer deposits to draw on, the only other place Greek banks can go for replacement funding is from the ECB. That means pledging more, not less, Greek government-backed collateral.

So, what are we to make of the ECB’s repeated threats to cut off the collateral’s eligibility if the Bank is prevented from dictating terms on a bond rollover?
I have been closely watching the relative strength of the Banking Index (BKX) as a barometer of the market perception of systemic risk in the financial system. Previous technical breakdowns have been signals of serious problem, i.e. Russia Crisis (1998) and Subprime Crisis (2007). Looking at the chart, the relative strength of the BKX just broke down:


Uh-oh...
 
The relative performance of the BKX is important is because exposure to European credit doesn't stop at the shores of the Atlantic. No one quite knows how much indirect exposure American financials have to European credit in through the credit default swap (CDS) market. Kash at The Street Light has made a stab at estimating the exposure:
As last week's new BIS data showed, it appears that US banks indirectly have substantial exposure to the peripheral Euro-zone countries that are teetering on the edge of bankruptcy. Exactly what form that exposure takes is a bit uncertain, though it seems likely that much of it is in the form of credit default swaps (CDS) written by the US banks to provide insurance against default to the holders of bonds from Greece, Ireland, and Portugal.

But it's a bit frustrating not to have a clearer understanding of exactly what form this exposure takes. So I've been trying to see if there is any public information that can give us a hint about exactly how the big US banks have incurred such exposure.
The problem is, no one really know. Here are his tentative conclusions:
1. Bank of America, Morgan Stanley, and Goldman Sachs are the most aggressive in terms of taking open positions on default outcomes. But we have absolutely no idea how much of those positions (if any) were with peripheral Euro assets. Also, while the last two firms don't break out income attributable to CDS activities (at least not that I could find), B of A made a huge portion of their profits in 2010 from them. (Note that Citi did not indicate how much of the CDS protection that they sold was covered by purchases of CDS insurance, so they may or may not be in that list as well.)

2. The aggregate CDS exposures of the big US banks are certainly large enough to be plausibly consistent with the BIS estimate of about $100 bn in indirect exposures to peripheral Europe. If you add up the highlighted numbers (and make a guess at Citi's position), it seems reasonable to guess that the total net open positions on CDS protection sold to third parties by the big US banks is between $1,500 and $2,000billion. Attributing $35 bn of that (about 2%) to Greece, which has certainly had one of the most active markets (proportionally) for CDS contracts over the past year, doesn't seem to be a stretch.

3. Banks do not have to provide much detail about the indirect credit exposures that they take on when they sell default insurance through the CDS market. We have incredibly scant information about the positions that US banks take through default insurance, and therefore no idea about how any individual bank will be affected by a Greek default.

4. It's hard to find any other potential exposures to Greece, Ireland, and Portugal in the banks' public filings, other than through CDS contracts. Combined with points 2 and 3 above, the process of elimination suggests to me that CDS contracts are indeed likely to be the source of the bulk of US banks' indirect exposures to a Euro-zone default.
As for the current Greek crisis, I am sure that the troika will find the few measly euros to tide the Greeks over to the next deadline (though Mish has reported that Der Spiegel claims the agreement negotiated between  Merkel and  president Sarkozy has collapsed and Bloomberg reports Europe will pressure Greece by withholding half of the next tranche of money). In the next round of negotations that begin in July, the rescue numbers start to get much bigger. If the Greeks default or restructure, the Apocalypse looms. Here is what I think happens next:
  • The Irish, the Portuguese and the other peripheral countries will cry, "What about us?" The troika may the resources to rescue the Greeks, but they will be faced with a wall of protests to "reschedule" other peripheral debt. As an example, consider this interview with Kevin O'Rourke on the Irish attitude that the EU "owes" Ireland for bailing out the Irish banks and therefore deserving of relief.
  • A flight to safety will ensue. Risky assets get sold - the result is a cascading "margin clerk" market where everything gets sold.
Does this sound like a Lehman moment about to happen?


China: The elephant in the room
In addition to the looming crisis in Europe, the risk of a hard landing in China is real and it could spark a substantial selloff in risky assets as the markets price in a synchronized global recession. Such a prospect is too scary to contemplate in a fragile global economy.

The indications of a China slowdown are already there and real estate prices are cooling. Last week Standard and Poor downgraded Chinese developers' outlook from "stable" to "negative". Moreover, the Hang Seng Index has decisively broken support, which is a sign of trouble.


The technical picture of the Shanghai Composite is more complicated. It has broken an initial level, but arguably it is now trading in a support zone.


Will the Chinese authorities be able to engineer a soft landing? It's starting to look a little dicey, given the economic headwinds of China's trading partners in North America and Europe.

Given that the markets are oversold and poised for a tactical rally, I would be using market strength as a opportunity to lighten positions.


Addendum: David Merkel pointed out to me that Bear Stearns blew up in 2007, not 2008. I stand corrected.

Tuesday, May 10, 2011

Sell in May?

In the wake of the commodity rout last week, the Inflation-Deflation Timer Model has moved into "neutral" from an "inflation" reading*. This told my inner trader that he should take some risk off the table. Given the high level of macro risk, I would be inclined to take more more defensive position than usual.

This signal to de-risk isn't a surprise. In early April, I wrote about negative divergences (see Getting ready to sell in May). How the market reacts to news is also a good short-term indicator of direction. The fizzled Osama bin Laden rally should have been as clear as ringing the bell in the town square to traders that this market was looking tired.


What happens now?
Now that the Timer Model has gone neutral, what happens now? Mr. Market could take one of two paths.

First, this could be the start of a run-of-the-mill 5-10% correction in the equity market, with an extreme downside limit of about 15%. VIX and More has tabulated the market pullbacks in the 2009-11 period and the average depth of these correction was 6.5%.


Macro risks everywhere
I am concerned that the market is acting vulnerably during a period of heightened macro risk. There are three major sources of macro risk:
  • Europe: As I write this, Greek 2-year debt is sporting an eye-popping yield north of 25%. These stratospheric levels reflect market fears that bond holders will have to take a significant haircut on Greek debt, which would be a devastating blow to the already fragile European banking system. If Greece re-structures, then it could very well take down Spain - which may be too large for the EU to rescue.
  • China: The PBoC has signaled that it will take further steps to cool its superheated economy and there are "no limit to how far it can raise the reserve requirement". Already, there are signs that its property bubble is being deflated. Recent reports indicate that Chinese property developer profits are falling and their debt is approaching $1T in a climate of rising inventory.
  • US default: The political horse-trading over the debt ceiling continues to be worrisome. A default by the US Treasury would send shockwaves all around the globe and it would be the financial equivalent of the comet that hit the Earth and created the Gulf of Mexico in prehistoric times.
The current market environment is likely to resolve itself with a plain vanilla 5-10% correction. However, if any of these macro risks were to manifest themselves during that pullback, the downside has the potential to extend itself to 40-50%.

My inner investor has already heeded these warnings and de-risked his portfolio. My inner trader is inclined to be more defensive than normally called for.


* The announcement of signal change was delayed on this blog out of consideration for the clients of Qwest Investment Fund Management.

Tuesday, March 15, 2011

A test of the Bernanke Put

As I write this, the Nikkei was down 10.5% on the back of worsening news about its nuclear plants. The STOXX has cratered 3.5% and most global bourses are down 2-3%. Dow futures are off over 200 points. Meanwhile, the bond market is on a tear.

Today also happens to be the day of an FOMC meeting. Going into the meeting, there had been some speculation that the Fed may come out with a more hawkish statement in order to bolster its own inflation fighting credentials.

...but then there is a problem of that "explosion" in Japan. Assuming that the tendency is for the Fed to become more vigilant on the inflation front, how would the FOMC statement reflect those concerns in light of the market turmoil? Aren't central bankers genetically programmed to be financial fire fighters?

This is a real-time test of the Bernake Put. All eyes should be on the FOMC statement at 2:15 EST.


Addendum: The BoJ has already take steps to inject liquidity into the system. Is the FOMC watching headlines like Bank of Japan Fails to Contain Investor Panic as Nuclear Danger Escalates? Stay tuned.

Monday, February 28, 2011

Thinking bearishly, tradingly bullishly

I spoke to a number of investors about my market views that the current weakness is a dip to be bought on Friday and got back a number of comments to the effect of "what about the risks?" I therefore want to expand on my thoughts on the broader big picture issues.


Stimulus-tightening boom-bust cycles
The global economy had an enormous accident in 2008 and thereafter. The monetary and fiscal authorities managed to patch things up, though not necessarily in the right way. The level of risk has therefore risen considerably. We are now running on our spare tires and another growth pothole (Chinese slowdown, European sovereign debt crisis, US municipal bond implosion, etc.) could send us back into another global recession and imperil the health of the banking system.

Given the weakened state of the global economy, we are likely to see a series of stimulus-tightening boom-bust cycles, much like the Japanese experience of the last two decades.

Japan's Lost Decades

The market was weak last week over the Libyan unrest spreading to the rest of the Middle East. Minor supply disruptions like that can scare the markets but they resolve themselves over time. Any possible new regime will need the oil revenues and turn the taps back on. What I was more concerned about were the broader macro risks, such as the results of the Irish election and risks posed to the European banking system.


Shades of 2007/8?
In the intermediate term, the backdrop is ominous. The current environment reminds me of late 2007 and early 2008. Then, we had a commodity blowoff, equity overvaluation and looming macro risks. Today, we have a commodity blowoff, equity overvaluation and looming macro risks.

Barry Ritholz pointed out an analysis from Alain Bokobza of Société Générale indicating that forecasts have become overly optimistic and asset prices are poised for a tumble.

Société Générale's Economic Surprise Indicator

In the short run, it appears that the Fed is determined to throw a party with QE2 by targeting asset prices. In the event that the Tunisian-Egyptian-Libyan contagion were to spread rising oil prices began to create risks to economic growth and employment, then who doesn't expect QE3. That way, short-term problems are papered over but somewhere between QE3 and QE33, the medicine stops working and then we all get into big trouble.


Navigating the boom-bust cycles
Given this kind of volatile macro backdrop, I have opted to use an intermediate term trend following model like the Inflation-Deflation Timer Model to trade the boom and bust cycles.

For now, my technical, sentiment and industry indicators are all pointed up. Nevertheless, I am terrified of the macro risks. I am relying on the risk control discipline of the Timer Model to limit losses while allowing winners to run.

In other words, I am thinking bearishly but trading bullishly.

Monday, September 27, 2010

How big is the Pension Time Bomb?

Most of my more astute readers already understand that defined benefit pension funds is a time bomb waiting to explode. Now a new study that suggests that we don't even known how big the problem is.

To set the stage, the Wall Street Journal recently reported that public plans haven't changed their return expectations since 2001 and still have return expectations of 8%:
The median expected investment return for more than 100 U.S. public pension plans surveyed by the National Association of State Retirement Administrators remains 8%, the same level as in 2001, the association says.
The country's 15 biggest public pension systems have an average expected return of 7.8%, and only a handful recently have changed or are reconsidering those return assumptions, according to a survey of those funds by The Wall Street Journal.
 Corporate plans are not much better:
Corporate pension plans in many cases have been cutting expectations more quickly than public plans, but often they were starting from more-optimistic assumptions. Pension plans at companies in the Standard & Poor's 500 stock index have trimmed expected returns by one-half of a percentage point over the past five years, but their average return assumption is also 8%, according to the Analyst's Accounting Observer, a research firm.
To understand how realistic an 8% assumption is. Let's assume a 60% stock/40% bond asset mix. Let's be generous and say that the bond market can return 3%. That comes to a long-term equity return assumption of 11.3%, or an equity risk premium of 8.3%!

The actuaries add to the problem
David Merkel at Aleph Blog pointed out a bigger problem, i.e. the practice of the actuarial profession [emphasis added]:
When I was a young actuary, I was preparing to take the old Society of Actuaries test eight, which was the Investments exam. An older British actuary made a comment in one of the study notes that I had to think about several times before I understood it: “Risk premiums must be taken as earned, and never capitalized.
Sadly, the pension profession never got the memo on that idea. The setting of investment assumptions accepts as a rule that risk margins will be earned without fail. Therefore, when looking at a portfolio of common stocks in a pension trust, the actuary will assume that the equity premium will be earned over the long haul and build that into his discount rate assumptions and earned rate assumptions.
In other words, if an actuary is told that the equity risk premium is 8.3%. He will build it into his models and assume, come hell or high water, that stocks will earn 8.3% over bonds over the long run.


Unstable risk premiums
So far, this is all old hat for those who have been following the pension fund time bomb story. As interest rates have fallen, the net present value of pension liabilities rise, but return assumptions have fallen enough and a big yawning pension gap is the result. Moreover, the historical experience shows that an equity risk premium of 8.3% is, shall we say, a tad high.

Those estimates of equity risk premiums based on historical experience may not be valid. I was further shaken by the publication of an important academic paper entitled  New 'Risky' World Order: Unstable Risk Premiums: Implications for Practice by Aswath Damodaran of NYU. Here is the abstract:

Investors have to be offered risk premiums to invest in risky assets. These risk premiums take different forms in different asset markets: equity risk premiums (ERP) in stock markets, default spreads in bond markets and real asset premiums in other asset markets. These premiums have their roots in fundamentals and will vary as a function of uncertainty about the economy, the risk aversion of investors, information uncertainty and fear of catastrophe, among other factors. In practice, analysts in developed markets have generally looked backwards to estimate risk premiums, using historical data to arrive at their estimates. Implicitly, they assume that historical averages are not only precise but also that risk premiums are stable and revert back quickly to historical norms. In this paper, we present evidence that risk premiums in equity, bond and real asset markets are not only imprecise, but are also unstable and linked across markets. We present estimation approaches that are more in line with dynamic, shifting risk premiums. We argue that the resulting estimates can help use make more informed asset allocation and asset valuation judgments in portfolio management and better investment, financing and dividend decisions in corporate finance.
For newbies, let me explain the importance of this paper. Millions of business school and actuarial students have been taught Modern Portfolio Theory, or MPT. It is an investment theory that tries to maximize expected return for a given level of risk by carefully choosing the proportions of various assets in a portfolio. Harry Markowitz, who earned a Nobel Prize in Economics for the theory, modern portfolio theory introduced the idea of diversification as a tool to lower the risk of the entire portfolio without giving up high returns.


Modern Portfolio Theory: A choice between risk and return


Using MPT depends on knowing, or estimating, two numbers for each asset class – risk and return. In practice, most investors estimate returns for stocks using an equity risk premium using the following procedure: Historically, stocks have returned X% over bonds. Bond yields are currently Y%, therefore we can expect a return of X + Y for stocks.

The Damodaran paper calls that estimation procedure into serious question. He concluded that historical data studies indicate that estimates of asset class risk premiums don't really mean revert to long-term averages and they are unstable in the short and long run.

If an investor doesn’t have a good estimate for equity returns, then how can he build a portfolio? Damodaran suggests that investors should look to market based indicators. Consider the bond default spread as a signal of equity risk appetite and realized vs. estimated risk as another indicator, e.g. realized vs. implied volatility embedded in equity option markets around the world.


How high the pension deficits?
In the past year alone, we have seen studies indicating $1T deficits in public pension plans and other similar stories of pending disaster. Are US public plans "only" facing a $1T deficit?

Given the results indicated by the Damodaran paper, the scary part is we don't even know.

Monday, June 21, 2010

Apocalypse avoided, for now

Last week I wrote about the possibility of another financial Armegeddon:

I have become increasingly concerned about the markets and the economy, largely because of the poor behavior of economically sensitive commodity prices. If the current commodity weakness were to persist, then conditions may be setting up for a repeat of the Great Bear of 2008.
In a subsequent post, I set out some goals for the bulls to achieve in order to stave off a “deflation” signal on my Inflation-Deflation Timer model which would signal the kind of waterfall decline that the markets saw in 2008. I pointed to copper prices and the relative price behavior of the Morgan Stanley Cyclical Index (CYC) against the market.

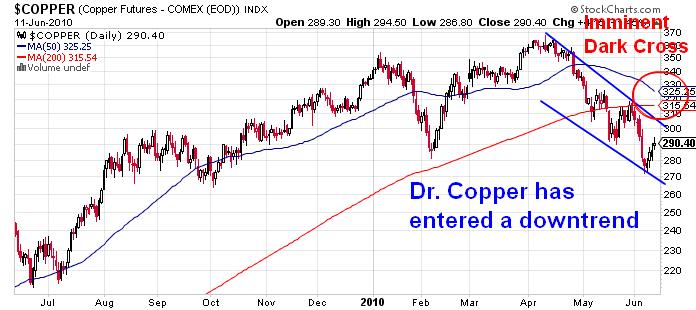
In the last week, the bulls did manage to rally the markets and achieve a stalemate with the bears, which is a victory of sorts. Take a look at the price of Dr. Copper, which rallied up through the downtrend line but ended the week lower. This may be a signal of underlying strength and a sideways pattern rather than a continuation of the downtrend. Nevertheless, a “dark cross” is imminent in copper prices indicating the development of an intermediate term downtrend.


A similar picture was seen in the relative chart of CYC vs. SPX. CYC rallied through the downtrend line but weakened again which points to a possible sideways consolidation pattern.


The good news
There are signs of good news. David Leonhart at Economix reports that private hours worked are rising in the US, which indicates that the economy is rebounding:


Jeff Matthews wrote that corporate management is reporting signs of nascent economic strength, both in the US and Europe. Such bottom-up reports from the ground are always useful antidotes to the top-down analysis from 50,000 feet.

There is good news in China. China’s economy is slowing but may be headed for a soft landing. Jeremy Grantham was quoted as China may avoid a housing bubble. The vestiges of a command economy still remain in China and her policies seem to veer between flooring the accelerator and stomping on the brakes. It appears that the authorities have decided that they have stomped on the brakes too much and it’s time to step on the gas pedal again. The Shanghai Composite appears to be finding a floor at current levels and there are signs that China’s plunge protection team is going into action ahead of the Agricultural Bank's ginormous new stock issuance.

In addition, the People’s Bank of China announced on the weekend that they are preparing for “currency flexibility”, which is code for an easing or elimination of the RMB to USD peg. Such a move would serve to ease trade tensions ahead of the G20 meeting.


Eye of the storm
Where are we now? Todd Harrison believes that we are currently in the eye of the storm and I agree with that assessment:

We've been pushing risk further out on the time continuum for such a long time that it's become an accepted -- dare I say normalized -- pattern that interconnects the world through a tangled web of derivatives.

While the recent price action has been docile, I believe we're in the eye of the storm, a relative calm between the first phase of the financial crisis and the cumulative comeuppance that'll flush -- and perhaps reset -- the system.

Harrison went on to view any downturn with a sense of optimism, because of the possibility of renewal:

I view the Great Depression as the framework for optimism. Most of society worked, great discoveries were made and formidable franchises were established.

Indeed, if the greatest opportunities are bred from the most formidable obstacles, we're about to enter a most auspicious era.

Unfortunately, I don’t share his optimistic view as I believe that the extrapolation of the American experience in the Great Depression to today has survivorship bias problems (see my comment here about what happens in the really long run). What if America today is not the America of the 1920s or 1930s, but the Britain, France or Germany of the same period? Those were the great developed market economies of the time too.

I do agree, though, with Harrison’s assessment that we are in the “eye of the storm”. We could very well be moving into Act II of the financial crisis, as postulate by George Soros as we move through the eye of the hurricane to the other side.


A time for caution
Despite the rally in risky assets last week, it's a stalemate and it would be premature to conclude that the bulls have the upper hand. The markets remain on a knife edge as the technical picture remains mixed. The above charts of copper and CYC to SPX show rallies through the downtrend but weakness back below the trend line. Could this be a headfake? Indeed, some Dow Theorists believe that the bull may be near death. The copper/gold ratio is also pointing to further stock market weakness.

Mish wrote that the Philly Fed survey, which came out last week, shows signs of weakness and the growth risks remain tilted to the downside. The ECRI Leading Indicator released on Friday continued to weaken from its negative reading the previous week. As well, the Baltic Dry Index is turning down again, indicating slowing global trade.

Despite my reservations about the downside risks, I am not panicking and I continue to maintain the discipline of adherence to the asset allocation based on the results of the Inflation-Deflation Timer model. Trader's Narrative's weekly summary sentiment surveys show that readings are not at extreme levels and give little insight to near-term market direction.

Regardless of the current model reading, the global economy and markets remain in a fragile state. The Inflation-Deflation Timer model is a trend following model and is not designed to spot tops or bottoms, but trends. Should the economy and markets turn south, there will plenty of time to capitalize on the trend.

I can only trade what I see and the current picture is neutral.

Tuesday, June 15, 2010

Trailing by 2, bottom of the 9th

Further to my last post entitled Are the markets setting up for a repeat of 2008, I received a couple of emails from readers asking exact how much commodity prices need to rally to negate the potential “deflation” reading on the Inflation-Deflation Timer model.

The exact details of the Inflation-Deflation Timer model are proprietary, but I can answer that question in a number of indirect ways that address the big picture.

In general, I would characterize current market conditions as being akin to being in the bottom of the ninth inning, with the bulls trailing by two runs, with two outs and one man on base. The bulls still have a chance to tie the game but they face an uphill battle.


I see downtrends…
Putting my technician's hat on, I noted in my last post that Dr. Copper was in a downtrend. I would like to see a cyclically sensitive metal such as copper rally to break the upper band of the downtrend line before I feel comfortable that the threat of a deflationary panic has subsided.


The relative chart of the Morgan Stanley Cyclical Index (CYC) compared to the market tells the same story. CYC broke down out of a relative uptrend in mid-May and is now testing the upper band of a relative downtrend line. I would like to see CYC/SPX line to decisively break out of its relative downtrend line as a signal that the US economy is not moving into double-dip territory.


Over the weekend, I read other technicians coming to the same conclusion (a typical example here). The market is in a downtrend, but there has been support evident at the 1044 level on the SPX. While the existence of the downtrend suggests that the bears have the slight upper hand, technicians cannot discern a direction until the pattern is resolved (either by upside breakout or by support violation).


Macro forecasters: High risk zone
From a macro-economic perspective, respected forecasters are confirming my ninth inning assessment that the US economy is at serious risk of a double-dip recession. David Rosenberg (free registration required) wrote on Monday that the latest reading in the ECRI Weekly Leading Indicator shows an 80% probability of a double-dip recession:

[W]e can safely say that this barometer is now signalling an 80% chance of a double-dip recession. It is one thing to slip to or fractionally below the zero line, but a -3.5% reading has only sent off two head-fakes in the past, while accurately foreshadowing seven recessions — with a three month lag. Keep your eye on the -10 threshold, for at that level, the economy has gone into recession … only 100% of the time (42 years of data).

John Hussman of Hussman Funds came to a similar conclusion as Rosenberg and me. In his latest weekly comment, Hussman notes that the conditions for forecasting a double-dip recession are almost all fulfilled. It is possible, however, that his indicators could strengthen and a double-dip is avoided.

In short, both the technical and top-down macro picture are telling the same story. The bears are leading in the bottom of the 9th inning. Can the bulls rally and tie the game?

Tuesday, June 8, 2010

It takes a village...

Regular readers will know that while I have a bearish bias, my inner trader believed that the market is oversold and ripe for a rally, which has so far not materialized. In the last few days, there were a number of analysis showing that we are as oversold or sentiment washed out at levels last seen during the February lows. This comment from Technical Take is a typical sample:

Judging by the emails I receive, it seems to be hard for investors to grasp the idea that I view the current market environment as a "fat pitch". If we use the analogy of a card counter in black jack, I can only determine when I bet aggressively. I cannot guarantee that I will get a winning hand even though the cards should be in my favor. Nonetheless, I would always prefer to bet when the chance for strong gains is likely. This is just one aspect of the "fat pitch". The other aspect and it may be more important than all those potential gains is that a failed signal tends to portend a poor outcome for the markets. Based upon my data, I have clearly defined risk parameters, and this is what is so good about the "fat pitch" --possibility for strong gains plus the ability to define my risk.

How things might be different
It is useful from a trader’s perspective that Technical Take qualified his comments about entering a trade with “defined risk parameters” and that “a failed signal tends to portend a poor outcome for the markets.”

Having waited in vain for a market rally, my inner trader is now tilting from bullish to bearish. The primary reason is that whereas in February, when the bulls were still in control of the tape, today the bears are in control. The change in trend is evident as there are now death crosses everywhere in large cap stocks.

There are systemic risks everywhere. A contact at a major brokerage firm recently informed me that leverage is still on at hedge funds and major institutional long-only accounts are still positioned for a recovery and not a correction. As good traders know, overbought markets can get more overbought and oversold markets can get more oversold. If bearish momentum continues to carry the day, then there is still a lot of pent-up selling to be done.

What’s more, Mr. Market seems to be infected by a global contagion. Free market economists generally believe that markets are self-correcting (and therefore oversold bounces are more likely) because there are many independent market participants expressing their views. What if the views aren’t independent but self-reinforcing? Macro Man details how self-reinforcing these views might be [for the newbies, the term "spoos" refer to the S&P 500]:

"Well it’s definitely the equity markets driving this", say the FX boys, "If Spoos drop we sell Yen crosses, so they must be driving it"...

"Can't be us", reply the equity boys, "We just sell when we see the Yen rally or spreads widen"... Oooops, don't like the sound of this...

Must be those bond boys then...? "Nah not us, we buy bunds when we see Yen strengthen and equities drop and when Libor tightens".

Must be the short term cash boys then...? "Not us, we just demand more when we see Yen rally, stocks drop, bonds rally and if one of those central banks say the banks need to increase capital requirements when they can't..."
Hillary Clinton famously wrote a book called It Takes a Village detailing how interconnected people are as a celebration of community.

I am not so dogmatic as to be married to any single model of the markets. I only trade what I see. Right now, the lack of any substantial reflex rally on Monday after Friday's precipetous drop must be a concern for the bulls.

If financial markets are indeed interconnected and the whole village is arrayed against you, then it’s time to watch out for downside risks. But regardless of your bullish or bearish views, I agree with the views of Technical Take (see above). This is an extremely volatile market and it's important to define your risk parameters.

Monday, March 29, 2010

Life in Extremistan, or Minskyville

I got some interesting feedback about my recent post when is diversification important. To paraphrase, some of the reasoned responses said that my approach of focusing on the event extremes is highly dependent on the likelihood of extreme events, or the fatness of return distributions. Already, there are warnings from the likes of BCA Research and Greg Mankiw, who was the head of George W. Bush's Council of Economic Advisors, to prepare for the next financial crisis:

A few years ago, some people thought that major financial crises were a thing of the past. We know that was wrong. Despite our best efforts, more financial crises are likely to occur. As we recover from the last one, we should prepare for the next.


How likely are extreme events?
Most people in finance recognize that while capital market returns are distributed in a bell-shaped Gaussian curve, the distribution isn’t the standard normal distribution that we all learned in school. The distinguishing feature is that the tails are fatter, i.e. there is a higher probability of extreme events than assumed by the normal distribution model.

That’s why we seem to seem to see the proverbial “100 year flood” every few years, such as the Lehman Crisis, 9/11, Argentina Crisis, Russia Crisis, etc.

How fat are the tails of the return distributions? One way of determining the amount of fatness is kurtosis measure. Wikipedia explains that “a high kurtosis distribution has a sharper peak and longer, fatter tails, while a low kurtosis distribution has a more rounded peak and shorter thinner tails.” In other words, a kurtosis measure of zero indicates that returns are normally distributed, a negative kurtosis has thin tails while a positive kurtosis has fat tails.

Hedge funds pay a lot of attention to kurtosis, largely because of the leverage in their trading books. When I worked at a hedge fund, the risk manager explained to me that a kurtosis measure of 2-3 is somewhat acceptable, but if the kurtosis of a strategy were to balloon beyond 4 or so, they would get nervous because the possibility of extreme loss would be unacceptably high.

Capital market returns are incredibly fat-tailed
The chart below shows the kurtosis of the various asset classes over the last 10 years. The US bond market was proxied by the total returns of the iShares Barclays Aggregate Bond Fund (AGG) and the Canadian bond market was proxied by the total returns of iShares CDN Bond Index Fund (XBB).


Kurtosis was incredibly high across all asset classes. US bonds, as measured by AGG, showed an astonishing level of kurtosis at 69.0. Canadian bonds, which were less affected by the Lehman Crisis, were still relatively high at 5.1. As a point of reference, I looked at the 10-year trailing kurtosis of the S&P 500 before the Lehman Crisis and it came in at 2.1.

Recall my previous comment that my hedge fund risk manager said that a kurtosis of 2-3 was ok, but beyond 4 they would get nervous.

So is the risk of extreme events so high that we should all be nervous?


A series of Minsky moments?
For some historical context, the chart below shows the rolling 10 year kurtosis of daily returns for the Dow Jones Industrials Average back to 1928 (so this analysis includes the Crash of 1929). It appears that these fat tailed episodes, or high kurtosis, aren’t unusual at all. In fact, the Lehman Crisis was just a blip compared to the Crash of 1987. Periods of stability are followed by periods of instability, or Minsky moments. (John Maudlin also has a good essay on Minsky and the threats from "fingers of instability".)


Back to the 1970s?
The chart below shows that that the level of macro-economic volatility is rising. I shudder whenever someone says “this time it’s different.” Well, this time isn’t different, you just have to look back far enough in history. We experienced similar levels of macro-economic volatility back in the 60’s and 70’s. Unfortunately, most investment professionals weren’t in the business back then and may not be mentally equipped to deal with the new environment.


Living in Extremistan
Nicholas Nassim Taleb, the author of The Black Swan, coined the term Extremistan, a state where one's wealth can change massively in a very short time. Under those kinds of circumstances, investors should have the necessary tools to deal with this new environment.

Thursday, March 25, 2010

Just when you thought it was safe to go back in the water...

With the Dubai news and the Greek/Eurozone crisis seemingly winding down, investors might have thought that it was time to take on risk again. Then this story from the WSJ came across my desk:


Just when you thought it was safe to go back into the water...

Thursday, November 26, 2009

Could Dubai be the spark for a correction?

In my last post I indicated that the US Dollar was poised to rally because of excessive bearish sentiment. Many market analysts had opined that the stage was set for a USD rally but any USD reversal needed a spark such as a geopolitical event.

We may have seen that spark. The world awoke this morning to the surprise news of the potential default by Dubai World.


As FT Alphaville puts it [emphasis mine]:

Dubai’s government stunned the debt markets on Wednesday by asking for a 6-month standstill on the debts of its flagship holding company Dubai World.

The shock move came just hours after the Government of Dubai raised $5bn via a bond issue, the proceeds of which traders had rather naively assumed would be used to pay back a loan issued by Nakheel, Dubai World’s property arm.

This may seem like a stupid and naïve question, but how can someone ask for a debt standstill just hours after raising a bond issue without some disclosure in the prospectus document?

Overnight the markets have moved from euphoria over the prospect of a V-shaped recovery to the despair over a potential sovereign default. Get ready for Extremistan.

Monday, September 21, 2009

A possible market crash - but not yet

Regular readers know that I have been skeptical of this equity market rally (see examples here and here). My opinion is confirmed by many commentators that I respect.
Jeremy Grantham of GMO wrote in his 2Q letter that their estimate of fair value on the S&P 500 is slightly south of 880 and the index could move to between 1000 and 1100. In addition, reports of high levels of insider selling is not comforting for the bulls.

On September 9, long time chartist Richard Russell indicated that he saw a rare “double non-confirmation”[emphasis mine]:

We may have seen a rare "double non-confirmation." On August 27 the Dow closed at 9580.63, a new Dow high for the rally. On the same day the Transports closed at 3714.63, which was not a new high -- in so doing, the Transports failed to confirm the Dow. Today the Transports closed at 3806.75, a new high for the ]Transports. But today the Dow closed at 9547.22, below their August 27 close -- in doing so, the Industrials failed to confirm the Transports. This is what I call a rare "double non-confirmation". First, the Transports were weak in that they could not confirm the Industrials. Today the Industrials were weak in that they could not confirm the Transports. These rare "double non-confirmations," in the past, have tended to signal the top.

Bespoke also pointed out that the S&P 500 is now 20% above its 200-day moving average, the first time this has happened since 1983. This suggests that the market is very overbought and due for a pullback.

Art Cashin recently piped in and said this market reminded him of 1987:

There’s just some eerie things about this—it’s reminiscent of spring and summer of ‘87 when nobody believed the rally and it kept going up despite skepticism, people shorting into it. It ate them alive until it suddenly turned.


Could the market crash?
Are we in for a repeat of the Crash of 1987?

Possibly. I have heard anecdotally that hedge fund leverage is now back to pre-Lehman levels, indicating a high level of systemic risk. William Pasek at Bloomberg wrote the that the US Dollar is now the preferred source of funding for the carry trade, which puts risk levels in context [emphasis mine]:

Now imagine what might happen if the world’s reserve currency became its most shorted. Carry trades are, after all, bets that the funding currency will weaken further or stay down for an extended period of time. It’s also a wager that a central bank is trapped into keeping borrowing costs low indefinitely…

Three-month London interbank offered rates, or Libor, for dollar loans are at a record low and fell below those for the yen on Aug. 24 for the first time in 16 years.

Think about the turbulence that would be unleashed by the dollar suddenly shooting 5 percent or 10 percent higher with untold numbers of traders around the globe on the losing side of that trade. It could make the “Lehman shock” look manageable.


Watching the bearish tripwires
Remember that in 1987, the stock market didn’t just spontaneously decide to crash in a single day. Before the October crash, the market had topped in August and was steadily declining before it took the ultimate plunge.

Today we have the combination over-valuation and high risk behavior, but these things have a way of not mattering to the market until they matter. I respect Barry Ritholz’s comment that the current rally could very well be in the 6th or 7th inning.

The key to timing any potential downdraft is to watch the bearish tripwires.


Sentiment tripwires
Here is what I am watching for.

One is investor sentiment. James Grant, who could usually be counted on to be not just bearish, but apocalyptic, has become a bull. Despite this sign of bearish capitulation, the chart below of public sentiment, as measured by the AAII survey, is not excessively bullish.


Watching the risk trade
As I pointed out in my previous post Risk on, the risk appetites are still rising. For the bear to truly come out of hibernation, investors have to show signs that their taste for risk is becoming sated. The chart below of the euro/yen cross, a measure of the risk trade, is still trending upwards.

Euro/Japanese Yen


If the USD is now the preferred currency of choice for the carry trade, then let’s look at some emerging market currencies against the greenback. The chart below of the Hungarian Forint against the Dollar remains in a healthy uptrend.


Hungarian Forint/U.S. Dollar


The Turkish Lira is also in an uptrend against the Dollar.

Turkish Lira/U.S. Dollar


Commodity prices, which is an indication of the progress of the reflation trade and risk trade, are also in an uptrend.

Until these bearish tripwires are crossed, the path of least resistance for equities is still up. My inner trader tells me it’s too early to get outright bearish. The 50% Fibonacci retracement level for the S&P 500 is roughly 1120 - and under the circumstances that may be a realistic short-term target.

On the other hand, the trigger for the 1987 decline was the Fed's August decision to raise interest rates. While I have expressed my doubts about the willingness or the ability of the Federal Reserve to effectively implement its exit stratgies, the FOMC statement on Wednesday bears watching.