Showing posts with label Fiscal policy. Show all posts

Saturday, January 10, 2026

Regime Change Adventures: Bush, Obama, and now Trump

Emerging market shocks follow a familiar pattern in quantitative investing. When the event occurs, quantitative factor responses in stock selection get thrown out the window. As the smoke clears, top-down strategists map out the direction and magnitude of the shock, and technical analysis factors like price momentum and reversals start to work. As the magnitude of the shock becomes known, company analysts revise their earnings estimates, and estimate revision and earnings surprise factors begin to work. Finally, as the investment environment stabilizes, conventional value and growth factors gain traction.
 
The same thing is happening when U.S. forces seized Venezuelan President Maduro and his wife in a weekend raid. The smoke is starting to clear, both metaphorically and literally, and invest0ors can see the direction of the shock.
 
The raid made some sense from a Trumpian geopolitical viewpoint. Bloomberg opinion columnist Javier Blas characterized the move as Trump building his own Oil Empire. The Donroe Doctrine countries in the Western hemisphere, the U.S., Canada, Venezuela and the rest of the Americas, control roughly 40% of global oil production and this allows the White House much greater control over oil prices and production to avoid energy shocks in the future.

It all sounds good in theory. But as the recent history during the 21st Century shows, this is the third time the U.S. has attempted regime change in oil-producing countries. Bush tried it in Iraq, Obama tried it in Libya and now Trump is trying it in Venezuela. None worked out according to their pre-war textbooks. Here’s what this latest geopolitical adventure means for investors.

The full post can be found here.

Saturday, January 3, 2026

Opportunities and Challenges of 2026

The accompanying chart from Jeffrey Hirsch of Almanac Trader shows the expected seasonal price pattern for the S&P 500. As with any seasonality analysis, direction is more important than the magnitude of the move. If history is any guide, expect a volatile year until October, followed by a rally into year-end.
I agree with the broad strokes of the seasonality analysis, and the pattern forms the base case of my S&P 500 market expectations for 2026.

But I still have questions for the market, and here are the opportunities and challenges for investors in the new year.

The full post can be found here.

Saturday, December 20, 2025

The Market Cycle Puzzle

Preface: Explaining our market timing models 
We maintain several market timing models, each with differing time horizons. The "Ultimate Market Timing Model" is a long-term market timing model based on the research outlined in our post, Building the ultimate market timing model. This model tends to generate only a handful of signals each decade.

The Trend Asset Allocation Model is an asset allocation model that applies trend-following principles based on the inputs of global stock and commodity prices. This model has a shorter time horizon and tends to turn over about 4-6 times a year. The performance and full details of a model portfolio based on the out-of-sample signals of the Trend Model can be found here.

  
My inner trader uses a trading model, which is a blend of price momentum (is the Trend Model becoming more bullish, or bearish?) and overbought/oversold extremes (don't buy if the trend is overbought, and vice versa). Subscribers receive real-time alerts of model changes, and a hypothetical trading record of the email alerts is updated weekly here. The hypothetical trading record of the trading model of the real-time alerts that began in March 2016 is shown below. 

 
The latest signals of each model are as follows:
  • Ultimate market timing model: Buy equities (Last changed from “sell” on 28-Jul-2023)*
  • Trend Model signal: Bullish (Last changed from “bearish” on 27-Jun-2025)*
  • Trading model: Neutral (Last changed from “bullish” on 26-Nov-2025)*
* The performance chart and model readings have been delayed by a week out of respect to our paying subscribers.

Update schedule: I generally update model readings on my site on weekends. I am also on X/Twitter at @humblestudent and on BlueSky at @humblestudent.bsky.social. Subscribers receive real-time alerts of trading model changes, and a hypothetical trading record of those email alerts is shown here.

Subscribers can access the latest signal in real time here.
 

Divergent Market Cycles 

Two weekI highlighted the relative breakouts of gold prices compared to the S&P 500 and the 60/40 portfolio and argued that the breakouts represented a transition of paper to hard asset leadership. However, the last time the gold/paper asset cycle turned, it coincided with a bottoming in other market leadership factors, namely value/growth, small cap/large cap and international/U.S. stocks. This time, the turn in factor leadership isn’t evident. 
 

What are the investment implications of the continuing divergence? Changes in market leadership often occur when a market transitions from bull to bear. Does this mean that the bull is still alive and how should investors position their portfolio allocation?

The full post can be found here.

Saturday, August 30, 2025

Still on the Road to Financial Repression

The Fed’s annual Jackson Hole symposium is intended for participants to discuss the challenges they face and the long-term implications of different ways of thinking about monetary policy. Much like the ASSA conference held every January or the annual ECB conference in Sintra, it’s full of academics giving papers with Greek letters lying on their sides, except that the presenters at Jackson Hole tend to be top-notch academics presenting to the world’s leading central bankers.

Almost every year, at least one paper creates a buzz among attendees. This year, that paper was entitled, “The Race Between Asset Supply and Asset Demand” by Auclert, Malmberg, Rognlie, and Straub (AMRS). The paper modeled the supply and demand for U.S. Treasury debt, and came to the startling conclusion that “debt could reach 250% of GDP without pushing up interest rates”. 

Coincidentally, the nonpartisan Committee for a Responsible Federal Budget published its August forecast incorporating the effects of the OBBB Act and the latest Trump tariffs. The latest projection sees the debt held by the public rise from about 100% of GDP in 2025 to 120% by 2035, an increase of 2% from the Congressional Budget Office’s forecast. An alternative scenario where much of the Trump tariffs are made illegal by the courts would see debt to GDP soar to 134% in 2035.

I had suggested about a month ago that fiscal dominance and financial repression is almost inevitable: The Fed will be faced with a regime characterized by high fiscal deficits and growing pressure for the Fed to help finance. The Fed will follow the path of the BoJ of cutting short rates, restarting quantitative easing and yield curve control to suppress long rates (see Will the Next Fed Chair Matter Much to Policy?). The AMRS paper raises questions about the level of flexibility available to monetary authorities in the coming years.

The full post can be found here.


Special announcement: Humble Student of the Markets will cease publication on March 31, 2026. See this announcement for more details and updates.  


Saturday, February 8, 2025

Bessent's challenges in 2025 and beyond

Treasury Secretary Scott Bessent declared in an interview with Fox Business a surprising target. Bessent and the Trump Administration were mainly focused on lowering the 10-year Treasury yield and Trump is not calling the Fed to lower short-term rates. He also reiterated the Trump Administration’s objective of raising energy output and the extension of the TCJA tax cuts.
 
Here is the short-term report card. Since the Fed announced its jumbo half-point rate cut in September, the 2-year Treasury yield, which is a proxy of the market’s expectations for the terminal Fed Funds rate, has risen, and so has the 10-year yield. The 2s/10s yield curve steepened, indicating stronger growth expectations.
 
Since the election, the 2-year yield is roughly flat and the 10-year yield is up marginally. The bond market has shrugged off anxiety over the possible effects of a trade war, when President Trump announced a 25% tariff on Canada and Mexico, which was later walked back, and a 10% tariff on China. More importantly, the U.S. eliminated a de minimis tariff exception on the import of Chinese goods below $800. An entire industry had grown up to exploit this loophole by sending small individual packages to exploit this rule.


So far, so good. The bottom panel of the chart summarizes Scott Bessent’s main challenge in controlling the 10-year yield. The MOVE Index, which is the VIX of the bond market, had fallen since the election and readings are relatively low by historical standards. Bessent’s main task is to calm the bond market and keep anxiety levels low.
 
The full post can be found here.

Saturday, November 23, 2024

Deciphering Trumponomics 2.0

The year is nearly over and the U.S. will see Donald Trump in the White House in 2025. Ryan Detrick’s analysis of historical equity returns found that stocks historically do better in the first two years of a president who was re-elected versus a new president in office. The key question is whether Trump 2.0 represents a re-election or a new term.


I unpack that question by focusing on the economic effects of Trump’s key initiatives, namely the TCJA tax cut extension, tariffs and immigration.

The full post can be found here.


Saturday, October 26, 2024

Revisiting the Trump trade

Preface: Explaining our market timing models 
We maintain several market timing models, each with differing time horizons. The "Ultimate Market Timing Model" is a long-term market timing model based on the research outlined in our post, Building the ultimate market timing model. This model tends to generate only a handful of signals each decade.

The Trend Asset Allocation Model is an asset allocation model that applies trend-following principles based on the inputs of global stock and commodity prices. This model has a shorter time horizon and tends to turn over about 4-6 times a year. The performance and full details of a model portfolio based on the out-of-sample signals of the Trend Model can be found here.


My inner trader uses a trading model, which is a blend of price momentum (is the Trend Model becoming more bullish, or bearish?) and overbought/oversold extremes (don't buy if the trend is overbought, and vice versa). Subscribers receive real-time alerts of model changes, and a hypothetical trading record of the email alerts is updated weekly here. The hypothetical trading record of the trading model of the real-time alerts that began in March 2016 is shown below.


The latest signals of each model are as follows:

  • Ultimate market timing model: Buy equities (Last changed from “sell” on 28-Jul-2023)*
  • Trend Model signal: Bullish (Last changed from “neutral” on 11-Oct-2024)*
  • Trading model: Bullish (Last changed from “neutral” on 15-Oct-2024)*
* The performance chart and model readings have been delayed by a week out of respect to our paying subscribers.

Update schedule: I generally update model readings on my site on weekends. I am also on X/Twitter at @humblestudent. Subscribers receive real-time alerts of trading model changes, and a hypothetical trading record of those email alerts is shown here.

Subscribers can access the latest signal in real time here.
 

The Trump trade

The Trump trade seems to be making a comeback in the markets. While the betting markets have seen Trump's odds of winning rise and Harris' odds fall, it has been marred by suspicions of manipulation (see articles in WSJ and Financial Times). Less difficult to manipulate are the factors in the financial markets, shown in the chart below. Each of these charts is designed so that a rising line denotes rising favourability for a Trump victory.
  • Trump Media & Technology Group: It’s a proxy for Trump enthusiasm as it’s the holding company for Truth Social, Trump’s social media vehicle.
  • Domestic Revenue stock ETF vs. S&P 500: One of Trump’s main platforms is to use tariffs to bring manufacturing back to the U.S.
  • Inflation Expectations: Trump’s tariff policies are expected to be inflationary.
  • Poland vs. Euro STOXX 50: Poland has been a surprise growth engine in the EU, but it neighbours Ukraine, and the relative performance of its market is a measure of Ukrainian anxiety.
  • Gasoline Price: Gasoline can be thought of as an anti-incumbent trade. Rising prices depress consumer sentiment and it’s negative for the incumbent.
Each has its idiosyncrasies, but taken as a whole, the Trump trade seems to be winning.


It’s time to consider the effects of Trump’s economic policies should he win the White House.


A focus on trade policy

The results of the latest BoA Global Fund Manager Survey could be setting the tone for the market’s reaction to the U.S. election. Respondents are most concerned about changes in trade policy as a result of the election.

In that context, it was stunning that Donald Trump, in an interview with Bloomberg editor in chief John Micklethwait, doubled down on his protectionist leanings and characterized “tariff” as “the most beautiful word in the dictionary”.

 
What are the effects of Trump’s economic policies should he win the White House?

The full post can be found here.


Saturday, September 14, 2024

The slow march to fiscal dominance

Mario Draghi is known as the ECB President who said that he would do “whatever it takes” to save the euro. Now, his report on European Union competitiveness is designed to save the EU, and it’s caused quite a stir. Draghi identified the issues of EU competitiveness as poor productivity, caused by fragmentation of industrial policy along national lines, and a lack of co-ordination and focus across policy lines, such as fiscal, trade and foreign policies. 

As a solution, Draghi is calling for a re-focus of industrial policy and a minimum annual investment of “€750 to €800 billion…based on the latest Commission estimates, corresponding to 4.4-4.7% of EU GDP in 2023. For comparison, investment under the Marshall Plan between 1948–51 was equivalent to 1–2% of EU GDP”. The investment would have to be financed mainly by euro area debt.
 
If implemented, the Draghi Plan will put the eurozone on the road to fiscal dominance. Currently, euro area debt averages 88.6% of GDP, which is just short of the 90% guideline specified by Reinhart & Rogoff when a sovereign becomes at risk of significant and prolonged reductions in economic growth. By comparison, the U.S. debt to GDP ratio stands at 121%. However, eurozone countries have arguably less fiscal room as member states can’t print their own currency and must rely on the European Central Bank.


This will cement developed economies’ path to fiscal dominance. Investors will need to prepare accordingly.
 
The full post can be found here.

Saturday, July 20, 2024

Positioning for Trump 2.0

In the wake of Biden’s subpar debate performance and the assassination attempt on Trump, the prediction markets’ odds of a Trump victory in November have substantially risen. Equally important is Wall Street’s reaction, which has investors sitting up to take notice of the implications of a second Trump Administration in 2025.


Despite the real-time information from the betting markets, financial markets haven’t fully discounted the possibility of a Trump win. Here’s how you can take advantage of that arbitrage opportunity.

The full post can be found here.

Saturday, April 20, 2024

Are we in for a 1970's style inflation revival?

When Fed Chair Jerome Powell spoke at a moderated Q&A last Tuesday, he confirmed the higher-for-longer message of virtually all other Fed speakers: “The recent data have clearly not given us greater confidence and instead indicate that it is likely to take longer than expected to achieve that confidence [to reduce rates]”.
 
As a consequence of the shift to a higher-for-longer narrative, different versions of this ominous CPI chart have been making the rounds. Could we be in for a 1970s-style inflation revival?


The full post can be found here.

Saturday, October 7, 2023

What's spooking the bond market, and why it matters to equities

What’s bothering the bond market? The 10-year Treasury yield (blue line) has shot up to levels last seen just before the GFC. The surge in yields has occurred just as investors are seeing better news on inflation. At the same time, core PCE (red line) has been falling. Shouldn’t that be good news for the trajectory of monetary policy? Why are yields rising?


 The full post can be found here.

Saturday, September 9, 2023

Investing during an era of Fiscal Dominance

As the Street parsed Powell’s Jackson Hole speech and obsessed over whether the Fed would raise an additional quarter-point, the annual Fed symposium at Jackson Hole is meant for central bankers to consider Big Ideas which reflect the concerns of the day.
 
The centrepiece of such ideas was usually an academic paper. As an example, the Big Idea in 2020 was “flexible average inflation targeting” and the now quaint problem of persistent low inflation. A paper by University of California at Berkeley academic Yuriy Gorodnichenko argued that the Fed needs clear, simple and transparent communication to create the link between higher inflation expectations and actual spending behaviour.
 
The Big Idea in 2023 is fiscal dominance, or the problem of big government deficits and skyrocketing debt around the world. 

How should investors position themselves in an era of persistent deficits, rising sovereign debt, and fiscal dominance?

The full post can be found here.

Saturday, May 27, 2023

Back to a focus on technicals

 As at the time of writing, the White House and the Republican-led House haven’t come to a debt ceiling deal yet, though both sides are getting closer to a deal. But you only die once, and focusing on the fear of a catastrophe isn’t very useful. Hedging only works if there is someone you can collect from on your hedge, and obsessing over a U.S. default only gets you so far. Instead, I will focus on getting back to the technical structure of the market by assuming that all parties agree to step back from the brink.

From a longer-term perspective, the narrow leadership of the S&P 500 is disturbing. Remember Bob Farrell’s Rule #7: “Markets are strongest when they are broad and weakest when they narrow to a handful of blue-chip names”. As the S&P 500 tests its 50 dma, the equal-weighted S&P 500, the mid-cap S&P 400 and the small-cap Russell 2000 have already violated their 50 dma.


How much does bad breadth matter?

The full post can be found here.

Saturday, January 28, 2023

FOMC preview: Party now, pay later

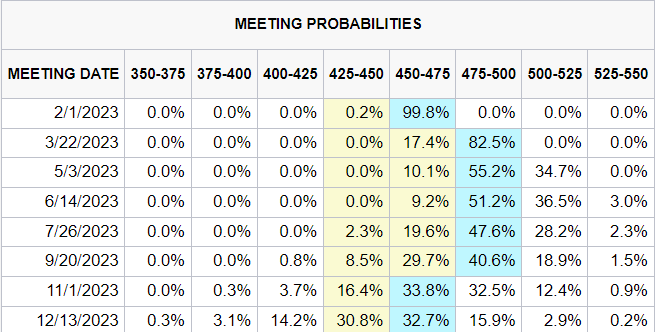
As investors look ahead to the FOMC decision on February 1, the market is expecting two consecutive quarter-point rate hikes, followed by a plateau, and a rate cut in late 2023.


The rate hike path and subsequent pause are consistent with the Fed's communication policy. Already, the Bank of Canada raised rates by a quarter-point last week and signaled a conditional pause in order to assess the lagged effects of past rate hikes. Expectations of falling rates later this year are contrary to the Fed's forward guidance. I am struck by a key sentence from the December FOMC minutes: "No participants anticipated that it would be appropriate to begin reducing the federal funds rate target in 2023,"

While there will be no dot plot published at the conclusion of the February FOMC meeting, the Fed's intentions can't be any clearer. There will be no cuts this year. In that case, what are the circumstances that could alter the Fed Funds trajectory?

The full post can be found here.

Sunday, November 13, 2022

Soft CPI is helpful, but it's still a bear market

Preface: Explaining our market timing models 
We maintain several market timing models, each with differing time horizons. The "Ultimate Market Timing Model" is a long-term market timing model based on the research outlined in our post, Building the ultimate market timing model. This model tends to generate only a handful of signals each decade.

The Trend Asset Allocation Model is an asset allocation model that applies trend-following principles based on the inputs of global stock and commodity prices. This model has a shorter time horizon and tends to turn over about 4-6 times a year. The performance and full details of a model portfolio based on the out-of-sample signals of the Trend Model can be found here.


My inner trader uses a trading model, which is a blend of price momentum (is the Trend Model becoming more bullish, or bearish?) and overbought/oversold extremes (don't buy if the trend is overbought, and vice versa). Subscribers receive real-time alerts of model changes, and a hypothetical trading record of the email alerts is updated weekly here. The hypothetical trading record of the trading model of the real-time alerts that began in March 2016 is shown below.


The latest signals of each model are as follows:
  • Ultimate market timing model: Sell equities*
  • Trend Model signal: Neutral*
  • Trading model: Neutral*
* The performance chart and model readings have been delayed by a week out of respect to our paying subscribers.

Update schedule: I generally update model readings on my site on weekends and tweet mid-week observations at @humblestudent. Subscribers receive real-time alerts of trading model changes, and a hypothetical trading record of those email alerts is shown here.

Subscribers can access the latest signal in real time here.


Curb your enthusiasm
Does the soft October CPI report mark the start of a fresh bull? Not so fast!

To be sure, the report was positive in many ways. Most of the strength in core CPI was in services and Owners' Equivalent Rent (OER) in particular. Rents are a lagging component of CPI and it has been weakening. Eventually, it will show up in actual CPI metrics. In the meantime, monthly core CPI ex-OER continues to show a trend of deceleration.


Mark Hulbert advised investors to curb their enthusiasm. He pointed out that the stock market's outsized one-day return in response to the softer than expected CPI report is an indication that the bear market is still alive and well.
Despite Thursday’s explosive rally in stocks, it’s likely we’re still mired in a bear market.

In fact, the magnitude of the surge itself suggests the bear is still alive and well.

Consider all trading days since the Nasdaq Composite Index was created in 1971 in which it gained — as it did Thursday — more than 6%. Twenty of 26 of those days prior to Thursday occurred during a bear market, or 77% of the time, according to Ned Davis Research.
The full post can be found here.

Saturday, February 26, 2022

Wars are equity bullish, but there's a catch...

Four weeks ago, I suggested that investors buy to the sound of cannons. Now that the cannons have sounded, is that still a good idea?

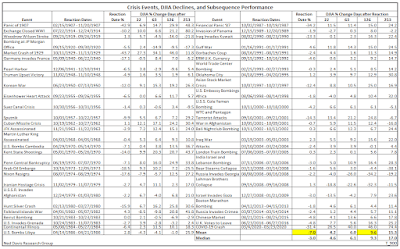
Yes, but there's a catch. A detailed list of past crises from Ed Clissold of Ned Davis Research reveals that stock prices usually rebound strongly after sudden shocks such as war. On average, the DJIA is up 4.2% after a month and 15.3% a year later.


Here's the catch...

The full post can be found here.

Sunday, October 17, 2021

Market liftoff?

Preface: Explaining our market timing models 
We maintain several market timing models, each with differing time horizons. The "Ultimate Market Timing Model" is a long-term market timing model based on the research outlined in our post, Building the ultimate market timing model. This model tends to generate only a handful of signals each decade.

The Trend Asset Allocation Model is an asset allocation model that applies trend following principles based on the inputs of global stock and commodity price. This model has a shorter time horizon and tends to turn over about 4-6 times a year. The performance and full details of a model portfolio based on the out-of-sample signals of the Trend Model can be found here.


My inner trader uses a trading model, which is a blend of price momentum (is the Trend Model becoming more bullish, or bearish?) and overbought/oversold extremes (don't buy if the trend is overbought, and vice versa). Subscribers receive real-time alerts of model changes, and a hypothetical trading record of the email alerts is updated weekly here. The hypothetical trading record of the trading model of the real-time alerts that began in March 2016 is shown below.


The latest signals of each model are as follows:
  • Ultimate market timing model: Buy equities*
  • Trend Model signal: Bullish*
  • Trading model: Bullish*
* The performance chart and model readings have been delayed by a week out of respect to our paying subscribers.

Update schedule: I generally update model readings on my site on weekends and tweet mid-week observations at @humblestudent. Subscribers receive real-time alerts of trading model changes, and a hypothetical trading record of those email alerts is shown here.

Subscribers can access the latest signal in real-time here.


To boldly go?
Last week, I characterized the stock market as like a rocket on a launch pad. Last week's events also featured William Shatner, the actor who played Captain Kirk in the original Star Trek series, being blasted into space. Now that Captain Kirk has gone into space, will equities follow?

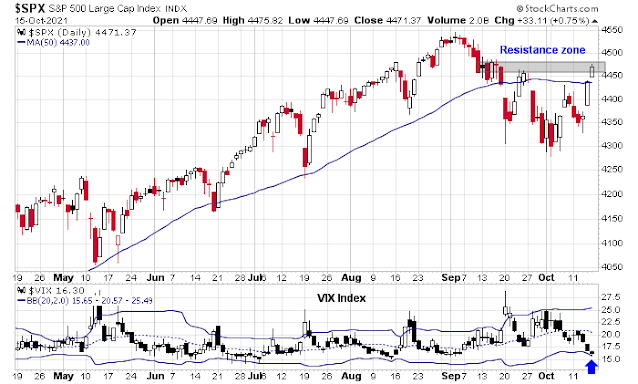
Let's take a look. One of the bullish tripwires I outlined was for the S&P 500 to decisively regain its 50 dma. The index convincingly breached the 50 dma and it is now testing a resistance zone, which is positive.


However, traders are cautioned to monitor the VIX Index. In the past, VIX breaches of the lower Bollinger Band have been overbought signals when market rallies have temporarily stalled in the past.

The full post can be found here.

Sunday, October 3, 2021

A Q4 meltup ahead?

Preface: Explaining our market timing models 
We maintain several market timing models, each with differing time horizons. The "Ultimate Market Timing Model" is a long-term market timing model based on the research outlined in our post, Building the ultimate market timing model. This model tends to generate only a handful of signals each decade.

The Trend Asset Allocation Model is an asset allocation model that applies trend following principles based on the inputs of global stock and commodity price. This model has a shorter time horizon and tends to turn over about 4-6 times a year. The performance and full details of a model portfolio based on the out-of-sample signals of the Trend Model can be found here.


My inner trader uses a trading model, which is a blend of price momentum (is the Trend Model becoming more bullish, or bearish?) and overbought/oversold extremes (don't buy if the trend is overbought, and vice versa). Subscribers receive real-time alerts of model changes, and a hypothetical trading record of the email alerts is updated weekly here. The hypothetical trading record of the trading model of the real-time alerts that began in March 2016 is shown below.


The latest signals of each model are as follows:
  • Ultimate market timing model: Buy equities*
  • Trend Model signal: Bullish*
  • Trading model: Bullish*
* The performance chart and model readings have been delayed by a week out of respect to our paying subscribers.

Update schedule: I generally update model readings on my site on weekends and tweet mid-week observations at @humblestudent. Subscribers receive real-time alerts of trading model changes, and a hypothetical trading record of those email alerts is shown here.

Subscribers can access the latest signal in real-time here.


Positive seasonality ahead
If history is any guide, stocks are expected to be bottom out in early October and begin a period of seasonal strength into year-end.


What are the odds of a melt-up for the rest of 2021?

The full post can be found here.
Saturday, September 25, 2021

Time for a mid-cycle swoon?

The S&P 500 fell as much -4% from its all-time high in Evergrande panic pullback last week. Is the recent weakness just typical seasonal weakness or something more serious? The intermediate-term breadth looks disconcerting. The percentage of S&P 500 stocks above their 200-day moving average (dma) had been at the 90% level which indicates a "good overbought" sustained advance. This indicator has retreated below the 75% level. There have been four similar episodes in the last 20 years. Three of the four occasions resolved themselves with substantial drawdowns while the remaining one saw the market trade sideways in a choppy way.


The odds don't look good. The market may be setting itself for a mid-cycle swoon.

The full post can be found here.

Saturday, September 11, 2021

A time for caution, or contrarian buy signal?

Recently, a number of major investment banks have published warnings for the US stock market. The strategists at BoA, Citigroup, Credit Suisse, Deutsche, Goldman Sachs, and Morgan Stanley have issued either bearish or cautionary outlooks. 

On the other hand, Ryan Detrick at LPL Financial documented the effects of strong price momentum on stock prices. 
History says that great starts to a year tend to see continued strength the final four months. “Looking at the previous top 10 starts to a year ever, the final four months have gained eight times,” explained LPL Financial Chief Market Strategist Ryan Detrick. “So should we see any seasonal weakness, we’d use it as an opportunity to buy before likely continued strength.”


In these circumstances, I am reminded of Bob Farrell's Rule 9, "When all the experts and forecasts agree – something else is going to happen." How should investors react? Turn cautious, or is this a contrarian opportunity to buy the dip?

The full post can be found here.