Showing posts with label Value investing. Show all posts

Saturday, August 9, 2025

Another View of American Exceptionalism

Last week, I outlined the case for fiscal dominance (see Will the Next Fed Chair Matter Much to Policy?). U.S. debt to GDP is rising and not stabilizing. In all likelihood, the Fed will follow the path of the BoJ of cutting short rates, restarting quantitative easing and yield curve control to suppress long rates, which would put upward pressure on inflation and downward pressure on the USD. For investors, the best hedge for inflation-adjusted returns will be equities — global equities.

One U.S. based reader asked for greater guidance to regional equity allocation. I replied that, that, when considering long-term investment policy, a passive allocation to global equities would be appropriate as it’s difficult to forecast the long-term outlook for different regional economies in the future.

I would now add that, as an active strategy, investors adopt a barbell allocation in the equity portion of their portfolio to U.S. large-cap growth and non-U.S. value stocks. The top panel of the accompanying chart shows that the U.S. and non-U.S. value and growth cycle tracked each other closely until early 2023 when they bifurcated. Growth outperformed in the U.S., while value began a steady multi-year uptrend. 
 
My active strategy is based on the principle that “the trend is your friend”.
 
The bottom panel shows the relative performance of the two barbell portions of the allocation. U.S. growth is leading the MSCI All-Country World Index (ACWI) benchmark, mainly because U.S. equities have been on a tear against global equities since the GFC. Outside the U.S., EAFE value stocks have been flat against ACWI since mid-2020. 
 
The bifurcate of growth and value relationship is additional evidence of American Exceptionalism in equity performance, which is mainly based on the promise of gains from artificial intelligence. For investors, the key question is how long AI will dominate American equity returns.

 
The full post can be found here.
 

Special announcement: Humble Student of the Markets will cease publication on March 31, 2026. See this announcement for more details and updates.   


Saturday, August 31, 2024

LBO insights: Why these deep value stocks have become even cheaper

Mark Hulbert recently published an ominous warning at MarketWatch about excessive valuation in the U.S. equity market. Most valuation ratios are in the top 90% since 2000 and “as overvalued as it was at the market top on Jan. 3, 2022”.


How worried should you be?
 
The full post can be found here.

Saturday, May 4, 2024

Value or growth? Here's an analytical framework for decision making

Should you be a value or growth investor?

The accompanying chart shows the historical record. In the last 20 years, growth has handily beaten value. The U.S. value/growth track record closely tracked the international developed value/growth record until 2023, when AI-related plays in the U.S. went on a tear. Such stocks weren’t readily available in non-U.S. markets.

Does that mean you should continue to bet on growth investing or are value stocks about to have their day? Here an analytical framework to think about the value/growth paradigm.
 
The full post can be found here.

Friday, March 15, 2024

A reply to Grantham's AI warning

Well-known value investor Jeremy Grantham recently penned an essay titled, “The Great Paradox of the U.S. Market”, in which he warned, “Prices reflect near perfection yet today’s world is particularly imperfect and dangerous”.

In particular, he sounded the alarm over the bubble in AI stocks and cited the Gartner Hype Cycle as the main reason for caution:
 
But every technological revolution like this – going back from the internet to telephones, railroads, or canals – has been accompanied by early massive hype and a stock market bubble as investors focus on the ultimate possibilities of the technology, pricing most of the very long-term potential immediately into current market prices. And many such revolutions are in the end often as transformative as those early investors could see and sometimes even more so – but only after a substantial period of disappointment during which the initial bubble bursts. Thus, as the most remarkable example of the tech bubble, Amazon led the speculative market, rising 21 times from the beginning of 1998 to its 1999 peak, only to decline by an almost inconceivable 92% from 2000 to 2002, before inheriting half the retail world!


As much as I respect Grantham’s investment insights, he suffers from the value investor problem of being too early and overly reliant on valuation for his views. I reiterate my view that it’s still early in the bull cycle for AI stocks (see The Path to Magnificent Exuberance). Here’s why.
 
The full post can be found here.

Saturday, March 2, 2024

Are you ready to be a contrarian cigar butt investor?

How would you feel about a star value manager with the track record shown in the chart below. While he beat the market in the wake of the dot-com bubble, he has only matched the performance of the S&P 500 since 2011. To be sure, he did beat his style benchmark (second panel).
 
The star manager is none other than the legendary Warren Buffett and the chart shows the relative performance of Berkshire Hathaway’s stock price relative to the S&P 500 and the Russell 1000 Value Index. Buffett’s best known recent win was his purchase of Apple in 2016 which became his largest holding, and whose relative returns are shown in the bottom panel.

 
I examine how he achieved his results, and offer studies of sources of alpha as examples of different investing styles.

The full post can be found here.

Saturday, November 20, 2021

What's wrong with value stocks?

What's wrong with value stocks? The accompanying chart shows the relative performance of the Russell 1000 Value to Russell 1000 Growth Index ratio (bottom panel, solid line) and the closely correlated S&P 600 to NASDAQ 100 (bottom panel, dotted line). When the dot-com mania peaked in 2000, value stocks initially rocketed upward relative to growth stocks. The relative ascent began to moderate in 2001 but continued for several years.

Fast forward to 2020. The growth style had been dominant for 5-7 years and value/growth relative performance had become extremely stretched. Value recovered in 2020 but fell back in 2021. 


History doesn't repeat, but is it even rhyming this time? What's wrong with the value style? 

The full post can be found here.

Saturday, August 21, 2021

The market risk hiding in plain sight

As the infrastructure and budget bills make their way through Congress, I was surprised to see that the latest BoA Global Fund Manager Survey did not mention a corporate tax increase as a key risk to the S&P 500. 

The full post can be found here.

Sunday, August 15, 2021

Prepare for a growth stock correction

Preface: Explaining our market timing models 
We maintain several market timing models, each with differing time horizons. The "Ultimate Market Timing Model" is a long-term market timing model based on the research outlined in our post, Building the ultimate market timing model. This model tends to generate only a handful of signals each decade.

The Trend Asset Allocation Model is an asset allocation model that applies trend following principles based on the inputs of global stock and commodity price. This model has a shorter time horizon and tends to turn over about 4-6 times a year. The performance and full details of a model portfolio based on the out-of-sample signals of the Trend Model can be found here.


My inner trader uses a trading model, which is a blend of price momentum (is the Trend Model becoming more bullish, or bearish?) and overbought/oversold extremes (don't buy if the trend is overbought, and vice versa). Subscribers receive real-time alerts of model changes, and a hypothetical trading record of the email alerts is updated weekly here. The hypothetical trading record of the trading model of the real-time alerts that began in March 2016 is shown below.


The latest signals of each model are as follows:
  • Ultimate market timing model: Buy equities*
  • Trend Model signal: Bullish*
  • Trading model: Neutral*
* The performance chart and model readings have been delayed by a week out of respect to our paying subscribers.

Update schedule: I generally update model readings on my site on weekends and tweet mid-week observations at @humblestudent. Subscribers receive real-time alerts of trading model changes, and a hypothetical trading record of those email alerts is shown here.

Subscribers can access the latest signal in real-time here.


Growth leadership faltering
Changes in macro conditions are setting up for a growth stock correction. The strength in the 10-year Treasury yield is putting downward pressure on growth stock leadership. The growth style is a duration play because it is more sensitive to changes in interest rates than value. 


In addition, I made the case yesterday for a value style revival which is negative for the growth stock leadership (see Constructive value and reflation green shoots). 

The full post can be found here.

Saturday, July 10, 2021

Seven reasons to fade the growth scare

It is astonishing to see the market narrative shift in the space of only a few months from "inflation is coming" to a growth scare. In late March, the 10-year Treasury yield topped at over 1.7% and the 2s10s yield curve was steepening. Today, the 10-year has decisively broken support and the yield curve is flattening, indicating fears of slowing economic growth.


In late May, I forecasted bond market price strength and called for a counter-trend rally in growth stocks (see What a bond market rally could mean for your investments) but the latest move in both yields and growth appear exhaustive. As evidence of the change in psychology, Bloomberg reported that put option premiums over calls on the 10-Year Treasury Note have vanished. Traders are now paying more for call options than put options.


Here are seven reasons why investors should fade the growth scare.

The full post can be found here.

Saturday, July 3, 2021

How to navigate the mid-cycle expansion

It's been over a year since the stock market bottom at the height of the Pandemic Panic. The market consensus has evolved from an early cycle recovery to a mid-cycle expansion, as evidenced by the BoA Global Fund Manager Survey.


What that means for investors? Here are the key questions we focus on:
  • What's the outlook for the S&P 500?
  • What will be the market leadership?
  • What's the outlook for commodities, Treasury yields, and the USD?
The full post can be found here.

Saturday, June 12, 2021

The bond market tempts FAIT

Remember when I called for a bond market rally (see What a bond market rally could mean for your investments). The 10-year Treasury yield broke support last week and shrugged off a hot CPI print. Is the bond market tempting FAIT, or the Fed's Flexible Average Inflation Targeting framework?


Here are some of the broad market implications.

The full post can be found here.

Saturday, May 29, 2021

What a bond market rally could mean for your investments

The trader Alex Barrow recently observed that the sentiment backdrop is setting up for a bond market rally.


While Barron's is not as reliable as The Economist as a contrarian magazine cover indicator, the stars appear to be lining up for a counter-trend rally in bond prices. Here is what a potential bond market means for the other major asset classes.

The full post can be found here.

Saturday, April 24, 2021

A pause in the reflation trade?

Recently, a growing narrative in the market is arguing for a pause in the reflation trade for the following reasons:
  • Both the cyclically sensitive copper/gold and base metal/gold ratios have moved sideways.
  • The 10-year Treasury yield peaked out in March and it is now falling, which is an indication of the bond market's belief of a retreat in growth expectations.
  • The Chinese stock market has tanked relative to global stocks, as measured by MSCI All-Country World Index (ACWI).


If these market signals are indeed pointing to a pause in growth expectations, then investors should be prepared for either a risk-off tone in the markets or some choppiness and consolidation in the months ahead.

The full post can be found here.

Saturday, March 27, 2021

Has the reflation trade become too crowded?

In light of last week's partial NASDAQ reversal, I had a number of discussions with readers about whether the reflation trade has become overly consensus and crowded. To be sure, bond prices have become wildly oversold while the cyclically sensitive copper/gold ratio has surged upward and appears extended.


Is the reflation trade, which is another shorthand for cyclical and value stocks, due for a reversal?

The full post can be found here.

Wednesday, March 17, 2021

There are no more bulls and bears, here's why

Mid-week market update: If you hadn't known that it was FOMC day, you would have looked at the closing market diary and shrugged. The S&P 500 closed only +0.3% on the day. Beneath the surface, however, a lot has been going on in the past few weeks.

Analysts who try to call the direction of the US equity market are facing an especially difficult time as they are encountering a bewildering array of both bullish and bearish sentiment readings. That's because the stock market has bifurcated into a growth stock market and a value stock market. There is no more single stock market anymore.

This chart of the Russell 1000 Value to Russell 1000 Growth ratio tells the story. After value stocks opened a "Vaccine Monday" runaway gap last November, value stocks have made their way higher against growth stocks. The ratio became extended and exhibited a negative 5-day RSI divergence in early January. Both value and growth stocks proceeded to pull back, with value the underperformer. The ratio exhibited another negative RSI divergence in early March. This time, growth stocks rallied with a vengeance while value stocks were mostly flat. The Russell 1000 Growth Index skidded but recovered and its advance is currently testing technical resistance defined by the 61.8% Fibonacci retracement level.


This account of internal rotation underscores my point that this is a tale of two markets. Indeed, it was the best of times and the worst of time for growth and value. There are no more bulls and bears. You can be a value bull and growth bear, or a growth bull and value bear.

The full post can be found here.

Sunday, March 14, 2021

Here comes the recovery

Preface: Explaining our market timing models

We maintain several market timing models, each with differing time horizons. The "Ultimate Market Timing Model" is a long-term market timing model based on the research outlined in our post, Building the ultimate market timing model. This model tends to generate only a handful of signals each decade.


The Trend Asset Allocation Model is an asset allocation model that applies trend following principles based on the inputs of global stock and commodity price. This model has a shorter time horizon and tends to turn over about 4-6 times a year. In essence, it seeks to answer the question, "Is the trend in the global economy expansion (bullish) or contraction (bearish)?"

My inner trader uses a trading model, which is a blend of price momentum (is the Trend Model becoming more bullish, or bearish?) and overbought/oversold extremes (don't buy if the trend is overbought, and vice versa). Subscribers receive real-time alerts of model changes, and a hypothetical trading record of the email alerts are updated weekly here. The hypothetical trading record of the trading model of the real-time alerts that began in March 2016 is shown below.


The latest signals of each model are as follows:
  • Ultimate market timing model: Buy equities*
  • Trend Model signal: Bullish*
  • Trading model: Bullish*
* The performance chart and model readings have been delayed by a week out of respect to our paying subscribers.

Update schedule: I generally update model readings on my site on weekends and tweet mid-week observations at @humblestudent. Subscribers receive real-time alerts of trading model changes, and a hypothetical trading record of those email alerts is shown here.

Subscribers can access the latest signal in real-time here.


From shutdown to re-opening
About a year ago, the World Health Organization declared the coronavirus a pandemic. Governments around the world shut down their economies and the global economy crashed into a recession. Fast forward a year, fiscal and monetary authorities have responded with unprecedented levels of stimulus, vaccinations are proceeding, caseloads are dropping, and economies are re-opening again.

The Dow Jones Industrials and Transports made new all-time highs last week. That's a Dow Theory buy signal.


Here is how to play the bull market. 

The full post can be found here.

Wednesday, March 10, 2021

Growth's dead cat bounce

Mid-week market update: The rebound in the NASDAQ and growth stocks was not a surprise. Value outperformed growth by the most on record last week - and that includes the dot-com crash that began in 2000. 


Make no mistake. Growth stocks are experiencing an unsustainable dead cat bounce.

The full post can be found here.


Tuesday, March 9, 2021

Tech's kryptonite, revealed

In his latest letter to Berkshire Hathaway shareholders, Warren Buffett reported that even Berkshire's largest publicly listed holding is asset-light Apple, and Berkshire is a very asset-heavy company. Its two major holdings are railroad BNSF and electric utility BNE, which has a large capital project to upgrade the electrical transmission grid in the western US, due to be complete in 2030.
Recently, I learned a fact about our company that I had never suspected: Berkshire owns American-based property, plant and equipment – the sort of assets that make up the “business infrastructure” of our country – with a GAAP valuation exceeding the amount owned by any other U.S. company. Berkshire’s depreciated cost of these domestic “fixed assets” is $154 billion. Next in line on this list is AT&T, with property, plant and equipment of $127 billion.
However, he extolled the virtues of asset-light platform businesses:
Our leadership in fixed-asset ownership, I should add, does not, in itself, signal an investment triumph. The best results occur at companies that require minimal assets to conduct high-margin businesses – and offer goods or services that will expand their sales volume with only minor needs for additional capital. We, in fact, own a few of these exceptional businesses, but they are relatively small and, at best, grow slowly.
In the past decade, investors have bid up the price of technology stocks, which have been the main beneficiaries of the asset-light platform business model. On a relative basis, technology forward P/E ratios are stretched relative to the S&P 500. 


Recent events have revealed the fatal weakness, or kryptonite, of the asset-light platform company's business model.

The full post can be found here.


Saturday, March 6, 2021

Are you positioned for the post-Great Rotation era?

Is the US stock market in a bubble? Yes and no, according to Ray Dalio of Bridgewater Associates. Using a proprietary technique to create a "bubble indicator", Dalio concluded that "the aggregate bubble gauge is around the 77th percentile today", compared to a 100th percentile reading in 1929 and 2000.


Dalio qualified his analysis with some parts of the market are indeed very bubbly, but others are not.
There is a very big divergence in the readings across stocks. Some stocks are, by these measures, in extreme bubbles (particularly emerging technology companies), while some stocks are not in bubbles. 
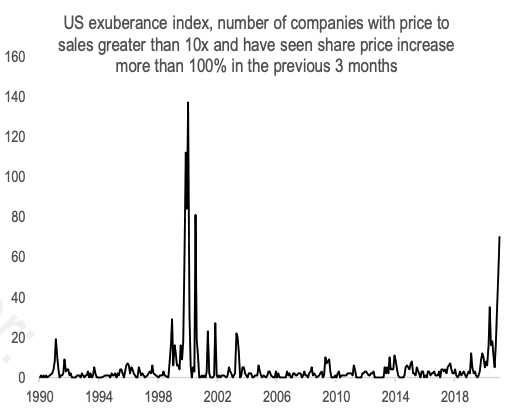
Credit Suisse came to a similar conclusion with their US Exuberance Index. The number of companies with price-to-sales over 10 have surged, but readings are not at the levels seen during the dot-com peak.


At the same time, the market is undergoing a secular shift from growth to value. Here are some important implications for investor portfolios in the next market cycle.

The full post can be found here.

Wednesday, February 24, 2021

MoMo is losing its mojo

Mid-week market update: About a month ago, I warned that the market was undergoing a regime shift from growth to value (see What would Bob Farrell say?) and compared today's Big Tech momentum stocks, not to the dot-com mania, but the Nifty Fifty era. On the weekend, I rhetorically asked in a tweet that if Bloomberg TV has to explain r/WSB lingo to its audience, it's probably a sign that speculative momentum was nearing the end of its run.


It finally happened this week. The MoMo (momentum) crowd is losing its mojo. The price momentum factor, however it's measured, is undergoing a sharp correction.


Here is what that means for the stock market.

The full post can be found here.