Preface: Explaining our market timing models We maintain several market timing models, each with differing time horizons. The "
Ultimate Market Timing Model" is a long-term market timing model based on the research outlined in our post,
Building the ultimate market timing model. This model tends to generate only a handful of signals each decade.
The
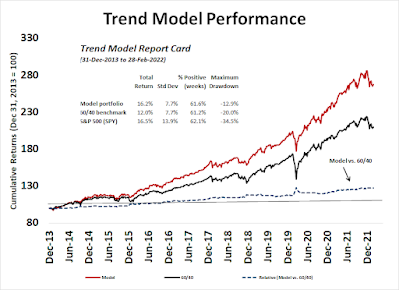
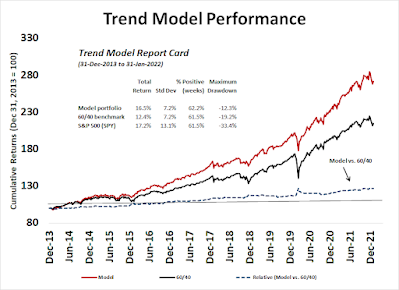
Trend Asset Allocation Model is an asset allocation model that applies trend following principles based on the inputs of global stock and commodity price. This model has a shorter time horizon and tends to turn over about 4-6 times a year. The performance and full details of a model portfolio based on the out-of-sample signals of the Trend Model can bsoe found
here.
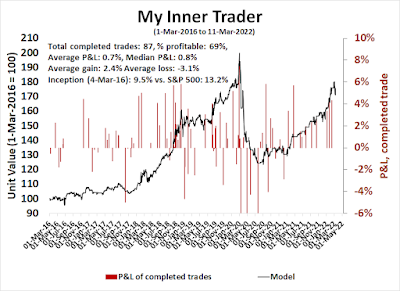
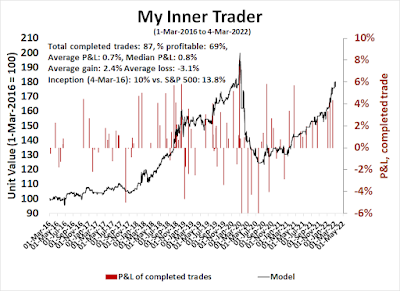
My inner trader uses a
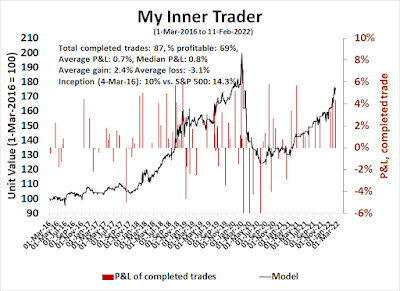
trading model, which is a blend of price momentum (is the Trend Model becoming more bullish, or bearish?) and overbought/oversold extremes (don't buy if the trend is overbought, and vice versa). Subscribers receive real-time alerts of model changes, and a hypothetical trading record of the email alerts is updated weekly
here. The hypothetical trading record of the trading model of the real-time alerts that began in March 2016 is shown below.
The latest signals of each model are as follows:
- Ultimate market timing model: Buy equities*
- Trend Model signal: Neutral*
- Trading model: Bullish*
* The performance chart and model readings have been delayed by a week out of respect to our paying subscribers.Update schedule: I generally update model readings on my
site on weekends and tweet mid-week observations at @humblestudent. Subscribers receive real-time alerts of trading model changes, and a hypothetical trading record of those email alerts is shown
here.
Subscribers can access the latest signal in real-time
here.
Scared enough?
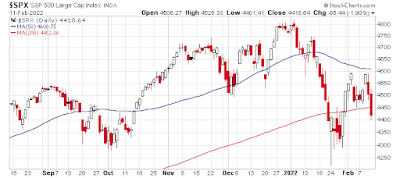
Are you scared enough? The market is extremely jittery. News last week of a Russian attack that started a fire at a Ukrainian power plant sparked a risk-off episode. Further sober analysis revealed that the incident was under control and there was no radiation leak. Worries about the incident sparking a second Chernobyl disaster are overblown.
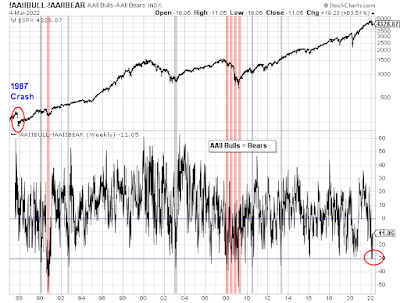
Two weeks ago, the AAII weekly sentiment survey showed the bull-bear spread had fallen to -30, but it rebounded last week to -11. Readings of -30 are rare and they have only been lower during the bear markets of 1990 and 2008 (shown in pink). These levels weren't even seen in the wake of the Crash of 1987. In all cases, they signaled short-term bottoms.
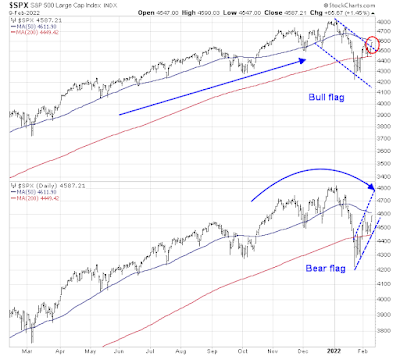
The key question for investors is whether current conditions represent a durable market bottom, or just a bear market rally.
The full post can be found
here.