Wednesday, March 11, 2015

Behold the tsunami of liquidity from China

I generally don't write about the local real estate market, but this analysis pertains to a more global investment issue - the internationalization of the RMB, but in a way that Beijing may not have intended.


Prices of Vancouver property have been very high and deemed to be unaffordable by most price to income metrics for quite some time. A recent study indicated that Vancouver is the second least affordability city in the world, after Hong Kong. Anecdotal evidence suggests that money from Mainland China has pushed up prices, which has made the locals rather upset because they are being priced out of the market.


An article in the local newspaper, The Province, tells the story of the flood of money coming in from Mainland China (emphasis added):
Kirk Kuester, executive managing director of Colliers International Vancouver, said the pool of money from Mainland China seeking investments in Metro Vancouver is so vast right now that he has to turn away potential clients.

“The money is staggering, quite honestly,” Kuester said.

“It is essentially from Mainland China. They were looking at private houses in residential developments in Vancouver, and it really seemed to accelerate in mid-2013. It’s a security play, and a diversification play.

“But now we are seeing them look for cash flow from commercial sites. The biggest challenge we face is scale and process.”

Kuester said a range of Chinese investors — from state-backed funds to smaller players with just tens of millions — expect to quickly ink deals for land by offering sky-high bids. But they are sometimes frustrated by the politicized nature of development deals in Vancouver, and multi-bid processes.

Kuester said, for example, that on Wednesday he had two or three potential clients with “half-a-billion” in private funds ready to put to work, but there are simply not big enough deals to satisfy them.

“Some of these groups want to buy the biggest sites in the city and do developments that are comparable to projects in China, but would be on the upper end of anything ever done here,” Kuester said.
In addition, a study by the Conference Board of Canada shows a high degree of correlation between Chinese GDP growth and Vancouver real estate prices:
Statistical analysis confirms the importance of China’s economic health to Vancouver’s housing markets. Standard tests find significant correlations between the country’s real GDP growth and three important market yardsticks: existing home sales, existing home price growth and total housing starts. By contrast, local employment growth is significantly correlated to none of these and the five-year rate related to only the resale variables. This could mean that a substantial proportion of Vancouver real estate purchasers do not need local jobs to buy any home (new or existing) and that many do not need a mortgage to buy a new home. On the other hand, better economic health in China gives its residents wealth to spend on Vancouver housing.
The anecdotal and statistical evidence in intriguing, but the flow of funds effects are hard to quantify. Sure, Vancouver is a nice place to live. The climate on the west coast is mild compared to the rest of Canada. Here is just a sample from my tweet on February 17:


No doubt Vancouver real estate deserves to trade at a slight premium, but how much? How much of the elevated prices can be attributable to the Mainland China effect?


The Vancouver-Victoria premium
One way of measuring the foreign money effect is to analyze the relationship between property prices between Vancouver and nearby Victoria, which is located on Vancouver Island. Victoria is a smaller city, also on the coast. The main sources of employment in Victoria are government, as it is provincial capital, tourism and the local university (in that order). While Vancouver Island has seem some retirement emigration from Boomers from the rest of Canada seeking a better climate and slower lifestyle, it has seen little overseas investment compared to Vancouver, which is the major Canadian metropolis on the west coast.

Using data from the University of British Columbia, here are the quarterly real estate prices from each city starting in 1975:


Here is the Vancouver-Victoria house price ratio for the same period, smoothed by a rolling four quarter average as quarterly figures can be volatile.


We can observe the effects of foreign money on Vancouver property prices by measuring the Vancouver-Victoria premium. Vancouver has seen three waves of Chinese money coming in over the past few decades. First, there was a wave of Taiwanese immigration in the late 1980s. Ahead of the 1997 British handover of Hong Kong to China, there was an additional flood of money flooding into the Vancouver property market. Today, we are seeing the effects of Mainland Chinese funds flooding into Vancouver, as per the comments from real estate agents in the story quoted above.

Further, this analysis suggests that Vancouver is roughly 15% overvalued relative to Victoria. A correction could see prices plunge further as downturns often overshoot the fair value estimate. Both the Taiwan and Hong Kong buying episodes saw prices rise to a premium and a correction afterwards. Does this mean that Vancouver property prices are on the verge of collapse?


Correction, or buying panic?
There are two possible scenarios at play here. The current price surge episode in the Vancouver-Victoria premium that is similar in magnitude and duration as the previous two buying frenzies. The simplistic conclusion is that we could see a run of the mill correction in Vancouver property prices of 15% or more.

On the other hand, prices could melt-up for several reasons. First of all, the scale of the Chinese economy is an order of magnitude bigger than either Taiwan or Hong Kong, especially in light of a 2013 Bain study indicating that 60% of Chinese multi-millionaires would like to obtain either a foreign passport or residency status. Put the relative scales of population of China compared to Taiwan or Hong Kong into context, it suggests that the liquidity flood effect from China may not be over.

As a consequence, Chinese capital flight is occurring and flooding into places like the Vancouver real estate market. The chart below shows that the USD Index is in an extended, but secular uptrend. USD strength therefore puts tremendous downward pressure on the RMB, what happens if China were to devalue the RMB. Could that flood of money turn into a panic driven tsunami? Add to the mix the fact that as the USD strengthens, the CAD weakens and makes the CADCNY exchange rate more attractive for Chinese buyers of Canadian property.


Indeed, charts from Business Insider of the most important charts in the world show that the market is starting to price in a devaluation in the RMB-USD exchange rate:


David Cui of BoAML believes that pressures are building and Beijing will be forced to choose between devaluation or unemployment:


Martin Enlund of Nordea Markets more or less said the same thing. The RMB is overvalued compared to EUR and JPY, which puts pressure on Beijing to devalue:


FT Alphaville reports that we are already seeing signs of Chinese capital flight:
Charts from Nomura showing, on the left, China’s largest cumulative two-month decline in FX purchase positions on record occurring despite a record trade surplus over the same period and, on the right, the probable hoarding of foreign currency as reflected in a sharp monthly rise in foreign-currency deposits in January.
Or to paraphrase a bit further: more signs of capital flight and depreciation pressure in China.
In short, capital flight seems to be increasing and there are reports of ingenious ways of getting around Chinese capital control regulations. I have no idea of how this all plays out, but we can always depend on Zero Hedge for the Apocalyptic view of a global currency war:
What all of the above means is that China is suddenly finding itself in an unprecedented position: it is losing the global currency war, and in a "zero-sum trade" world, in which global commerce and trade is slowly (at first) declining, and in which everyone is desperate to preserve or grow their piece of the pie through currency devaluation, China has almost no options.

Well, that's not true. Because if China wants to enter the global currency wars, and it will soon have no choice, it has - according to Cornerstone - several options with which to stabilize its economy, but really all of which, due to the size of China's epic credit and investment bubbles, and keep in mind that China's housing bubble has not only burst, but is now deflating at a faster pace than what happened in the US after Lehman...

... boil down to just one: QE.

From Cornerstone:
Do you remember that from 2007 to late 2008, U.S. fed funds dropped 500 bp, and then the Fed still needed to do QE? The backdrop for China looks a bit similar. We had a credit bubble, they have a credit bubble. We had a housing bubble, they have a housing/investment bubble. Will China eventually have to go down the same path as the U.S., and the Eurozone? Roberto Perli believes the PBoC will first cut rates to 0%, before contemplating QE.

There you have it: the flowchart for what is in store for the world for the next 12-24 months - an ongoing deterioration in Chinese economic conditions, coupled with a weaker, but not weak enough, currency, before the PBOC first go to ZIRP, and then engages in outright QE.

And once China, that final quasi-Western nation, proceeds to engage in outright monetization of its debt, then and only then will the terminal phase of the global currency wars start: a phase which will, because global economic growth and that all important lifeblood of a globalized economy - trade - at that point will be zero if not negatve, will see an unprecedented crescendo of money printing by absolutely everyone, before coordinated devaluations mutate into uncoordinated, and when central bank actions morph from "all for one" to "each man for himself."

A blow-off top?
Should China choose the RMB devaluation route - and there are some very compelling reasons to do so, we could see a further surge of funds out of China from the johnnies-come-lately who missed the boat on the initial wave of capital flight. While I am not predicting that this is my base case scenario, such a turn of events would likely result in a final blow-off wave of liquidity which buoys property prices in places like Vancouver and Sydney to insane levels.

In that case, I leave the last word to David Woo of BoAML. FX volatility would skyrocket to levels last seen in past financial crises.


You can imagine what might happen to global asset prices were that to occur.

Tuesday, March 10, 2015

Getting close to a ST market bottom

In my last weekend post, I wrote that US equities was getting close to a bottom and I stand by those remarks. Using the market patterns of 2011 and 2012 as a template, I thought that stocks was getting oversold and downside risk was limited to 1-2% (see Bullish, but "data dependent"):
In some cases, the market rebounded right away. In another, it required a final flush before seeing a durable bottom.

My main takeaway from 2011 and 2012 is that near-term downside risk is limited to 1-2% from current levels. Today's SPX chart shows that the market is oversold on RSI-5. There is technical support at the 50 day moving average (2062) and further support at the uptrend line drawn from the October low (about 2040), which is roughly 1.5% below Friday's closing levels.
On Monday, we got an unimpressive bounce and I tweeted that the final flush scenario was in play:


On Tuesday, stock prices sold off dramatically and readings are at or very close to oversold levels where a durable bottom have been seen in the past. The chart below of the SPX with 5-day RSI, 14-day RSI and McClellan Oscillator (NYMO) tells the story. RSI-5 is oversold, but not showing a positive divergence of higher low, though past bottoms have not necessarily shown such readings. RSI-14 closed at 38.87, which is nearing the range where the market has bottomed in the past few months. NYMO came in at -59.87, which is just a fraction away from an oversold reading of -60. Finally, the SPX closed at 2044.16, below the key 50 day moving average, but just above trend line support at about the 2040 level.


In addition, fear indices are starting to spike. The chart below of the VIX term structure, as measured by the VIX-VXV ratio, and TRIN shows capitulation-like market behavior. The VIX-VXV ratio is rising, though it is not inverted (above 1). TRIN spiked to 2.64, which indicates panic selling. I have drawn blue vertical lines to mark past instances in the last three years when TRIN has risen above 2 and red vertical lines to mark past instances when the dual conditions when VIX term structure inverted and TRIN was over 2. The red lines have been much better at calling bottoms, but the blue lines have, more often than not, indicated instances when the market either bounced or downside risk was limited.


In short, market technicals suggest that stocks have either made a bottom or very close to a bottom. I have no idea what stock prices will do in the next couple of days, but the odds favor higher stock prices in the next week.

Monday, March 9, 2015

Why the Fed may stay "patient" a little longer

In the wake of the very strong NFP report last week, Tim Duy wrote a post indicating that "Patient" is History. He laid out his reasoning in a previous post:
My take is this: To get a reasonably sized consensus to support a rate hike, two conditions need to be met. One is sufficient progress toward full-employment with the expectation of further progress. I think that condition has already been met. The second condition is confidence that inflation will indeed trend toward target. That condition has not been met. To meet that condition requires at least one of the following sub-conditions: Rising core-inflation, rising market-based measures of inflation compensation, or accelerating wage growth. If any were to occur before June, I suspect it would be the accelerating wage growth.
Duy went on to say that he was not confident that we would see accelerating wage growth, or any upside from core inflation. I agree with that assessment and I posted these charts of wage growth and core inflation on the weekend (see Bullish, but "data dependent"). Here is the chart of the growth in Average Hourly Earnings.


Here is Core PCE and its sister metric, Trimmed Mean PCE:


Tim Duy went on to hang his hat of inflationary pressures on rising inflationary expectations from the bond market.
So wage growth might not be there in June to support a rate hike. And, as I noted earlier this weaker, I have my doubts on whether core-inflation would support a rate hike either. That leaves us with market-based measures of inflation compensation. And at this point, that just might be the key:
If bond markets continue to reverse the oil-driven inflation compensation decline, the Fed may see a way clear to hiking rates in June. But the pace and timing of subsequent rate hikes would still be data dependent. I would anticipate a fairly slow, halting path of rate hikes in the absence of faster wage growth.

Market or survey based inflationary expectations?
But the Fed has made it clear it doesn't really trust market based inflationary expectations and prefers to measure inflationary expectations from surveys. Here is what Janet Yellen said in response to a Greg Ip question about the 5Y5Y metric at the December 17, 2014 press conference (emphasis added):
Well, what I would say, we refer to this in the statement as “inflation compensation” rather than “inflation expectations.” The gap between the nominal yields on 10-year Treasuries, for example, and TIPS have declined—that’s inflation compensation. And five-year, five-year-forwards, as you’ve said, have also declined. That could reflect a change in inflation expectations, but it could also reflect changes in assessment of inflation risks.

The risk premium that’s necessary to compensate for inflation, that might especially have fallen if the probabilities attached to very high inflation have come down. And it can also reflect liquidity effects in markets. And, for example, it’s sometimes the case that— when there is a flight to safety, that flight tends to be concentrated in nominal Treasuries and could also serve to compress that spread. So I think the jury is out about exactly how to interpret that downward move in inflation compensation.
While the explanation somewhat unclear and unsatisfactory, Yellen makes it clear that she believes that there are other terms that are in the 5Y5Y figure. In other words, it is not a "pure" measure of inflationary expectations.


Latest survey: Falling inflation
In that case, what does the latest survey data say? The WSJ reported on the latest New York Fed consumer survey:
Consumers’ expectation of future inflation is growing weaker, according to new data from the Federal Reserve Bank of New York.

In its monthly survey of household’s attitudes about the economy, the bank found the median expectation for inflation over the one-year horizon edged down to 2.8% in February, the lowest reading since the series began in June 2013. The one-year-ahead expected inflation reading stood at 2.9% in January and 3% in December.
While I recognize that the FOMC relies on several surveys of inflationary expectations, this latest data point is highly suggestive that inflationary pressures remain tame. No doubt, there will be lots of debate at the upcoming FOMC meeting over the improving employment picture vs. the lack of inflationary pressure, but current readings indicate that Tim Duy's criteria that "inflation will indeed trend toward target" is not satisfied.

That may just prompt the Fed to stay patient, at least for one more meeting.

Sunday, March 8, 2015

Bullish, but "data dependent"

Trend Model signal summary
Trend Model signal: Risk-on
Trading model: Bullish

The Trend Model is an asset allocation model which applies trend following principles based on the inputs of global stock and commodity price. In essence, it seeks to answer the question, "Is the trend in the global economy expansion (bullish) or contraction (bearish)?"

My inner trader uses the trading model component of the Trend Model seeks to answer the question, "Is the trend getting better (bullish) or worse (bearish)?" The history of actual (not backtested) signals of the trading model are shown by the arrows in the chart below. In addition, I have a trading account which uses the signals of the Trend Model. The last report card of that account can be found here.


Update schedule: I generally update Trend Model readings on my blog on weekends and tweet any changes during the week at @humblestudent.


Breakout, consolidation and pullback
I have written before that 2011 may be a good template for the current market (see 2011 all over again? and The 2011 pattern continues).

As shown by the 2011 chart of the SPX below, the 2011 market was saw much up and down choppy action, which moved the market to an oversold reading on the 5-day RSI (blue vertical lines). It then staged an upside breakout, consolidated sideways and then pulled back below the breakout level. It finally resolved itself by staging a sustained rally after the pullback test (red vertical line).


Today, we see a similar pattern in the US and European markets. The SPX staged an upside breakout to all-time highs and it is now in the process of pulling back to test the breakout. What is comforting to the bull case is that the European averages have held their strength above the breakout lines. As well, Asian equity markets and commodity prices are not showing any significant signs of weakness, which also bolsters the bull case for equities from an inter-market analytical viewpoint.


The market in 2012 also saw a similar breakout, consolidation and pullback episode. Note the instances of short-term oversold readings marked by the vertical lines. In some cases, the market rebounded right away. In another, it required a final flush before seeing a durable bottom.


My main takeaway from 2011 and 2012 is that near-term downside risk is limited to 1-2% from current levels. Today's SPX chart shows that the market is oversold on RSI-5. There is technical support at the 50 day moving average (2062) and further support at the uptrend line drawn from the October low (about 2040), which is roughly 1.5% below Friday's closing levels.


A Goldilocks market?
From a fundamental viewpoint, the bull case is supported by a not-too-hot, not-too-cold economic environment of non-inflationary growth. Take, for example, the February Employment Report released Friday that spooked the market. The headline NFP figure of 295K was well ahead of expectations and represented an excellent growth outlook.

On the other hand, there was little sign of inflationary pressures. Average hourly earnings came in at 0.2%, a muted level and consistent with expectations. There is no sign of wage inflation:


The Beige Book release last week told a similar story of rising employment and little wage inflation:
Payrolls remained stable or expanded across the Districts, and contacts noted employment gains in a broad range of sectors. Wage pressures remained moderate and were limited largely to workers in skilled occupations. Most District contacts cited only flat to slightly increasing prices.
In addition, Core PCE, which is the Fed's favorite inflation metric, and Trimmed Mean PCE, a similar series compiled by the Dallas Fed, shows that inflationary pressures are decelerating, not accelerating:


In the meantime, consensus forward EPS estimates compiled by John Butters of Factset is starting to rise again, indicating improving growth expectations:


In summary, we are seeing rising growth and muted inflationary pressures, which will help to keep the Fed rate increase on hold. What more could an equity investor ask for?


Key risks, a.k.a "Data Dependence"
Nevertheless, there are a number of key risks to the bullish forecast. Most notably, the US could see a growth scare in 1Q. The latest nowcast from the Atlanta Fed of GDP growth continues to decelerate:


The latest weekly commentary of high frequency economic releases from New Deal democrat pretty much said the same thing (emphasis added):
Negative coincident indicators have continued for the last three weeks, with the intensification last week probably primarily due to the now-settled West Coast ports strike appearing to abate somewhat.

Among long leading indicators, yields on corporate bonds and treasuries are still positive although less so. Money supply is even more positive. Real estate loans, and house sales as reported by DataQuick were positive. Only mortgage applications remain in negative territory.

For the first time in a long time, the short leading indicators were generally negative. Oil prices fell slightly, while industrial metal prices fell more, almost to a new low. Spreads between corporate bonds and treasuries increased slightly and I am now scoring them slightly negative again. Temporary staffing turned negative for the first time in many months (as did temporary jobs as reported in yesterday's jobs report). Gas prices and usage remained positive, and initial jobless claims, although significantly higher, remain within a positive range.

As indicated above, coincident readings were much more negative. Rail was again awful, although less awful than last week. Consumer spending as measured by Gallup was negative yet again, and Johnson Redbook was only weakly positive. Steel production was even more negative. The TED spread and LIBOR have increased enough that both are now negatives. On the bright side, shipping was positive, as was tax withholding.

The weakness in the high frequency data has spread from coincident to short leading indicators. While some of the effects are probably transitory, that we are seeing YoY negative comparisons with some of the worst readings last year does not bode well for Q1 GDP.

The long leading indicators remain positive, and it will take more than one week of negativity in the short leading indicators to cause me to become more concerned. I will be paying particular attention to rail and to Gallup consumer spending to see if they turn positive in the next several weeks, and to see if the temporary staffing downturn was just one week of noise.
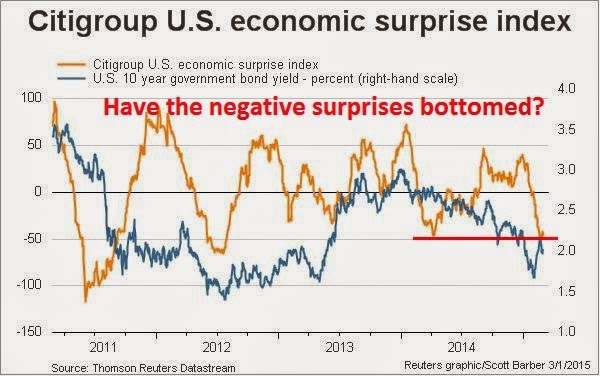
However, I am reluctant to jump on the weakening growth scenario as my base case, largely because the Citigroup US Economic Surprise Index (gold line in chart below) is at levels that have seen rebounds in the past:


My lines in the sand
Bottom line: I am giving the bull case the benefit of the doubt, but my outlook is highly "data dependent".

From a fundamental viewpoint, should the growth outlook start to falter, either in the form of falling EPS estimates, a deteriorating US macro outlook, or signs of faltering growth from overseas or commodity prices, the Trend Model would then start to turn more cautious.

From a technical viewpoint, should the SPX decisively break the 50 dma and further violate the uptrend that began last October, which is currently at about 2040, my inner trader would turn negative on the market. I would note that while US equity prices are poised to bounce at current levels, a scenario where stock prices rally and then suffer a final wash-out is well within the realm of possibility. As long as the SPX doesn't breach those technical lines in the sand, the bull case is still intact.

In the meantime, US equities are oversold and setting up for a bounce next week. The key test is how it behaves after the oversold rally, both from a fundamental and technical point of view.


Disclosure: Long SPXL, TNA

Wednesday, March 4, 2015

Zen and the art of Chinese economic re-balancing

The latest news out of China is Beijing has set its 2015 growth target at about 7%. Notwithstanding the numerical value of the GDP growth target, one of the key elements of Chinese economic policy is to re-balance the source of growth from credit-driven infrastructure and export oriented growth to the Chinese consumer. My latest progress report on China shows that the country is both re-balancing and not re-balancing.

Read that sentence again. Yes, you read it right. It is and isn't re-balancing.

Let me explain. Last week, China Daily reported that the re-balancing process is progressing well:
Domestic consumption surpassed investment to become the strongest driving force of the Chinese economy in 2014, indicating a new growth model has already started forming as the country enters a "new normal" development era, the National Bureau of Statistics said on Thursday.

Total consumption accounted for 51.2 percent of gross domestic product growth last year, compared with 48.6 percent from investment. Net exports accounted for just 0.2 percent of the GDP growth, said the NBS report.

Xie Hongguang, the NBS deputy director, said: "It means that the consumption-driven growth model has started taking shape, and the economic structure has started improving."

According to the official data, in 2013 final consumption contributed half of the nation's GDP growth and 54.4 percent was from investment, while net exports dragged down GDP by 4.4 percent.
But then, how much can we trust official Chinese statistics?


Does the market believe China is re-balancing?
On the other hand, equity based market indicators are telling a different story. I track the progress of two Chinese ETF pairs that measure the relative performance of Chinese consumer stocks relative to a mainly financial stock basket. The long side on the first pair, PGJ, is heavily weighted in Chinese technology names with heavy exposure to Chinese consumption (e.g. NetEase, Baidu). The long side on the second pair is Global X China Consumer ETF (CHIQ), which is weighted towards direct consumer plays like Great Wall Motor and Vipshop. The short side on these baskets are predominantly Chinese finance and bank stocks, which represents the old model of credit-driven infrastructure growth.

The chart below shows how these pairs have performed in the last three years. When the lines are rising, consumer stocks are outperforming, which is an indication that re-balancing is progressing well. When the line is falling, re-balancing is suffering a setback. As the chart shows, both pairs have been in a downtrend for about a year. This is an indication that the market believes that, despite all the rhetoric, Beijing has gone back to the same-old-same-old model of credit-driven infrastructure growth.


An immature manufacturing base
How can we reconcile Chinese government statistics about rising household consumption and the underperformance of Chinese stocks that are sensitive to the consumer? The most obvious explanation is that China makes up its economic releases. There is also an alternative view, which suggests that both government statistics and market based indicators are correct.

Consider this report from Forbes about Chinese tourists going to Japan to buy high-tech toilet seats:
“World-class toilet seats are not what Chinese manufacturers aspire to make,” the nationalistic Global Times sniffed on Thursday. The Communist Party paper was reacting to reports that China’s tourists were eagerly snapping up Japanese goods, especially electronic personal hygiene accessories, during the just-completed Lunar New Year holiday.

Lunar New Year sales in China were up 11% according to the Ministry of Commerce. That figure seems to overstate domestic spending during the period, but in any event purchases by the country’s tourists abroad evidently increased by a higher percentage. A shift in spending patterns suggests Chinese-made goods are losing favor with China’s increasingly demanding consumers.
The real reason for the Chinese to buying consumer abroad is the perceived quality of foreign made goods (emphasis added):
Why would the Chinese go all the way to Japan to purchase something they could get at home? There appear to be two reasons. First, it was reported that the Chinese goods were cheaper in Japan than in China. But price was not the primary consideration. Second, I think the Chinese believed that Japanese retailers, unlike their Chinese counterparts, would carry only high-standard items.

China’s people, who can often afford the best, are demanding better goods. As the influential Beijing Youth Daily noted, “Chinese enterprises are focused more on producing low-priced products, but they missed the point that more and more Chinese consumers are starting to care more about quality, rather than price.”

Despite years of experience, Chinese manufacturing is not moving up the quality chain as fast as expected. As a result, “overseas trips are turning into regular shopping trips for household items” the South China Morning Post reports.
There have been far too many scandals over the quality of domestic products in China:
Many of China’s producers are apparently unable to bridge the quality-perception gap. Take an item that top Chinese leaders have repeatedly promised to improve: milk powder.

Last month, there were violent protests in Hong Kong as local people there tried to stop “parallel traders” who were emptying shelves of milk and other items. The busy traders often make multiple trips a day to carry goods into Mainland China. Sometimes parents themselves make the trip.

Why is foreign milk powder so valuable in China? Chinese powder is often poisonous and sometimes lethal. About 300,000 Chinese children suffered kidney damage in 2008 because local producers were adding melamine, an industrial chemical, to milk. At least six infants died. Since then, there have been isolated scandals involving milk and many incidents involving other adulterated foods.
In summary, this is the story of how China is re-balancing and not re-balancing its economy. Consumption is re-balancing, but it may not necessarily be to the benefit of domestic suppliers. Chinese manufacturers need to start to develop the right corporate culture and learn to move up the value chain to focus on quality instead of just price. Until that happens, much of the benefits of re-balancing growth towards the Chinese household sector is likely to accrue to foreign firms.

Tuesday, March 3, 2015

Trend Model Feb 2015 report card: -4.0% drawdown

The winning streak, which lasted eight months, finally came to an end. The Trend Model account fell -4.0% in February; the one-year return was 43.7%; and the return from inception of September 30, 2013 was 35.8%. The batting average of positive to negative months remains highly respectable at 71%.


I reiterate my disclaimer that I have nothing to sell anyone right now. I am not currently in a position to manage anyone`s money based on the investment strategy that I am describing.


Trend Model description
For readers who are unfamiliar with my Trend Model, it is a market timing, or asset allocation, model which uses trend following techniques as applied to commodity and global stock market prices to generates a composite Risk-On/Risk-Off signal (risk-on, risk-off or neutral). I have begun updating readers on the Trend Model signals on a weekly basis (for the last weekly comment, see The upside breakouts are holding) and via Twitter @humblestudent as new developments occur.

The chart below shows the actual (not back-tested) changes in the direction of the signal, which are indicated by the arrows, overlaid on top of a chart of the SP 500. You can think of the blue up arrows, which occurred when the trend signal changed from negative to positive, as buy signals and the red down arrows, which occurred when the trend signal changed from positive to negative, as sell signals.

Trend Model Signal History

A proof of concept
While the results from the above chart representing paper trading is always interesting, there is no substitute for actual performance. As a proof of concept, I started to manage a small account that traded long, inverse and leveraged ETFs on the major US market averages and, on occasion, sector and industry ETFs. Trading decisions were based on Trend Model signals combined with some short-term sentiment indicators. The inception date of the account was September 30, 2013 and the chart below represents an interim report card of that account. (For more details on how the Trend Model or how the account is managed, see my post Trend Model FAQ).

When evaluating the performance of this trading account, keep in mind that this is intended to be an absolute return vehicle. While I do show the SPY total return, which includes re-invested dividends, for illustrative purposes, the SP 500 is not an appropriate benchmark for measuring the performance of this modeling technique.


A difficult February
The account was down -4.0% in February, 43.7% for one year and 35.8% from inception (September 2013). However, I would also like to point out that turnover averaged about 200% per month, so this strategy is not for everyone.

Despite the positive returns shown by the account, the market environment was especially challenging for this kind of trading system. The Trend Model signals are primarily based on the application of trend following principles to global stock and commodity markets. Trend following systems simply do not perform well in either sideways markets that are subject to whipsaw, or markets that experience sharp reversals.

For readers who have been following my trading signals, the first couple of months was characterized by a whipsaw signals, which are marked by the rectangles in the signal history chart below. It was therefore no surprise that the account saw a loss in the month of February. Indeed, I was somewhat surprised to see a positive performance of 1.9% in January.


Despite the challenging environment, this strategy continue to be promising:
  • Returns are strong and the Trend Model is performing roughly as expected.
  • Return consistency is still positive with a 71% batting average.
  • Returns are highly diversifying compared to major asset classes. They are uncorrelated with equities (correlation of -0.31 with SPY) and bonds (-0.34 with AGG).
In addition, a study of monthly returns show that this strategy tends to let winners run and limit losses. While the sample size is still relatively small, the chart below shows that the distribution of monthly returns are skewed to the right with returns all the way up to 10% or more, while the negative returns that appear on the left are limited at the 2-4% level.


2015 could be an acid test year
I continue to believe that the market environment is likely to be challenging for both stocks and the Trend Model trading strategy in 2015. In a recent market review, I postulated a positive year for US stock prices but with a much higher (see 2015: Bullish skies with scattered periods of volatility). Trend following models do not perform well in choppy markets.

The stock market does see increased volatility, then the choppiness will indeed be an acid test for this trend following strategy. Positive returns during these volatile periods will lean more on the short-term sentiment models that I use to better assist the main trend following model to calibrate both entry and exits as well as the magnitude of position commitment.

To summarize, results continue to be promising for this model. Readers who want to monitor the signals of the Trend Model to subscribe to my blog posts here, which include Trend Model updates, or follow me via Twitter @humblestudent.

Monday, March 2, 2015

How the Market can resolve the Iran question

I normally don't comment about politics, but sometimes you see people get caught up in their straitjackets and I can't resist.

There has been much controversy over the upcoming speech by Israeli Prime Minister Netanyahu to Congress. No doubt, he will say that Iran is an existential threat to Israel and that the US must act with further sanctions to curtail the Iranian nuclear program, etc.

Notwithstanding the fact that the thesis has a boy who cried wolf quality because Netanyahu warned Congress about the imminent nuclear threat from Iran all the way back in 1996, let us suppose that we were to accept the premise that the Iranian nuclear program is indeed an existential threat to continuation of the State of Israel. In that case, what would you pay to eliminate an existential threat? Trade sanctions? Bombing? Covert or open warfare? Would you pay any price?


The market based solution
How about an offer to buy the nuclear facilities and research capabilities in Iran? Does that qualify under the category of "any price"? There are lots of details to be worked out. I envisage a deal where Israel, perhaps with US participation, buys up all of the Iranian nuclear IP, research and facilities, in return for some sum and the lifting of trade sanctions.

There are also huge benefits to all parties under such a framework. From the Iranian viewpoint, such a deal would achieve the stated Iranian objective of peaceful nuclear development and it provide a much needed boost to its economy. Moreover, it would most likely mean the elimination of sanctions, open Iranian oil fields to much needed foreign investment and open its borders to the global economy - and who is philosophically opposed to free and open markets?

From the Israeli perspective, it would eliminate the existential tail-risk of Iranian nuclear arms. As well, it could alleviate many of the budgetary strains from military spending. According to Wikipedia, Israel devotes an enormous amount of its budget to defense spending:
During 1950–66, Israel spent an average of 9% of its GDP on defense. Defense expenditures increased dramatically after both the 1967 and 1973 wars. They reached a high of about 24% of GDP in the 1980s, but have since come down significantly, following the signing of peace agreements with Jordan and Egypt.

On 30 September 2009 Defense Minister Ehud Barak, Finance Minister Yuval Steinitz and Prime Minister Benjamin Netanyahu endorsed an additional NIS 1.5 billion for the defense budget to help Israel address problems regarding Iran. The budget changes came two months after Israel had approved its current two-year budget. The defense budget in 2009 stood at NIS 48.6 billion and NIS 53.2 billion for 2010 – the highest amount in Israel's history. The figure constituted 6.3% of expected gross domestic product and 15.1% of the overall budget, even before the planned NIS 1.5 billion addition.

However in 2011, the prime minister Benjamin Netanyahu reversed course and moved to make significant cuts in the defense budget in order to pay for social programs. The General Staff concluded that the proposed cuts endangered the battle readiness of the armed forces. In 2012, Israel spent $15.2 billion on its armed forces, one of the highest ratios of defense spending to GDP among developed countries ($1,900 per person). However, Israel's spending per capita is below that of the USA.
Imagine what could happen to Israelis prosperity if the Iranian nuclear tail-risk were to be taken off the table and it could reduce its defense expenditures. I remember reading a study done in the 1970s of the economic effects of the 1967 and 1973 wars on Israel and the participating Arab countries. During those wars, the Israeli economy crashed, largely because reservists were mobilized and economic activity ground to a halt. By contrast, the GDP of countries like Egypt and Syria actually rose, because those economies were highly inefficient and state driven that the wars provided a Keynesian stimulus and actually boosted employment and productivity.

Sure, it would not eliminate all of the irritants between Israel and Iran. Netanyahu still calls Iran a state sponsor of terrorism, but that is not an existential tail-risk and it can be managed. After all, ISIS is camped on the Golan Heights on the Israeli border and the Israeli government is managing that risk reasonably well.

I offer this as an outside the box market-based solution to a geopolitical problem. Many in government are still in their straitjackets about the kinds of tools that are available to them to solve problems. Government run solutions, like military ones, are not always the answer. Sometimes they should place their trust in the Power of the Market.

No need to thank me. The Nobel Peace Prize committee already has my phone number.

Sunday, March 1, 2015

The upside breakouts are holding

Trend Model signal summary
Trend Model signal: Risk-on
Trading model: Bullish

The Trend Model is an asset allocation model which applies trend following principles based on the inputs of global stock and commodity price. In essence, it seeks to answer the question, "Is the trend in the global economy expansion (bullish) or contraction (bearish)?"

My inner trader uses the trading model component of the Trend Model seeks to answer the question, "Is the trend getting better (bullish) or worse (bearish)?" The history of actual (not backtested) signals of the trading model are shown by the arrows in the chart below. In addition, I have a trading account which uses the signals of the Trend Model. The last report card of that account can be found here.


Update schedule: I generally update Trend Model readings on my blog on weekends and tweet any changes during the week at @humblestudent.


The uptrend continues
US equity markets paused last week and continued to consolidate their gains. I interpret the fact that the sideways consolidation occurred above the upside breakout level as a bullish signal. In addition, the Trend Model dashboard of global equity and commodity markets continues to point to a risk-on environment.

Consider these charts of US, UK and eurozone equities, which have all staged upside breakouts. All markets are above their breakout levels. Eurozone equities, as measured by the Euro STOXX 50, have strengthened to further highs.


Over in China, Beijing has announced a series of stimulative measures. On Saturday, the PBoC announced another round of interest rate cuts. In addition, Bloomberg reported that other steps are being prepared to revive growth:
China is preparing measures to counter a housing market slump and will roll them out if the economy needs support, people with knowledge of the matter said.

The government could reduce down-payment requirements for second-home purchases, the people said, asking not to be identified as the information isn’t public. Another possible step: removing the sales tax after homeowners hold their property for two years -- down from a five-year minimum now.
Possibly in anticipation of these measures, the stock markets of China’s major Asian trading partners are in solid uptrends and the Shanghai Composite is in rally mode.


Key commodity prices, such as the CRB Index and industrial metals, have begun to bottom:


From a global inter-market analytical perspective, these developments are bullish.


US equity fundamental improving
Further, I had expressed concerns in the past that in order for stock prices to advance, either the E in the PE ratio has to grow or the PE ratio has to expand. The latest analysis from Ed Yardeni and John Butters of Factset indicate that Street consensus forward 12-month EPS, after a prolong period of decline, have bottomed and stared to improve again.

The top panel of the chart below, which comes from Ed Yardeni, shows that forward EPS for the SPX rose from 122.77 to 122.80 for the week ending February 19. The bottom chart, which comes from Factset, also shows that forward EPS have stopped their decline (annotation in purple are mine).


The evolution of forward EPS is an analysis of the US equity market from a bottom-up perspective. There are also signs of stabilization and upturn from a top-down perspective as well. The Citigroup US Economic Surprise Index, which measures whether economic releases are beating or missing expectations, appear to be making a bottom just as I suggested last week (see The 2011 pattern continues).


Similarly, New Deal democrat, who monitors high frequency economic releases, wrote this week that while coincidental indicators were weak, short and long leading indicators are generally positive. Presumably coincidental indicators accounted for much of the weakness seen in the Citigroup US Economic Surprise Index.

There are also some positive developments on the PE front. The inverse of the PE ratio is the EP ratio, which is a function of interest rates. Reuters reported last week that Bill Dudley favors a policy of erring on the side of caution when it comes to the timing of the first interest rate hike (emphasis added):
Raising interest rates too late is safer than acting too early, an influential Federal Reserve official said on Friday, endorsing a high-profile research paper that argues that the U.S. economy, given time, can rebound to normal growth.

The paper by four top U.S. economists, presented on Friday to a roomful of powerful central bankers in New York, argues the Fed would be wise to keep rates at rock bottom for longer than planned and then tighten monetary policy more aggressively.

New York Fed President William Dudley, who offered a critique of the paper, cited currently low inflation and warned against being too anxious to tighten monetary policy.

The risks of hiking rates "a bit early are higher than the risks of lifting off a bit late," he told a forum hosted by the University of Chicago's Booth School of Business. "This argues for a more inertial approach to policy."
No doubt a June liftoff is still on the table, but how likely is it when Bill Dudley, who is part of the inner circle triumvirate of Yellen, Fischer and Dudley at the Fed, urges caution?

One of the key metrics that I will be watching is the Employment Report, which is due out on Friday. Instead of just watching the headline Non-Farm Payroll figure, I will be paying close attention to Average Hourly Earnings, just as I did last month (see The ONE NUMBER to watch in Friday's NFP report). No doubt, the Fed will also be closely monitoring this data point for signs of wage pressures. Average Hourly Earnings came in at 0.5% for January, but the consensus expectation is for a rise of 0.2%.


More consolidation ahead?
All these factors indicate that the intermediate term trend is up. Tactically, however, the markets may need a bit more time to consolidate their gains. The chart below of the SPX shows that the 5-day RSI, which is useful for swing trading, has descended from an overbought condition. Such reading often signal a market pullback. However, a glance at the SPX chart in the bottom panel shows that the index remains above its breakout levels and support is nearby at 2090-2100, which is less than 1% below the current level of 2105.


I would therefore anticipate further consolidation and minor weakness in the week ahead. As long as the market does not violate that support zone, the path of least resistance should be upward.

My inner trader is long the market and regards any minor pullback as a buying opportunity, but he has stop losses placed just below the aforementioned support levels. My inner investor is shifting to a more risk-on profile with his portfolio and allocating a greater portion to equities.


Disclosure: Long SPXL, TNA

Friday, February 27, 2015

Will Bridgewater unleash Terminator-like alpha-bots?

There has been some buzz about this latest announcement from Bridgewater:
Ray Dalio’s $165 billion Bridgewater Associates will start a new, artificial-intelligence unit next month with about half a dozen people, according to a person with knowledge of the matter. The team will report to David Ferrucci, who joined Bridgewater at the end of 2012 after leading the International Business Machines Corp. engineers that developed Watson, the computer that beat human players on the television quiz show “Jeopardy!”

The unit will create trading algorithms that make predictions based on historical data and statistical probabilities, said the person, who asked not to be identified because the information is private. The programs will learn as markets change and adapt to new information, as opposed to those that follow static instructions. A spokeswoman for Westport, Connecticut-based Bridgewater declined to comment on the team.
I have much respect for Bridgewater and AI applications, but this latest initiative is unlikely to unleash an army of Terminator-like robots that relentlessly seek out alpha in the investment business.

Let me explain why. The classic approach of evaluating an investment manager is through the 4 or 5Ps:

  1. People: Who are they? What are their pedigrees? What is their experience, legal and regulatory history, etc.
  2. Performance: What are the returns? What is the risk profile, etc.
  3. Philosophy: Why do you think you have an alpha? What distinguishes you from the other managers?
  4. Process: How do you implement your stated investment philosophy?
  5. Portfolio (optional): Does your portfolio reflect what you said about your investment philosophy and process?
The problem with AI systems that learn from past history and its mistakes is that they are notoriously difficult to debug. When something goes haywire, it becomes virtually impossible to walk back the steps that led to the misstep. Was the bad decision a bug, or a feature? It is very difficult to tell.

In the framework of the Ps, it becomes very difficult to have confidence in a investment process where you have no idea of what is going on, other than the fact that it is a black box. That is why AI systems are unlikely to be in widespread use - few institutional sponsors will trust them. In the absence of widespread adoption, we are unlikely to see a future army of AI-bots rooting out alpha.

Maybe I'm just too much of a fuddy duddy, but I have been around far too long to


Chaos Theory: A cautionary tale 
Back in the early 1990s, there was also similar kinds of excitement in the investment community over Chaos Theory, which was also known as non-linear dynamics. Wikipedia explained Chaos Theory as follows:
Chaos theory is a field of study in mathematics, with applications in several disciplines including meteorology, sociology, physics, engineering, economics, biology, and philosophy. Chaos theory studies the behavior of dynamical systems that are highly sensitive to initial conditions—a response popularly referred to as the butterfly effect. Small differences in initial conditions (such as those due to rounding errors in numerical computation) yield widely diverging outcomes for such dynamical systems, rendering long-term prediction impossible in general. This happens even though these systems are deterministic, meaning that their future behavior is fully determined by their initial conditions, with no random elements involved In other words, the deterministic nature of these systems does not make them predictable. This behavior is known as deterministic chaos, or simply chaos. The theory was summarized by Edward Lorenz as follows:
Chaos: When the present determines the future, but the approximate present does not approximately determine the future.
The idea is that non-linear systems can be highly interconnected, but initial condition dependent. In one moment, a butterfly flapping its wings could conceivably cause weather havoc on the other side of the world, but in another, nothing would happen.

One example of a principle that is initial condition dependent is Elliot Wave Theory, which is a charting technique known well to technical analysts. The interpretation of a chart can be highly dependent on how the analyst begins his wave count and different starting points can lead to very different conclusions (one reason why I've never understood EW very well).

A number of years ago, I spoke to the head of a large quantitative investment firm in Boston and their firm had done extensive work in non-linear systems. They had some success with it, but abandoned it after discovering that the risk-adjusted alpha that it generated was roughly in line with traditional linear factors such as the value, growth and momentum. These systems were just too difficult to control and diagnose, especially if investment results turned negative.

The moral of this story: Stick with something simple. (That's how you can live long and prosper.)

Tuesday, February 24, 2015

Buy Europe?

The storm clouds are lifting in Europe. The FTSE 100 in the UK has rallied to an all-time high. Greek tail-risk is receding, but the drama doesn't seem to be over yet (though the Greek market seems to be washed out, see last week's post that was written before news of the deal Is it time to buy Greece?). Moreover, we are seeing more and more articles like 7 charts that will make you feel more optimistic about Europe, which are:

  1. Emerging Europe PMIs swinging up
  2. Growth in the eurozone is good for the globe
  3. Surprise! Europe is beating expectations (at a macro indicator level)
  4. GDP growing
  5. No lack of confidence in consumption
  6. Russia, the not so bad news bear
  7. Low valuations, high dividend yields

Is this the time to be jumping into European equities?

Not so fast! After giving the matter some thought, I came to a contrary conclusion of targeting the bulk of an investor`s equity exposure to the US and Asia X-Japan. Here is a chart of the relative returns of the US (SPY), Europe (FEZ) and Greater China (equal weighted FXI, EWH, EWT, EWY) relative to the MSCI All-Country World Index (ACWI). These relative returns are useful in that they all use ETFs trading in USD so there are no currency effects.


Stay long the US
As the chart shows, the US market has been in a steady relative uptrend against global stocks since 2010 and there is no technical sign that that relative uptrend is likely to be broken. Further, the latest BoAML shows that institutional managers have pulled back from their US weights and they are roughly neutrally weighted in US stocks, which can give them more room to run.


Eurozone crowded long
By contrast, institutions are highly overweight eurozone equities, which makes the contrarian more cautious about this region. Expectations are running high for the eurozone.


On a relative basis, the last time the eurozone-US relative weight spread was this level was November 2007:


The greater propensity of fund managers to overweight the eurozone compared to the US can be explained by the expectations of better than expected growth in the eurozone compared to the US:


This discrepancy has led to a spike in earnings growth expectations for European equities.


Wow, talk about heightened expectations for Europe! One wrong step and managers could all rush for the exit.


Greater China turns up
By contrast, Greater China (China, Hong Kong, South Korea, Taiwan) is starting to show a turnaround in relative performance. By way of explanation, I constructed the Greater China ETF basket is a useful way of getting exposure to China and its major Asian trading partners.This basket rallied through a multi-year relative downtrend and seems to be on its way to better relative returns. I had also highlighted the constructive chart patterns of the stock markets of China's Asian trading partners in my recent post (The 2011 pattern continues).


If we were to just focus in on Asia xJapan equity allocations as reported by the BoAML Fund Manager Survey, the greatest overweights are India, the Philippines and New Zealand, which indicates a possible contrarian long position in the Greater China theme.


When I first focused on the question of regional equity allocation, my first instinct was to think about the eurozone. Upon further study, the excessive optimism about the eurozone was a surprise to me. My conclusion is to tilt the weight of the equity portion of a portfolio towards the US and Asia xJapan.