Mid-week market update: Instead of just focusing on the U.S. market, I offer these two mystery charts of EM markets. One is a contrarian play, the other a momentum play.
Showing posts with label emerging markets. Show all posts
Showing posts with label emerging markets. Show all posts
Wednesday, September 13, 2023


Saturday, July 16, 2022
How the Fed is acting like a bull in the china shop
The June CPI and PPI reports both came in higher than expectations. The good news is core CPI is decelerating. The bad news is both core sticky price CPI and Owners' Equivalent Rent, which is about one-third of core CPI, are rising rapidly.
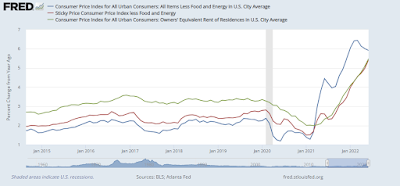

These readings confirm the market's expectations that the Fed will continue to tighten until something breaks. In effect, the Fed is behaving like the proverbial bull in a china shop.
The full post can be found here.
Monday, June 14, 2021
What I meant to say was...
After a number of discussions with readers, there appears to have been some misunderstanding over my recent post (see The bond market tempts FAIT). I did not mean to imply that the advance in bond prices is an intermediate-term move, only a tactical counter-trend rally. The decline in Treasury yields can be attributable to:

- The market's buy-in to the Fed's "transitory inflation" narrative, which was discussed extensively in the post;
- Excessively short positioning by bond market investors, as shown by a JPMorgan Treasury client survey indicating that respondents were highly short duration, or price sensitivity to yield changes; and

- A FOMO stampede by corporate defined-benefit pension plans. A recent study showed that pension plans were nearly fully funded from an actuarial viewpoint. Falling rates would raise the value of liabilities, and without asset-liability matching, pension plans were at risk of widening their funding gap.

In short, the bond market rally is a tactical counter-trend rally. The combination of expansive fiscal and monetary policy will eventually put upward pressure on inflation and bond yields.
That said, there are a number of pockets of uncorrelated opportunities for investors, regardless of how long Treasury yields stay down.
The full post can be found here.
Saturday, April 24, 2021
A pause in the reflation trade?
Recently, a growing narrative in the market is arguing for a pause in the reflation trade for the following reasons:
- Both the cyclically sensitive copper/gold and base metal/gold ratios have moved sideways.
- The 10-year Treasury yield peaked out in March and it is now falling, which is an indication of the bond market's belief of a retreat in growth expectations.
- The Chinese stock market has tanked relative to global stocks, as measured by MSCI All-Country World Index (ACWI).

If these market signals are indeed pointing to a pause in growth expectations, then investors should be prepared for either a risk-off tone in the markets or some choppiness and consolidation in the months ahead.
The full post can be found here.
Monday, March 29, 2021
Turkey: Contrarian opportunity or value trap?
It has been a week since Recep Erdoğan`s decision to fire Turkey`s central-bank governor, Naci Agbal, for raising interest rates. Both Turkey`s stock market and currency, the Turkish lira (TRY), have shown some signs of stabilization after a dramatic drop last Monday. However, TRY weakened today but the fall is likely attributable to the fears of a margin call contagion despite a Bloomberg report that the new central bank governor's refused to commit to an interest cut.

Turkish central bank Governor Sahap Kavcioglu said markets shouldn’t take for granted that he’ll cut interest rates as soon as April, when he sets monetary policy for the first time since his surprise appointment.
“I do not approve a prejudiced approach to MPC decisions in April or the following months, that a rate cut will be delivered immediately,” Kavcioglu said in a written response to questions emailed by Bloomberg News, referring to monetary policy committee meeting next month.
“In the new period, we will continue to make our decisions with a corporate monetary policy perspective to ensure a permanent fall in inflation. In this respect, we will also monitor the effects of the policy steps taken so far,” Kavcioglu said.
From an equity perspective, the MSCI Turkey ETF (TUR) is oversold and it is testing a key relative support level.

Do Turkish stocks represent a contrarian buying opportunity or a value trap?
The full post can be found here.
Monday, November 16, 2020
Value picks and pans
I recently made a presentation at a virtual conference, and an audience member asked me to name some of my favorite value sectors. I had a few answers, but let me start with what I would avoid, namely financial stocks.


The full post can be found here.
Sunday, November 15, 2020
Still testing triple-top resistance
Preface: Explaining our market timing models
We maintain several market timing models, each with differing time horizons. The "Ultimate Market Timing Model" is a long-term market timing model based on the research outlined in our post, Building the ultimate market timing model. This model tends to generate only a handful of signals each decade.
The Trend Asset Allocation Model is an asset allocation model which applies trend following principles based on the inputs of global stock and commodity price. This model has a shorter time horizon and tends to turn over about 4-6 times a year. In essence, it seeks to answer the question, "Is the trend in the global economy expansion (bullish) or contraction (bearish)?"
My inner trader uses a trading model, which is a blend of price momentum (is the Trend Model becoming more bullish, or bearish?) and overbought/oversold extremes (don't buy if the trend is overbought, and vice versa). Subscribers receive real-time alerts of model changes, and a hypothetical trading record of the email alerts are updated weekly here. The hypothetical trading record of the trading model of the real-time alerts that began in March 2016 is shown below.

Update schedule: I generally update model readings on my site on weekends and tweet mid-week observations at @humblestudent. Subscribers receive real-time alerts of trading model changes, and a hypothetical trading record of those email alerts is shown here.
Subscribers can access the latest signal in real-time here.
The bulls test triple-top resistance

We maintain several market timing models, each with differing time horizons. The "Ultimate Market Timing Model" is a long-term market timing model based on the research outlined in our post, Building the ultimate market timing model. This model tends to generate only a handful of signals each decade.
The Trend Asset Allocation Model is an asset allocation model which applies trend following principles based on the inputs of global stock and commodity price. This model has a shorter time horizon and tends to turn over about 4-6 times a year. In essence, it seeks to answer the question, "Is the trend in the global economy expansion (bullish) or contraction (bearish)?"
My inner trader uses a trading model, which is a blend of price momentum (is the Trend Model becoming more bullish, or bearish?) and overbought/oversold extremes (don't buy if the trend is overbought, and vice versa). Subscribers receive real-time alerts of model changes, and a hypothetical trading record of the email alerts are updated weekly here. The hypothetical trading record of the trading model of the real-time alerts that began in March 2016 is shown below.

The latest signals of each model are as follows:
- Ultimate market timing model: Sell equities*
- Trend Model signal: Neutral*
- Trading model: Bullish*
Update schedule: I generally update model readings on my site on weekends and tweet mid-week observations at @humblestudent. Subscribers receive real-time alerts of trading model changes, and a hypothetical trading record of those email alerts is shown here.
Subscribers can access the latest signal in real-time here.
The bulls test triple-top resistance
Last week, I highlighted the possible formation of a rare Zweig Breadth Thrust (ZBT) buy signal coupled with an S&P 500 test at triple-top resistance. As it turns out, equity breadth was not strong enough to trigger the ZBT buy signal. Despite making a marginal new all-time high, the S&P 500 is still effectively testing triple-top resistance.

What's next?
The full post can be found here.
Tuesday, August 18, 2020
Risk and opportunity: No guts, no glory?
Risk takers are fond of the line, "No guts, no glory". With that in mind, I present three cases of risks, and possible opportunities.
The full post can be found here.
The full post can be found here.
Saturday, February 15, 2020
The guerrilla war against the PBOC
The enemy advances, we retreat
In the wake of the news of the coronavirus infection, the Chinese leadership went into overdrive and made it a Draghi-like "whatever it takes" moment to prevent panic and stabilize markets. When the stock markets opened after the Lunar New Year break, the authorities prohibited short sales, directed large shareholders not to sell their holdings, and the PBOC turned on their firehose of liquidity to support the stock market. Those steps largely succeeded. China's stock markets stabilized and recovered, and so too the markets of China's Asian trading partners.

However, there were signs that the market is unimpressed by the steps taken by Beijing to control the outbreak and limit its economic impact. Market participants were conducting a guerrilla campaign against the PBOC by using Mao Zedong's principles of war. The first principle is "When the enemy advances, we retreat."
Indeed, when the PBOC flooded the market with liquidity, stock prices went up. But that's not the entire story.
The full post can be found here.
In the wake of the news of the coronavirus infection, the Chinese leadership went into overdrive and made it a Draghi-like "whatever it takes" moment to prevent panic and stabilize markets. When the stock markets opened after the Lunar New Year break, the authorities prohibited short sales, directed large shareholders not to sell their holdings, and the PBOC turned on their firehose of liquidity to support the stock market. Those steps largely succeeded. China's stock markets stabilized and recovered, and so too the markets of China's Asian trading partners.

However, there were signs that the market is unimpressed by the steps taken by Beijing to control the outbreak and limit its economic impact. Market participants were conducting a guerrilla campaign against the PBOC by using Mao Zedong's principles of war. The first principle is "When the enemy advances, we retreat."
Indeed, when the PBOC flooded the market with liquidity, stock prices went up. But that's not the entire story.
The full post can be found here.
Monday, March 4, 2019
An EM warning
For several months, the BAML Fund Manager Survey shows that global institutions have been piling into emerging market equities.

The purchase of EM equities has been a smart move, as they have been leading the market upwards. However, their time in a leadership role may be coming to an end owing to a series of disappointments. EM started to top out against the MSCI All-Country World Index (ACWI) in early February, and relative performance has been rolling over ever since.

The full post can be found here.

The purchase of EM equities has been a smart move, as they have been leading the market upwards. However, their time in a leadership role may be coming to an end owing to a series of disappointments. EM started to top out against the MSCI All-Country World Index (ACWI) in early February, and relative performance has been rolling over ever since.

The full post can be found here.
Tuesday, January 22, 2019
An opportunity in EM stocks?
The latest BAML Fund Manager Survey shows that institutional managers have been piling into emerging market equities while avoiding the other major developed market regions.

Indeed, there is good reasoning behind the bullish stampede. Callum Thomas showed a series of charts supportive of the EM equity bull case. For one, developed market M-PMIs have been falling while EM PMIs have been mostly steady.

On a relative basis, EM/DM equity performance are showing signs of a long-term double bottom consistent with the double bottom pattern of the last cycle.

The cyclical to defensive stock ratio in EM appear to be bottoming. This ratio led the downturn, could it be signaling a risk-on revival?

Should you follow suit into EM stocks?
The full post can be found at our new site here.
A Special Announcement
We told you so. We told you the market was going down.
Here is the track of Humble Student of the Markets, where we are neither perma-bulls nor perma-bears. Most recently, we have been correctly bullish since the correction of 2015, and turned cautious in August 2018 (see Market top ahead? My inner investor turns cautious, August 5, 2018).

We were also timely at the 2009 bottom. We issued a call to buy beaten up low-priced stocks with high insider buying a week before the ultimate bottom (see Phoenix rising? February 24, 2009).

The out-of-sample record of our model trading portfolio in 2018 was up 42.9%. For more details, see our weekly updates here.
The recent market volatility has brought a flood of new subscribers, and we are announcing a price increase, and a number of other changes in order to better control the growth of our community. However, all subscribers will be grandfathered at their old prices.
The following changes will occur as of March 1, 2019:

Indeed, there is good reasoning behind the bullish stampede. Callum Thomas showed a series of charts supportive of the EM equity bull case. For one, developed market M-PMIs have been falling while EM PMIs have been mostly steady.

On a relative basis, EM/DM equity performance are showing signs of a long-term double bottom consistent with the double bottom pattern of the last cycle.

The cyclical to defensive stock ratio in EM appear to be bottoming. This ratio led the downturn, could it be signaling a risk-on revival?

Should you follow suit into EM stocks?
The full post can be found at our new site here.
A Special Announcement
We told you so. We told you the market was going down.
Here is the track of Humble Student of the Markets, where we are neither perma-bulls nor perma-bears. Most recently, we have been correctly bullish since the correction of 2015, and turned cautious in August 2018 (see Market top ahead? My inner investor turns cautious, August 5, 2018).

We were also timely at the 2009 bottom. We issued a call to buy beaten up low-priced stocks with high insider buying a week before the ultimate bottom (see Phoenix rising? February 24, 2009).

The out-of-sample record of our model trading portfolio in 2018 was up 42.9%. For more details, see our weekly updates here.
The recent market volatility has brought a flood of new subscribers, and we are announcing a price increase, and a number of other changes in order to better control the growth of our community. However, all subscribers will be grandfathered at their old prices.
The following changes will occur as of March 1, 2019:
- The annual subscription price will rise from US$249.99 to US$356 per year.
- The monthly subscription price will rise from US$24.99 to US$35.60 per month.
- The 24-hour subscription will no longer be offered.
- The embargo period for free content will change from two weeks to four weeks.
Sunday, November 18, 2018
What is Mr. Market saying about Powell's "global slowdown"?
Preface: Explaining our market timing models
We maintain several market timing models, each with differing time horizons. The "Ultimate Market Timing Model" is a long-term market timing model based on the research outlined in our post, Building the ultimate market timing model. This model tends to generate only a handful of signals each decade.
The Trend Model is an asset allocation model which applies trend following principles based on the inputs of global stock and commodity price. This model has a shorter time horizon and tends to turn over about 4-6 times a year. In essence, it seeks to answer the question, "Is the trend in the global economy expansion (bullish) or contraction (bearish)?"

My inner trader uses the trading component of the Trend Model to look for changes in the direction of the main Trend Model signal. A bullish Trend Model signal that gets less bullish is a trading "sell" signal. Conversely, a bearish Trend Model signal that gets less bearish is a trading "buy" signal. The history of actual out-of-sample (not backtested) signals of the trading model are shown by the arrows in the chart below. The turnover rate of the trading model is high, and it has varied between 150% to 200% per month.
Subscribers receive real-time alerts of model changes, and a hypothetical trading record of the those email alerts are updated weekly here. The hypothetical trading record of the trading model of the real-time alerts that began in March 2016 is shown below.

The latest signals of each model are as follows:
Update schedule: I generally update model readings on my site on weekends and tweet mid-week observations at @humblestudent. Subscribers receive real-time alerts of trading model changes, and a hypothetical trading record of the those email alerts is shown here.
Global slowdown?
In a speech last week, Fed chair Jay Powell stated that while the American economy was performing well, he raised concerns about the effects of a global slowdown. His remarks highlights the importance of non-US markets, and it would be useful to take a brief tour around the world to see what Mr. Market thinks of the "global slowdown".
A comparison of global equity market (top panel) and US equities (middle panel) shows some differences and similarities.

We can make a number of observations from this chart:
The full post can be found at our new site here.
We maintain several market timing models, each with differing time horizons. The "Ultimate Market Timing Model" is a long-term market timing model based on the research outlined in our post, Building the ultimate market timing model. This model tends to generate only a handful of signals each decade.
The Trend Model is an asset allocation model which applies trend following principles based on the inputs of global stock and commodity price. This model has a shorter time horizon and tends to turn over about 4-6 times a year. In essence, it seeks to answer the question, "Is the trend in the global economy expansion (bullish) or contraction (bearish)?"

My inner trader uses the trading component of the Trend Model to look for changes in the direction of the main Trend Model signal. A bullish Trend Model signal that gets less bullish is a trading "sell" signal. Conversely, a bearish Trend Model signal that gets less bearish is a trading "buy" signal. The history of actual out-of-sample (not backtested) signals of the trading model are shown by the arrows in the chart below. The turnover rate of the trading model is high, and it has varied between 150% to 200% per month.
Subscribers receive real-time alerts of model changes, and a hypothetical trading record of the those email alerts are updated weekly here. The hypothetical trading record of the trading model of the real-time alerts that began in March 2016 is shown below.

The latest signals of each model are as follows:
- Ultimate market timing model: Buy equities*
- Trend Model signal: Bearish*
- Trading model: Bearish*
Update schedule: I generally update model readings on my site on weekends and tweet mid-week observations at @humblestudent. Subscribers receive real-time alerts of trading model changes, and a hypothetical trading record of the those email alerts is shown here.
Global slowdown?
In a speech last week, Fed chair Jay Powell stated that while the American economy was performing well, he raised concerns about the effects of a global slowdown. His remarks highlights the importance of non-US markets, and it would be useful to take a brief tour around the world to see what Mr. Market thinks of the "global slowdown".
A comparison of global equity market (top panel) and US equities (middle panel) shows some differences and similarities.

We can make a number of observations from this chart:
- Both global and US equities are in downtrends, defined as each index trading below its 200 day moving average (dma), but US stocks are stronger as the SPX is only just below its 200 dma.
- Both indices are forming possible inverse head and shoulders formations which may resolve bullishly. As good technicians know, these patterns are not confirmed until the neckline breaks.
- One key difference stands out if upside breakouts were to occur. The measured upside target for global stocks is below the January all-time highs, while the measured target for the SPX is over 3000, which would represent a fresh high for that index.
- Market leadership may be pausing and waiting for direction. The bottom panel shows that for much of this year, US stocks have been outperforming global stocks, as measured by the MSCI All-Country World Index (ACWI), but relative performance of US, EAFE, and EM equities have flattened out since September.
The full post can be found at our new site here.
Wednesday, August 15, 2018
Three reasons to ignore the Turkish Apocalypse hype
Mid-week market update: Earlier in the week, Mark Hulbert wrote that "U.S. investors should see this Turkish crisis as a buying opportunity". Hulbert went on to cite the historical record of past currency crises:

I agree. In addition to Hulbert`s points, there are two other reasons why the Turkey Tantrum will blow over.
The full post can be found at our new site here.
And it’s not just 20-20 hindsight for me to point this out now, with a strong bull market under our belts. On the contrary, in a series of columns beginning in March 2010, I regularly pointed out that the stock market usually takes currency and sovereign debt crises very much in stride.
I based my confidence on how the stock market had reacted previously to other such crises over the prior two decades. The crises on which I focused were the 1994 Mexican peso devaluation and associated crisis; the Thai government debt crisis 1997 (which led to the term “Asian contagion”); the 1998 Russian ruble devaluation in August 1998 (which led to the bankruptcy of Long-Term Capital Management), and the 2001 Argentine government debt/currency crisis.
The accompanying chart shows how the U.S. stock market—on average—reacted to these four crises. For both data series, 100 represents the stock market’s level when those crises first broke onto the world financial scene. Notice that equities’ reaction over the four years following the Greek crisis was remarkably close to the average of its behavior in the wake of the previous crises.

I agree. In addition to Hulbert`s points, there are two other reasons why the Turkey Tantrum will blow over.
The full post can be found at our new site here.
Sunday, August 12, 2018
Two gifts from the market gods
Preface: Explaining our market timing models
We maintain several market timing models, each with differing time horizons. The "Ultimate Market Timing Model" is a long-term market timing model based on the research outlined in our post, Building the ultimate market timing model. This model tends to generate only a handful of signals each decade.
The Trend Model is an asset allocation model which applies trend following principles based on the inputs of global stock and commodity price. This model has a shorter time horizon and tends to turn over about 4-6 times a year. In essence, it seeks to answer the question, "Is the trend in the global economy expansion (bullish) or contraction (bearish)?"

My inner trader uses the trading component of the Trend Model to look for changes in the direction of the main Trend Model signal. A bullish Trend Model signal that gets less bullish is a trading "sell" signal. Conversely, a bearish Trend Model signal that gets less bearish is a trading "buy" signal. The history of actual out-of-sample (not backtested) signals of the trading model are shown by the arrows in the chart below. The turnover rate of the trading model is high, and it has varied between 150% to 200% per month.
Subscribers receive real-time alerts of model changes, and a hypothetical trading record of the those email alerts are updated weekly here. The hypothetical trading record of the trading model of the real-time alerts that began in March 2016 is shown below.

The latest signals of each model are as follows:
Update schedule: I generally update model readings on my site on weekends and tweet mid-week observations at @humblestudent. Subscribers receive real-time alerts of trading model changes, and a hypothetical trading record of the those email alerts is shown here.
More market warnings ahead
I received a lot of feedback from my post last week (see Major market top ahead: My inner investor turns cautious), mostly because it represented a major change in investment outlook. I would like to clarify a point that the post did not represent a sell signal for stocks, but the setup for a sell signal.
In the short run, the market gods have given investors two gifts. First, the evolution of the Turkish Tantrum provides investors a glimpse at what a real EM blow-up might look like in the future, especially if China were to undergo a debt crisis.
In addition, the path of least resistance for stock prices is still up for the next few weeks. Any rally therefore represents a second gift from the market gods. Investors can take the opportunity to lighten up their equity holdings in anticipation of long-term market weakness.
There have been plenty of warnings that US equities are topping out, starting with how monetary policy is affecting both Wall Street and Main Street. The latest Turkish inspired sell-off just provides another point of bearish pressure.
Even before Friday`s market blow-up, the fault lines were starkly revealed when the Deputy Prime Minister of Turkey tweeted a complaint about Fed policy.

In light of Friday's above consensus core CPI print, the Fed is likely to stay on their preset course of a quarter point rate hike every three months. Already, the Turkish lira crisis has sparked an upside breakout of the USD Index. If the breakout holds, it will spell trouble in other quarters. In addition to the pressure on other vulnerable EM currencies, a rising USD depresses the Chinese Yuan (CNY) and raise the specter of a currency war.

The full post can be found at our new site here.
We maintain several market timing models, each with differing time horizons. The "Ultimate Market Timing Model" is a long-term market timing model based on the research outlined in our post, Building the ultimate market timing model. This model tends to generate only a handful of signals each decade.
The Trend Model is an asset allocation model which applies trend following principles based on the inputs of global stock and commodity price. This model has a shorter time horizon and tends to turn over about 4-6 times a year. In essence, it seeks to answer the question, "Is the trend in the global economy expansion (bullish) or contraction (bearish)?"

My inner trader uses the trading component of the Trend Model to look for changes in the direction of the main Trend Model signal. A bullish Trend Model signal that gets less bullish is a trading "sell" signal. Conversely, a bearish Trend Model signal that gets less bearish is a trading "buy" signal. The history of actual out-of-sample (not backtested) signals of the trading model are shown by the arrows in the chart below. The turnover rate of the trading model is high, and it has varied between 150% to 200% per month.
Subscribers receive real-time alerts of model changes, and a hypothetical trading record of the those email alerts are updated weekly here. The hypothetical trading record of the trading model of the real-time alerts that began in March 2016 is shown below.

The latest signals of each model are as follows:
- Ultimate market timing model: Buy equities*
- Trend Model signal: Neutral*
- Trading model: Bullish*
Update schedule: I generally update model readings on my site on weekends and tweet mid-week observations at @humblestudent. Subscribers receive real-time alerts of trading model changes, and a hypothetical trading record of the those email alerts is shown here.
More market warnings ahead
I received a lot of feedback from my post last week (see Major market top ahead: My inner investor turns cautious), mostly because it represented a major change in investment outlook. I would like to clarify a point that the post did not represent a sell signal for stocks, but the setup for a sell signal.
In the short run, the market gods have given investors two gifts. First, the evolution of the Turkish Tantrum provides investors a glimpse at what a real EM blow-up might look like in the future, especially if China were to undergo a debt crisis.
In addition, the path of least resistance for stock prices is still up for the next few weeks. Any rally therefore represents a second gift from the market gods. Investors can take the opportunity to lighten up their equity holdings in anticipation of long-term market weakness.
There have been plenty of warnings that US equities are topping out, starting with how monetary policy is affecting both Wall Street and Main Street. The latest Turkish inspired sell-off just provides another point of bearish pressure.
Even before Friday`s market blow-up, the fault lines were starkly revealed when the Deputy Prime Minister of Turkey tweeted a complaint about Fed policy.

In light of Friday's above consensus core CPI print, the Fed is likely to stay on their preset course of a quarter point rate hike every three months. Already, the Turkish lira crisis has sparked an upside breakout of the USD Index. If the breakout holds, it will spell trouble in other quarters. In addition to the pressure on other vulnerable EM currencies, a rising USD depresses the Chinese Yuan (CNY) and raise the specter of a currency war.

The full post can be found at our new site here.
Thursday, December 10, 2015
What's wrong with South Africa?
The study of emerging markets is a useful exercise in examining our assumptions about economies and markets because they sometimes operate by different rules than developed economies. As an example, Bloomberg reported today that the markets are freaking out over the firing of the finance minister:

What's wrong with South Africa?
The complete post at our new site here.
South African markets were thrown into turmoil after President Jacob Zuma fired the finance minister, strengthening his grip on power amid differences over government spending.As the chart below shows, South African assets are indeed tanking. The top panel shows the South African ETF (EZA), which is priced in USD. The bottom panel shows the relative performance of the South African Rand relative to the Aussie Dollar, which is another commodity currency.
The rand weakened for a sixth day in the longest streak of losses since November 2013 and bond prices dropped the most on record, pushing yields to their highest levels since July 2008. The country’s bank stocks tumbled the most in more than 14 years following the dismissal late on Wednesday of Finance Minister Nhlanhla Nene. The cost of insuring South African debt against default rose to the highest in more than 6 1/2 years.

What's wrong with South Africa?
The complete post at our new site here.
Monday, September 28, 2015
Poised for a successful re-test of the August lows
I reported on the weekend that my inner trader got caught in a "low conviction long trade" (see A choppy bottom). The sell-off on Monday signaled that the market seems poised for a test of the August lows and possibly the October 2014 lows.
Despite the reversal, my inner trader decided to take his lumps and stay long. Based on my latest estimates of the analytics from IndexIndicators, the market is highly oversold on a 1-3 day time frame:

...and also on a 1-2 week time frame:

Moreover, my Trifecta Bottom Model flashed an "Exacta" buy signal and it is very close to flashing a full Trifecta signal. All that means, of course, is that the market is very oversold, - but then you knew that.

The caveat, of course, is that August experience showed us that oversold markets can get even more oversold.
A critical technical test
Most of the bearish chartists I read on social media are positively giddy right now, but Northman Trader offered a more balanced and nuanced take on the technical condition of the US equity market. He has been watching the 5 month EMA and 20 month MA and believes that the market is at a critical technical junction:

He outlined the dire consequences of a cross-over:

Standing in the way is positive seasonality for the markets:

Looking for the rally catalyst
I don't pretend to know what the market will do in the couple of days, other than to observe that it is highly oversold and poised to test the August lows. If we were to see a support violation in the next two days, we are likely to see a positive divergence, or non-confirmation of the lows, on the daily RSI14 indicator.

Sometimes being contrarian is highly painful and people like to tell you that you are wrong. I turned cautious on the market early this year and, after much criticism, wrote a post detailing my reasons on May 18, 2015 (see Why I am bearish (and what would change my mind)).

It seems that I am undergoing a mirror image of that experience now. Today, sentiment is showing a crowded short across many measures and it would only take a positive catalyst for the market to melt up. But what might that catalyst be?
The answer might lie in a cyclical upturn. A clue came from David Rosenberg who pointed out that the American consumer could ride to the rescue yet once again (via Business Insider):

A glance at the relative performance of Consumer Discretionary stocks show that they are on fire. Homebuilders are surging on a relative basis. Does this look like the signs of a slowing US economy?

As for China, I have pointed out before that stress levels in the Chinese economy are falling. In particular, Chinese property prices in Tier 1 and 2 cities are turning up again. Don`t forget that most of the leverage in their financial system is in real estate (via Callum Thomas):

Should China stabilize, we may see commodity prices bottom and start to turn around - and that would also alleviate much of the angst in the emerging market economies. Jim Paulsen of Wells Capital Management recently postulated such a turnaround and indicated that commodity prices have historically slowed in mid-cycle in the past:
I remain wary of pressing any short positions right now. Instead, I would likely be watching for signs of a capitulation low to add to my long posiition.
Despite the reversal, my inner trader decided to take his lumps and stay long. Based on my latest estimates of the analytics from IndexIndicators, the market is highly oversold on a 1-3 day time frame:

...and also on a 1-2 week time frame:

Moreover, my Trifecta Bottom Model flashed an "Exacta" buy signal and it is very close to flashing a full Trifecta signal. All that means, of course, is that the market is very oversold, - but then you knew that.

The caveat, of course, is that August experience showed us that oversold markets can get even more oversold.
A critical technical test
Most of the bearish chartists I read on social media are positively giddy right now, but Northman Trader offered a more balanced and nuanced take on the technical condition of the US equity market. He has been watching the 5 month EMA and 20 month MA and believes that the market is at a critical technical junction:
Let me highlight the key issue. Look at this monthly $SPX chart below. For many months we have been following two specific moving averages the 5EMA and 8MA. Every month, like clockwork, these 2 MA’s have acted as critical support. This support was decidedly broken with the August flash crash. In October 2014 the break was saved into month end. Unless something magical happens this coming week it appears these 2 MAs will not be recaptured by month end. However, that’s not quite the main critical issue.
More relevant is what happens whether the shorter term 5EMA and longer term 20 MA cross over each other:

He outlined the dire consequences of a cross-over:
The consequences of a crossover are pretty clear: As we’ve outlined previously the larger macro fibs indicate a market retrace to the 38.2% Fib which coincides with the 2007 highs. Pretty solid confluence.Incidentally, we have seen the cross-over as of the close today, but the bears have to maintain that condition until month-end, which is two days away.

Standing in the way is positive seasonality for the markets:
In my mind the October 2014 lows need to be broken in the next 3 weeks or it’s game over for bears it seems. Lest not forget that in 2014 the correction ended in the middle of October as well and managed to produce a massive rally through year end...
As we outlined last week bulls need a 1998 like save or markets face a structural break targeting 2007 highs.
Curiously the recent action in price continues to show a similar structure to 1998 so a spike into month end before renewed selling into October would not surprise:

Incidentally, when did the 1998 correction bottom? October 8.He concluded (emphasis added):
When did the 2011 correction bottom? October 4.
When did 2014 correction bottom? October 15.
Cute.
So bears. To re-iterate: The monthly MAs need to be crossed and the neckline needs to be broken and STAY broken below October 2014 lows.
And bulls. You absolutely need an October magic show and get back above the daily 200MA (currently 2065) or the jig is up for a long time to come.
We will know who the winner is by the end of October at the latest.
Looking for the rally catalyst
I don't pretend to know what the market will do in the couple of days, other than to observe that it is highly oversold and poised to test the August lows. If we were to see a support violation in the next two days, we are likely to see a positive divergence, or non-confirmation of the lows, on the daily RSI14 indicator.

Sometimes being contrarian is highly painful and people like to tell you that you are wrong. I turned cautious on the market early this year and, after much criticism, wrote a post detailing my reasons on May 18, 2015 (see Why I am bearish (and what would change my mind)).

It seems that I am undergoing a mirror image of that experience now. Today, sentiment is showing a crowded short across many measures and it would only take a positive catalyst for the market to melt up. But what might that catalyst be?
The answer might lie in a cyclical upturn. A clue came from David Rosenberg who pointed out that the American consumer could ride to the rescue yet once again (via Business Insider):
Yes, we hear constantly about how China's share of global GDP has risen inexorably over the decades, but that obscures a huge point.
China's contribution to global producers has been in the basic material sphere as the country absorbed so much of the world's resources in its quest to build mega cities and build a world-class industrial infrastructure, but that is about it.
China, for years, racked up massive trade surpluses as these mega cities became home to low-cost export regions.
The reliable buyer of last resort, outside resources, was never China. It was and continues to be the United States.
The American consumer, if it were a country of its own, would be the largest economic base in the world. That's right — even bigger than China's entire economy.

A glance at the relative performance of Consumer Discretionary stocks show that they are on fire. Homebuilders are surging on a relative basis. Does this look like the signs of a slowing US economy?

As for China, I have pointed out before that stress levels in the Chinese economy are falling. In particular, Chinese property prices in Tier 1 and 2 cities are turning up again. Don`t forget that most of the leverage in their financial system is in real estate (via Callum Thomas):

Should China stabilize, we may see commodity prices bottom and start to turn around - and that would also alleviate much of the angst in the emerging market economies. Jim Paulsen of Wells Capital Management recently postulated such a turnaround and indicated that commodity prices have historically slowed in mid-cycle in the past:
As we examined in an earlier research note (see the Economic and Market Perspective from August 25, 2015), a significant collapse in commodity prices during the middle of an economic recovery is actually quite common. Chart 1 shows the S&P GSCI Spot Commodity Price Index since 1970. The collapse in commodity prices since last summer is similar to past recoveries and like then, it does not suggest economic growth is about to slow.Right now, market psychology is overwhelmingly negative and I have no idea what would turn it around. However, with an oversold market with traders at a crowded short, should evidence emerge of a nascent cyclical rebound, stock prices would respond by melting up.
In three of the last four recoveries (i.e., the late-1970s, 1980s and 1990s recoveries), commodity prices suffered a severe decline “during” an ongoing economic recovery. In each of these cases, the economic recovery persisted well beyond the bottom in commodity prices. Indeed, in the past, once commodity prices bottomed, the pace of economic growth accelerated and the recovery did not end until commodity prices had substantially recovered. For example, in the late-1970s recovery, commodity prices bottomed in July 1977 and the recovery did not end until January 1980. Similarly, commodity prices bottomed in July 1986 but the economic recovery continued until July 1990. Finally, commodity prices bottomed in early 1999 but the recovery did not peak until March 2001. As shown, a significant decline in commodity prices usually points to stronger rather than weaker future economic growth. Moreover, once commodity prices do finally bottom, they have typically risen throughout the balance of the economic recovery.
Although most believe oil prices (and overall commodity prices) are continuing to collapse, chart 2 suggest they have been in a bottoming process since early this year. While the spot price of WTI crude oil did collapse last year, it is currently about $45, a level it first reached in mid-January. We suspect the commodity markets are about to embark on a multi-year advance which will likely alter leadership in the economy and in the stock market.
I remain wary of pressing any short positions right now. Instead, I would likely be watching for signs of a capitulation low to add to my long posiition.
Wednesday, February 18, 2015
The key tail-risk that the FOMC missed (and you should pay attention to)
The release of the latest FOMC minutes generated much reaction. I had been watching for their discussion of non-US risks and found their views rather disappointing. The Fed was primarily focused on first order effects of risks from Europe, China, Greece and so on:
I believe that the FOMC may have missed a key tail-risk of the consequences of US monetary policy. Here is their discussion of tail-risk, or "potential risks to financial stability" in the FOMC minutes. Sure, liquidity risk in the bond market is something to keep an eye on, as bond mutual fund and ETF investors could all try to all head for the exits at the same time (emphasis added):
What about the $9 trillion in offshore USD loans?
Bloomberg featured a very different kind of risk when it asked about the $9 trillion in offshore USD paper sloshing around the global financial system (emphasis added):

As the chart shows, EM external corporate debt has skyrocketed over the years. What about the liquidity concerns voiced by FOMC staff over mass mutual fund redemptions, wouldn't an EM bond market rout be even worse?

With commodity prices in freefall, what happens next? Izabella Kaminska at FT Alphaville had some revealing analysis. First, she pointed to the BIS study:
Vulnerable EM
The current environment leaves a number of EM economies highly vulnerable to the triple whammy of a strong USD, rising interest rates and worsening USD liquidity and falling export earnings because of lower commodity prices. The chart below shows the tight correlation the EM equities (EEM) have had with the USD and industrial metal prices. EEM is now experiencing a negative divergence with these indicators, which leaves this asset class vulnerable to more price weakness.

To be sure, not all EM economies are exposed the same way to falling commodity prices. Benn Steil and Dinah Walker at CFR analyzed the level of sensitivity of EM economies to US rate hikes, based on the Taper Tantrum episode:

They concluded:
So far, neither the EM bond markets nor equity markets have been spooked by the prospect of Fed tightness. Nevertheless, I was surprised by the tone of the FOMC minutes as the Fed does not appear to have considered this second-order effect tail-risk to the global financial system.
In their discussion of the foreign economic outlook, participants noted that a number of developments over the intermeeting period had likely reduced the risks to U.S. growth. Accommodative policy actions announced by a number of foreign central banks had likely strengthened the outlook abroad. The decline in energy prices was also seen as potentially exerting a stronger-than-anticipated positive effect on growth in the domestic economy and abroad. However, the increase in the foreign exchange value of the dollar was expected to be a persistent source of restraint on U.S. net exports, and a few participants pointed to the risk that the dollar could appreciate further. In addition, the slowdown of growth in China was noted as a factor restraining economic expansion in a number of countries, and several continuing risks to the international economic outlook were cited, including global disinflationary pressure, tensions in the Middle East and Ukraine, and financial uncertainty in Greece.The conclusion was that risks were not overly excessive:
Overall, the risks to the outlook for U.S. economic activity and the labor market were seen as nearly balanced.Yeah, OK...
I believe that the FOMC may have missed a key tail-risk of the consequences of US monetary policy. Here is their discussion of tail-risk, or "potential risks to financial stability" in the FOMC minutes. Sure, liquidity risk in the bond market is something to keep an eye on, as bond mutual fund and ETF investors could all try to all head for the exits at the same time (emphasis added):
The staff provided its latest report on potential risks to financial stability. Relatively high levels of capital and liquidity in the banking sector, moderate levels of maturity transformation in the financial sector, and a relatively subdued pace of borrowing by the nonfinancial sector continued to be seen as important factors limiting the vulnerability of the financial system to adverse shocks. However, the staff report noted valuation pressures in some asset markets. Such pressures were most notable in corporate debt markets, despite some easing in recent months. In addition, valuation pressures appear to be building in the CRE sector, as indicated by rising prices and the easing in lending standards on CRE loans. Finally, the increased role of bond and loan mutual funds, in conjunction with other factors, may have increased the risk that liquidity pressures could emerge in related markets if investor appetite for such assets wanes. The effects on the largest banking firms of the sharp decline in oil prices and developments in foreign exchange markets appeared limited, although other institutions with more concentrated exposures could face strains if oil prices remain at current levels for a prolonged period.There is something else that the Fed seems to have missed.
What about the $9 trillion in offshore USD loans?
Bloomberg featured a very different kind of risk when it asked about the $9 trillion in offshore USD paper sloshing around the global financial system (emphasis added):
When Group of 20 finance ministers this week urged the Federal Reserve to “minimize negative spillovers” from potential interest-rate increases, they omitted a key figure: $9 trillion.There is no doubt that the Fed will tighten, it's just a question of when. With other major global central banks firmly in easing mode, rising US rates will put upward pressure on the USD in FX markets. The key question is how foreign borrowers of USD, which are mainly EM countries and companies, will handle the stress:
That’s the amount owed in dollars by non-bank borrowers outside the U.S., up 50 percent since the financial crisis, according to the Bank for International Settlements. Should the Fed raise interest rates as anticipated this year for the first time since 2006, higher borrowing costs for companies and governments, along with a stronger greenback, may add risks to an already-weak global recovery.
The dollar debt is just one example of how the Fed’s tightening would ripple through the world economy. From the housing markets in Canada and Hong Kong to capital flows into and out of China and Turkey, the question isn’t whether there will be spillovers -- it’s how big they will be, and where they will hit the hardest.
A study on dollar-denominated debt by the BIS in Basel, Switzerland, found that overseas borrowers increased issuance of dollar liabilities more in countries where interest rates were higher than U.S. yields. With American yields at historic lows for much of the last several years, the differentials provided a strong incentive to borrow in dollars instead of local currencies.In a recent article, the FT warned about the explosion in EM corporate debt, much of which was issued by corporations based in EM resource-based economies, as well as China (emphasis added):
China accounts for the biggest share of borrowings, amounting to $1.1 trillion, while the stock of dollar credit in Brazil totals more than $300 billion, according to the BIS report.
As U.S. interest rates go up, it would become more expensive to borrow dollars. A stronger greenback means a company or government needs even more local currency to repay debt if it lacks revenues in dollars.
A decade ago, the market for EM hard currency corporate bonds hardly existed. Today, it is bigger than the US high-yield corporate bond market, an asset class familiar to investors for decades, and more than four times the size of Europe’s high-yield bond market.
What has driven such extraordinary growth? In just a few years before the global financial crisis of 2008-09, emerging markets won over the world’s investors. In 2001, Goldman Sachs identified the Bric economies — Brazil, Russia, India and China — as the new engines of global growth. Chinese demand drove a commodity boom that helped billions of people rise out of poverty and into the consuming classes.
After the crisis, the developed world’s expansionary monetary policies kept the party going, pushing cheap credit to EM consumers and sending ever more foreign money into EM assets. Emerging companies, many able to tap overseas markets for the first time, embarked on a borrowing spree. Yield-hungry foreign investors were happy to help.
David Spegel, global head of EM sovereign and corporate bond strategy at BNP Paribas, has been following hard currency EM corporate bonds since 1994. His figures show that the value of such bonds in the market has grown from $107bn then to more than $2tn today.
But with Brazil’s economy imploding, China slowing and dark shadows over markets from Venezuela to Russia and Ukraine, some analysts worry that the party has gone on too long.
Stuart Oakley, global head of EM foreign exchange trading at Nomura in London, points to how easily things could go wrong. “It is entirely possible that we could see a default by a big, emerging market commodity exporting corporate,” he says.
“In that scenario you would get people redeeming money from big EM asset managers, bids for the bonds from banks would dry up, there would be sharp price drops on those and all associated assets and a sell-off across this or another asset class.”
As the chart shows, EM external corporate debt has skyrocketed over the years. What about the liquidity concerns voiced by FOMC staff over mass mutual fund redemptions, wouldn't an EM bond market rout be even worse?
With commodity prices in freefall, what happens next? Izabella Kaminska at FT Alphaville had some revealing analysis. First, she pointed to the BIS study:
Shifting to data for the end of 2013, only $2.3 trillion ($2.1 trillion) out of the $8.6 ($7.6 trillion) in dollar claims on non-banks (non-financials) outside the US were held in the US (Graph 3, middle two arrows). In other words, offshore holdings represent almost three-quarters of the dollar credit extended to non-financial borrowers outside the US.Her key point is that all this USD liquidity is offshore and therefore outside the reach of Federal Reserve regulation. So much for all those ”macro-prudential policies” that the Fed is relying on to cushion the impact of the next financial crisis:
But the key point the authors were making, which continues to be ignored by the world and his dog, is that the primary source for most of the world’s external dollar debt has been non-US banks operating outside the US, which have trillions of dollars of deposits for swapping into other currencies for and non-US asset managers sitting on similarly large levels of dollar assets.She concluded that the Fed's QE program created a multiplier effect on offshore USD assets and it is now at risk of reversal (my emphasis):
This, in their opinion, totally undermines the popular theory that the Fed’s large-scale asset purchases inject liquidity into banks in the US, which they in turn extend to offshore banks, which lend the dollars further.
This, de facto implies that the vast majority of the external dollar debt position is funded by an independent dollar float that sits separate to the US dollar system, but which depends on trade flows from the true US dollar system to be funded.
To us, that suggests the more QE the US did without issuing a commensurate amount of its own debt because of, you know, debt ceiling, the more it encouraged the external US dollar float to be relent multiple times (fractional reserve style) abroad before finally being soaked up by the sort of SWFs that would reinvest that float in US domestic assets.In a diffrent post, Kaminska highlighted a Citi research report which postulated a collapse in USD offshore liquidity because oil exporting countries lack the petrodollars to recycle back into the USD credit markets. (And this was written in November 2014, before the collapse in oil prices, emphasis added):
But we’re now at a point where, unless all those external debtors have an organic way to keep dollars flowing into their coffers — i.e. without dependence on financing from non-US dollar pool sources — the value of all those loans, as well as the external US dollar pool itself, could quite abruptly and violent collapse in value.
One somewhat novel theory is that sharply lower crude prices might have something to do with the change in the technicals. It seems plausible to us that lower crude prices have led to a slower rate of petrodollar accumulation by oil-exporting countries and less recycling of those funds back into global financial markets—amounting to a non-negligible retraction in liquidity.While the drop in oil prices amount to a redistribution of wealth from oil producers to consumers, Citi believes that the net effect is not neutral when it comes to the USD credit markets:
There’s little doubt the petrodollar bid for fixed income securities has been tremendous during the last five years. The FX reserves of OPEC members have increased nearly 60% since 2009 to more than $1.3tn—a figure that would surpass $2tn if certain non-OPEC members, like Russia, were included. Likewise, sovereign wealth funds that are primarily funded by crude sales have increased nearly 80% over the same time period to more than $4tn (see figure). Taken together, the AUM of petrodollar investors has increased by $2.5tn in the space of 5 years, or roughly $500bn per year.
While that’s certainly the case, what matters is how the savings from lower crude oil prices end up getting invested relative to the investments made by sovereign wealth funds and FX reserve managers. And on that score, we suspect that petrodollar investors generally make conservative investments that are inherently fixed income-friendly, while the savings from lower gasoline prices tend to grow the top line revenue of consumer-oriented companies and the margins of those companies with significant transportation costs. As such, forsaken petrodollars rarely find their way back into fixed income markets.
Vulnerable EM
The current environment leaves a number of EM economies highly vulnerable to the triple whammy of a strong USD, rising interest rates and worsening USD liquidity and falling export earnings because of lower commodity prices. The chart below shows the tight correlation the EM equities (EEM) have had with the USD and industrial metal prices. EEM is now experiencing a negative divergence with these indicators, which leaves this asset class vulnerable to more price weakness.
To be sure, not all EM economies are exposed the same way to falling commodity prices. Benn Steil and Dinah Walker at CFR analyzed the level of sensitivity of EM economies to US rate hikes, based on the Taper Tantrum episode:
They concluded:
As the bottom figure suggests, many of the same countries are likely to be in the firing line – in particular, Ukraine, Turkey, South Africa, Peru, Brazil, Indonesia, Colombia, Mexico, and India. Of these, only Ukraine has seen a significant improvement in its current account deficit, which has fallen from a whopping 9.2% to 2.5%. Poland and Romania have moderate (2%) but higher deficits, and could receive a larger jolt this time around. Only Thailand has moved into surplus, and looks likely to be spared.In addition, I am concerned about the possible effects on China. The BIS study estimated total USD offshore loans to China, which includes government and corporate borrowers, to be $1.1 trillion - that`s not an insignificant amount.
So far, neither the EM bond markets nor equity markets have been spooked by the prospect of Fed tightness. Nevertheless, I was surprised by the tone of the FOMC minutes as the Fed does not appear to have considered this second-order effect tail-risk to the global financial system.
Saturday, October 18, 2014
A "smarter" way of reaching for yield
In general, I am not in favor of reaching for yield as the practice can entail a high degree of risk that income oriented investors cannot tolerate. I do understand, however, the dilemma facing such investors who need a regular stream of income.
For those who are forced into stretching for yield, buying emerging market bonds may mitigate some of the risks involved.
HY bonds a crowded long compared to EM bonds
The latest BoAML Fund Manager Survey shows that many managers believe that US high yield, or junk bonds, are getting to be a crowded long. On the other hand, emerging market bonds, which carry similar levels of risk, are not. So if you're going to take extra risk and reach for yield, EM bonds may be a better alternative than US HY.

Falling USD = EM currency bullish
Moreover, the survey indicates that US Dollar is a crowded long whose price seems to be in the process of reversing itself (see my recent posts Overbought USD = Commodities poised to rally? and Get ready for the resource rally). The chart below of the weekly USD Index finally moved off its overbought RSI reading, which historically has signaled a decline. Such a decline should be bullish for EM currencies.

EM vs. HY bond relative returns
The top panel of chart below shows the relative performance of EMB, the EM bond ETF, against HYG, the US HY bond ETF.

However, the duration of the EMB and HYG are different and buying one and selling the other involves an interest rate sensitivity bet as well as a bet on the relative credit quality as well as a bet on the USD (see my post Returning to high school, investment style for an explanation of duration).
Investors who want to keep a risk-adjusted yield maximization strategy simple can just buy EMB. A more sophisticated strategy might be to buy EMB and short HYG, but that would involve taking on interest rate risk. An interest rate neutral strategy would be to buy long EMB/short IEF pair and then short the HYG/IEI pair (long EMB, IEI, short HYG, IEF).
In any case, investors should be advised that reaching for yield can be highly speculative and these strategies are on the higher risk end of the investment spectrum. Nevertheless, I believe that, on a risk-adjusted basis, EM bonds might be a better way of reaching for yield in the current environment for those who can accept the risks involved.
For those who are forced into stretching for yield, buying emerging market bonds may mitigate some of the risks involved.
HY bonds a crowded long compared to EM bonds
The latest BoAML Fund Manager Survey shows that many managers believe that US high yield, or junk bonds, are getting to be a crowded long. On the other hand, emerging market bonds, which carry similar levels of risk, are not. So if you're going to take extra risk and reach for yield, EM bonds may be a better alternative than US HY.
Falling USD = EM currency bullish
Moreover, the survey indicates that US Dollar is a crowded long whose price seems to be in the process of reversing itself (see my recent posts Overbought USD = Commodities poised to rally? and Get ready for the resource rally). The chart below of the weekly USD Index finally moved off its overbought RSI reading, which historically has signaled a decline. Such a decline should be bullish for EM currencies.
EM vs. HY bond relative returns
The top panel of chart below shows the relative performance of EMB, the EM bond ETF, against HYG, the US HY bond ETF.
However, the duration of the EMB and HYG are different and buying one and selling the other involves an interest rate sensitivity bet as well as a bet on the relative credit quality as well as a bet on the USD (see my post Returning to high school, investment style for an explanation of duration).
Investors who want to keep a risk-adjusted yield maximization strategy simple can just buy EMB. A more sophisticated strategy might be to buy EMB and short HYG, but that would involve taking on interest rate risk. An interest rate neutral strategy would be to buy long EMB/short IEF pair and then short the HYG/IEI pair (long EMB, IEI, short HYG, IEF).
In any case, investors should be advised that reaching for yield can be highly speculative and these strategies are on the higher risk end of the investment spectrum. Nevertheless, I believe that, on a risk-adjusted basis, EM bonds might be a better way of reaching for yield in the current environment for those who can accept the risks involved.
Sunday, April 27, 2014
Should you sell in May?
The technical warning signs of equity weakness are clear to see. For the past several weeks, I have been voicing technical concerns about the stock market. This year seems to be a market where the adage of ”Sell in May and go away” is applicable. What puzzles me is the lack of a fundamental trigger for the decline.
Risk appetite is falling
In early April, I wrote about risk appetite rolling over (see Bears 2 Bulls 1 and A case of risk exhaustion?). My Risk Appetite Index, which consists of an equally-weighted long position in the NASDAQ 100 and Russell 2000 (high beta risk-on index) minus an equally weighted short position in the defensive sectors of Consumer Staples, Telecom and Utilities (low beta risk-off index), continues to decline. The chart below shows that the index also displayed similar behavior (trend line breaches and general weakness) ahead of the market corrections in 2011 and 2012.

Rising volatility
Underlying the weakness of the risk appetite index is a change in sector leadership from the high-beta sectors like Tech, Consumer Discretionary and Financials to defensive sectors like Utilities and Consumer Staples (see Interpreting a possible volatility regime shift). As well, I highlighted a possible regime shift where equity volatility appears to be headed higher. As knowledgeable readers know, volatility is inversely correlated with stock prices.

Deteriorating internals
What has puzzled me is the robustness of the Advance-Decline Line, which has continued to make new highs as these signs of market weaknesses appeared. While the weakness in the A-D Line can warn of major bear markets, it is less effective in spotting corrective action as it failed to flash warning signs in the market declines of 2011 and 2012.
The chart below tells the story. The top panel is the SP 1500 A-D Line, the second the % of stocks in the SPX above their 50 day moving averages, the third % of stocks in the SPX with point and figure buy signals and the four panel the SPX. In the decline of 2011, which was sparked by the combination of worries over a eurozone debt crisis and political impasse in Washington, the A-D Line did breach an uptrend line, but rallied to make a new high shortly after. The shallow correction of 2012 was also accompanied by a breach in the A-D Line uptrend, but the breach did not provide any advance warning of the decline, which was similar to the 2011 experience.

The combination of the % of stocks above their 50 dma and % of stocks with point and figure buy signals can provide some warnings of weakness, but these indicators are somewhat iffy as well. The condition of the % of stocks above their 50 dma is less than 60% (currently 54%) and % of stocks with point and figure buy signals is less than 70% (currently 68%) has been present in past corrective periods. These two indicators flashed a warning sign when the market weakened in February, but that was a false signal as a major correction did not follow.
Todd Harrison: Smart money is selling
In addition, Todd Harrison pointed out that the so-called Smart Money Flow Index is ominously bearish. The SMFI is defined in the following way:
The Smart Money Flow Index (SMFI) is calculated by taking the price of the Dow Jones Industrial Average at 10 a.m. on any given day, subtracting it from the previous day’s close, and adding it to the next day’s closing price. The first 30 minutes represent “emotional buying,” driven by greed and fear of the crowd; smart money typically waits until the end of the day. If/when the DJIA makes a new high that is not confirmed by the SMFI, there is usually trouble ahead.In other words, SMFI measures money flow by ignoring the movement in the Dow in the first half hour. While I would not necessarily characterize the first half hour of trading as dominated by dumb money, it is certainly emotional money. The chart below of the SMFI tells the story. While the Dow (in orange) has been holding up relatively well, SMFI has been dropping precipitously since mid March:

This second chart shows a longer term perspective. The top panel shows the Dow and SMFI, as above, back to 2005. The green line on the bottom panel shows the spread between the Dow and SMFI - and the spread is as negative as it was in 2007.

Harrison followed up with a caveat to his analysis:
You will notice that we are still at levels last seen in 2007, which may prove to be a false “tell” but should, at the very least, be considered when making financial decisions.
Following the midterm election year pattern
When I put these technical patterns together, the stock market seems to be following the historical pattern of a midterm election year. Ryan Detrick showed the typical pattern of such years, where the market peaks out in late April and bottoms out in September.

The good news is that the bottom in the Fall has historically been a durable bottom and a superb buying opportunity for stocks, as per this analysis from J.C. Parets:

Bullish fundamentals
While the technical picture is warning of a major correction, what puzzles me is the lack of a fundamental trigger for a decline. The US economy is behaving relatively well and seeing signs of a snap-back of winter related weakness. So far, Earnings Season has not proved to be a major disappointment. As per Bespoke, the EPS beat rate is 62%, which is in line with historical average. On the other hand, the sales beat rate is a bit low at the 50% mark. Across the Atlantic, the ECB looks like it may finally edge towards QE, which should be supportive of European equities.
Jeff Miller summed up the "Sell in May" hysteria perfectly here:
The seasonal slogans often substitute for thinking and analysis. The powerful-looking chart that leads today's post actually translates into a 1% monthly difference in performance. The "good months" gain 1.3% on average while the "bad months" gain about 0.3%.The bear case then rests on a case of risk exhaustion and unwind (see A case of risk exhaustion), which is a funds flow driven bearish trigger. Any resulting correction would likely be a brief and possibly sharp which would be a good buying opportunity.
The 2011 parallel?
If 2011 is a parallel, then perhaps the answer is to consider the possibility of the markets pricing in rising tail-risk, namely Russia-Ukraine and a China meltdown.
Russian tail-risk
I have discussed the tail-risk from the Russia-Ukraine situation before. Ambrose Evans-Pritchard wrote that the US is preparing sanctions that could bring the Russian economy to a screeching halt by freezing the external financial transactions of Russia and Russian companies:
An elite cell at the US Treasury has developed an arsenal of financial weapons that can in theory bring even large countries to their knees through use of “scarlet letters” that cause global banks and insurers to pull back. Japanese banks are already retreating from Moscow to pre-empt problems with US regulators.In a separate article, Evans-Pritchard indicated that western energy companies like BP and Shell may have trouble operating in the US should the next stage of sanctions be imposed. It would be measures like these that would spook the markets and force a re-pricing of Russian related tail-risk.
Sources in Washington say the US Treasury may soon extend the black list to Igor Sechin, president of the oil giant Rosneft, the biggest traded oil company in the world. Any such move would be a costly headache for BP, which owns 19.75pc of Rosneft’s shares under a deal reached in 2012 ending its stormy misadventures in TNK-BP.Zero Hedge has also speculated that the US may target Putin's personal $40 billion stash. The ZH postulated Russian response would be to retaliate in kind, regardless of whether Putin's personal funds are involved in the sanctions:
It is unclear whether BP could continue to operate in the United States or even carry out its global business smoothly if it continued to be a Rosneft shareholder with Mr Sechin still in charge, yet it would be difficult to find buyers for a holding worth $12.5bn in the midst of a crisis. America's Exxon Mobile would have to reconsider its drilling plans with Rosneft in the Arctic `High North'.
The US Treasury is also eyeing some form of sanction against Gazprombank, the financial arm of the gas monopoly Gazprom. This would greatly complicate Shell’s joint operations with Gazprom at Sakhalin Island and in the Arctic, though this would depend on the exact wording and how the US Securities and Exchange Committee chose to enforce it.
Russian presidential adviser Sergei Glazyev proposed plan of 15 measures to protect country’s economy if sanctions applied, Vedomosti newspaper reports, citing Glazyev’s letter to Finance Ministry. According to Vedomosti as Bloomberg reported, Glazyev proposed:While I tend to take anything published at ZH with a grain of salt, they may not be that far off this time. Oleg Babinov of The Risk Advisory Group wrote the following in March about the Crimean crisis and the likely response from the Kremlin is roughly in line with the proposals outlined in ZH (via Moscow Times):
- Russia should withdraw all assets, accounts in dollars, euros from NATO countries to neutral ones
- Russia should start selling NATO member sovereign bonds before Russia’s foreign-currency accounts are frozen
- Central bank should reduce dollar assets, sell sovereign bonds of countries that support sanctions
- Russia should limit commercial banks’ FX assets to prevent speculation on ruble, capital outflows
- Central bank should increase money supply so that state cos., banks may refinance foreign loans
In other words, a full-blown scorched earth campaign by Russia.
- Russia should use national currencies in trade with customs Union members, other non-dollar, non-euro partners
If Russia does not rush in to incorporate Crimea as its "administrative unit" and the sanctions are limited to its dropping from Group of Eight and some limited visa sanctions and asset freezes for politicians and businessmen who are directly involved in separatist activities, Russia's response would be relatively small-scale. If this is the case, there will be little effect on investors, except those who may be involved in cooperation with Russian companies in the field of military technology — but this is possible only if the U.S. and the European Union do not decide to freeze cooperation with Russia in this field.Ambrose Evans-Pritchard has also speculated that Russia may escalate the conflict to cyber-warfare:
But if sanctions are applied to Russian state-owned companies and banks, Russia might want to retaliate by freezing foreign companies' accounts here. There was an announcement that the constitutional law committee of the Federation Council has invited legal experts to study whether such sanctions would be legal, but no draft law has been produced yet.
The greatest risk is surely an "asymmetric" riposte by the Kremlin. Russia's cyber-warfare experts are among the best, and they had their own trial run on Estonia in 2007. A cyber shutdown of an Illinois water system was tracked to Russian sources in 2011. We don't know whether US Homeland Security can counter a full-blown "denial-of-service" attack on electricity grids, water systems, air traffic control, or indeed the New York Stock Exchange, and nor does Washington.For now, these scenarios are all speculative and remain tail-risks. However, should the events in eastern Ukraine spiral out of control, watch for the markets to start pricing in the possibilities of these risks - and they could be the trigger for a significant sell-off in the equity markets.
"If we were in a cyberwar today, the US would lose. We're simply the most dependent and most vulnerable," said US spy chief Mike McConnell in 2010.
The US defence secretary Leon Panetta warned of a cyber-Pearl Harbour in 2012. "They could shut down the power grid across large parts of the country. They could derail passenger trains or, even more dangerous, derail passenger trains loaded with lethal chemicals. They could contaminate the water supply in major cities, or shut down the power grid across large parts of the country,” he said. Slapstick exaggeration to extract more funds from Congress? We may find out.
China: Whistling past the graveyard
The tail-risks in China are also rising. It all starts with problems in the overbuilt property market. Nomura estimates that in 2013 alone, China added roughly 400 square feet of new construction per urban resident:
Zhang Zhiwei, chief China economist at Japanese investment bank Nomura, said in a report last month that after building around 13.4 percent more floor space every year for the past several years, the country finally has too much housing. Zhang estimates about 2.6 billion square meters (about 28 billion square feet) were added in 2013, or 400 square feet of new residential floor space per urban resident.These charts from Nomura show the scale of the overbuilding, even by developed market standards:

Despite the apparent overbuilding, expansion is continuing, especially in the smaller cities:

The overbuilding was not a problem until property prices started to cool of this year. The price decline is particularly acute in the Tier 3 and 4 cities (via Xinhua):
The slowdown of the property market that was mainly seen in China's third- and fourth-tier cities last year has spread to more areas, and analysts warn of a tough 2014 for developers.Falling prices in the real estate market feeds into problems in the financial system:
Figures released by the National Bureau of Statistics (NBS) last Friday showed that 178.25 million square meters of residential property were sold in the first quarter, down 5.7 percent year on year.
Added to the property market woes is the credit crunch for both developers and buyers.A credit crunch is developing:
Stringent bank loans since the end of last year have dealt real estate firms, medium- and small-sized ones in particular, a blow in securing their fund chain, said Hu Baosen, board chairman of Central China Real Estate Ltd.
Meanwhile, banks have not loosened their control over personal housing loans, making it more difficult to purchase property on mortgage.While I have heard China bulls say that a cooling property market does not present that much of a problem because most real estate is not purchased with debt, there are secondary financial effects from suppliers such as the steel industry, which is suffering from over-capacity, and other producers of construction materials. The balance sheet of these companies are not pristine and have substantial debt. These credit risks are now manifesting themselves in the form of defaults in the shadow banking system, which leads to a credit crunch, which can result in cascading defaults and...you get the idea.
Among the 35 major cities surveyed by Centaline Property Agency Ltd., 25 have seen their banks suspend housing loans.
Patrick Chovanec believes that the Achilles heel of the Chinese financial system is declining property prices. That`s because Chinese lenders lend based on collateral value, which is mostly property based, rather than cash flow because financial statements are unreliable:
If China’s housing market crashes, the ripple effect could be even more cataclysmic for its economy than the recent housing market collapses in the US and Europe were for their economies. A fifth of outstanding loans and a quarter of new loans are to property developers, says Nomura; untold billions more have been lent out off bank balance sheets. As falling prices crimp margins, small developers—like the one in the news this week—will start defaulting.Western bank are not immune to a financial crisis in China. Aggregate foreign currency denominated debt totals about USD 1 trillion (see EM tail-risks are rising). Should events spiral out of control, the financial damage may not be limited to the Chinese banking system and financial contagion could very well spread throughout the global banking system.
But the fallout will be bigger still, says Patrick Chovanec of Silvercrest Asset Management. “Not only is property important because it’s a key component of that investment boom, but it’s essentially the asset that underwrites all credit in the Chinese economy, whether it’s local government loans, whether it’s business loans,” Chovanec says, explaining that lenders require “hard” assets as collateral because financial accounts can easily be doctored.
Even as the economy slows and cracks appear in the financial system, Premier Li Keqiang has stated that the government is not consider any large scale stimulus programs but rely on targeted mini-stimulus instead:
Chinese Premier Li Keqiang said his government is not considering any strong stimulus measures or policies which would risk enlarging the fiscal deficit but will push through reform in order to support economic growth.In the meantime, the markets are relatively relaxed about looming financial tail-risk. My so-called Chinese canaries, the prices of HK-listed Chinese banks, are not showing signs of extreme stress:
"There is no consideration about expanding the deficit or using 'strong stimulus,'" Li said, adding that China's official "proactive" fiscal and "prudent" monetary policy biases won't change.
"But the government won't do nothing. It will rely on reforms, structural adjustments, to increase effective supply and meet new demand," he said.
His comments, which were published late Wednesday, were delivered at a State Council meeting at which the executive decision-making body decided to lower the reserve requirement for some rural financial institutions.
That move, which analysts expect to pump a miniscule CNY15 billion into the market, may bring relief to a struggling corner of the financial system but isn't expected to do much to shore up the broader economy.

In addition, Reuters reports that there are few takers for tail-risk insurance on China (emphasis added):
Selling insurance against a financial crisis should not be difficult, five years after the last one nearly wrecked the global economy.While I am not saying that catastrophe in China is my base case scenario, but it seems that the markets are whistling past the graveyard of a Chinese hard landing. Should the Chinese situation deteriorate, the possibility of a stampede for the exit is very real - and could be the trigger for a sudden downdraft in the price of risky assets.
But when it comes to China, the world's second-largest economy, the probability of a full-blown crisis is apparently so remote that hardly anyone will buy an insurance policy against it, no matter how cheap.
Financial wizards have been trying to sell peace of mind to investors in China for years, but fewer and fewer of those investors are interested, despite some worrying headlines.
In the past few months alone, China has seen its first domestic bond default, a small bank run, its weakest export performance since the global financial crisis, a marked slowdown in its property market and a rise in labor unrest.
Steve Diggle, a Singapore-based hedge fund manager who crafts strategies to protect investors against financial catastrophes, says investors have faith that the Chinese government, armed with almost $4 trillion in foreign exchange reserves, will simply not allow things to get out of hand.
He had to close down a fund that used to bet on doomsday outcomes in Asia last year.
Something's not right...
As I mentioned, market internals started to deteriorate before the eurozone crisis fully developed in 2011. Then, the trigger were worries about a Greek default and the possible repercussions on the euro, as well as a political impasse over the debt ceiling in Washington.
One possibility for 2014 is that the markets would follow the midterm election year pattern of a 10-20% summer correction into September or October. Already, the market technical picture is flashing warning signs. The trigger might be a combination of risk exhaustion by fast money accounts and rising tail-risk from one of these aforementioned events.
Despite the positive fundamental backdrop, my inner investor is siding with the technicians and he is becoming increasingly cautious. The technical message from Mr. Market is, "Something is not right about this bull." If the fundamentals were to hold up equity prices, then the technical outlook would improve and he would re-adjust his portfolio accordingly. Jeff Miller's prescription of what to do sounds about right to him:
To make a wise decision you need to make an objective quantitative comparison between the economic trends and the small seasonal impact. The Great Recession has been followed by a slow and plodding recovery. We have an extended business cycle with plenty of central bank support. Since I am expecting the current cycle to feature (eventually) a period of robust growth, I do not want to miss it. The 1% seasonal effect will be minor in a month where we get a real economic surge.My inner trader, who is more aggressive, is watching the developing head and shoulders pattern and waiting to the break to put on a leveraged short position on the market.
If instead we get the typical sideways market with some volatility, it is a perfect environment for selling short-term calls against attractive, dividend-paying stocks.

Just be aware that developing head and shoulders patterns often fail`and they do not become bona fide patterns until they are triggered. The bearish trigger is a breach of neckline support, which is at about the 4000 level. Should that occur, the downside target would be in the 3600-3650 region.
Cam Hui is a portfolio manager at Qwest Investment Fund Management Ltd. (“Qwest”). The opinions and any recommendations expressed in the blog are those of the author and do not reflect the opinions and recommendations of Qwest. Qwest reviews Mr. Hui’s blog to ensure it is connected with Mr. Hui’s obligation to deal fairly, honestly and in good faith with the blog’s readers.”
None of the information or opinions expressed in this blog constitutes a solicitation for the purchase or sale of any security or other instrument. Nothing in this blog constitutes investment advice and any recommendations that may be contained herein have not been based upon a consideration of the investment objectives, financial situation or particular needs of any specific recipient. Any purchase or sale activity in any securities or other instrument should be based upon your own analysis and conclusions. Past performance is not indicative of future results. Either Qwest or I may hold or control long or short positions in the securities or instruments mentioned.
Subscribe to:
Posts (Atom)


