Showing posts with label crude oil. Show all posts

Saturday, January 10, 2026

Regime Change Adventures: Bush, Obama, and now Trump

Emerging market shocks follow a familiar pattern in quantitative investing. When the event occurs, quantitative factor responses in stock selection get thrown out the window. As the smoke clears, top-down strategists map out the direction and magnitude of the shock, and technical analysis factors like price momentum and reversals start to work. As the magnitude of the shock becomes known, company analysts revise their earnings estimates, and estimate revision and earnings surprise factors begin to work. Finally, as the investment environment stabilizes, conventional value and growth factors gain traction.
 
The same thing is happening when U.S. forces seized Venezuelan President Maduro and his wife in a weekend raid. The smoke is starting to clear, both metaphorically and literally, and invest0ors can see the direction of the shock.
 
The raid made some sense from a Trumpian geopolitical viewpoint. Bloomberg opinion columnist Javier Blas characterized the move as Trump building his own Oil Empire. The Donroe Doctrine countries in the Western hemisphere, the U.S., Canada, Venezuela and the rest of the Americas, control roughly 40% of global oil production and this allows the White House much greater control over oil prices and production to avoid energy shocks in the future.

It all sounds good in theory. But as the recent history during the 21st Century shows, this is the third time the U.S. has attempted regime change in oil-producing countries. Bush tried it in Iraq, Obama tried it in Libya and now Trump is trying it in Venezuela. None worked out according to their pre-war textbooks. Here’s what this latest geopolitical adventure means for investors.

The full post can be found here.

Sunday, July 31, 2022

In what world is fighting the Fed a good idea?

Preface: Explaining our market timing models 
We maintain several market timing models, each with differing time horizons. The "Ultimate Market Timing Model" is a long-term market timing model based on the research outlined in our post, Building the ultimate market timing model. This model tends to generate only a handful of signals each decade.

The Trend Asset Allocation Model is an asset allocation model that applies trend following principles based on the inputs of global stock and commodity prices. This model has a shorter time horizon and tends to turn over about 4-6 times a year. The performance and full details of a model portfolio based on the out-of-sample signals of the Trend Model can be found here.


My inner trader uses a trading model, which is a blend of price momentum (is the Trend Model becoming more bullish, or bearish?) and overbought/oversold extremes (don't buy if the trend is overbought, and vice versa). Subscribers receive real-time alerts of model changes, and a hypothetical trading record of the email alerts is updated weekly here. The hypothetical trading record of the trading model of the real-time alerts that began in March 2016 is shown below.


The latest signals of each model are as follows:
  • Ultimate market timing model: Sell equities*
  • Trend Model signal: Bearish*
  • Trading model: Neutral*
* The performance chart and model readings have been delayed by a week out of respect to our paying subscribers.

Update schedule: I generally update model readings on my site on weekends and tweet mid-week observations at @humblestudent. Subscribers receive real-time alerts of trading model changes, and a hypothetical trading record of those email alerts is shown here.

Subscribers can access the latest signal in real-time here.


A dovish tone?
There were few substantial surprises from last week's FOMC decision. However, the market interpreted Powell's statements as slightly dovish. As a consequence, Fed Funds futures began to discount a pause in late 2022 and easing by March 2023, which is a significant change from the expectations before the meeting announcement.

Fed Chair Jerome Powell referred to the June Summary of Economic Projections, or dot plot, in the post-FOMC press conference as "probably the best estimate of where the Committee's thinking is still". The Daily Shot pointed out that the market is massively fighting against the dot plot, which is "a trajectory that looks too dovish, given the broad and entrenched inflationary pressures".


In what world does anyone think that massively fighting the Fed is a good idea?

The full post can be found here.

Monday, October 18, 2021

Opportunities in energy and gold

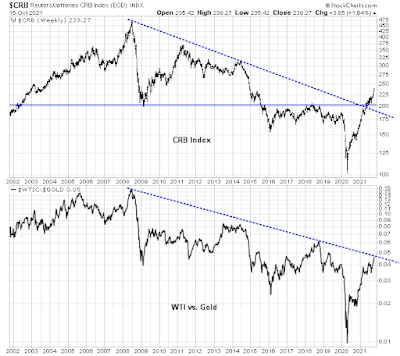
As the CRB Index decisively broke out to a new recovery high while breaking through both a horizontal resistance level and a falling downtrend that began in 2008, a divergence is appearing between crude oil and gold. The oil to gold ratio has strengthened to test a falling trend line. 


This test of trend line resistance could present some opportunities for traders.

The full post can be found here.

Saturday, February 13, 2021

How value investors can play the new commodity supercycle

The investment seasons are changing. Two major factors are emerging in altering the risk and return profiles of multi-asset portfolios in the coming years, rising commodity prices and value investing.

There is a strong case to be made that we are on the cusp of a new commodity supercycle. The last time the CRB to S&P 500 ratio turned up, commodity prices outperformed stocks for nearly a decade. The ratio is on the verge of an upside breakout from a falling trend line, supported by the stated desire of the Biden administration and the Federal Reserve to run expansive fiscal and monetary policies.


The full post can be found here.

Saturday, December 5, 2020

A focus on gold and oil

I received considerable feedback from last week's publication (see How to outperform by 50-250% over 2-3 years), mostly related to gold and energy stocks.


In last week's analysis, I had lumped these groups in with other cyclicals. Examining them further, I believe they have bright futures ahead of them.

The full post can be found here.


Saturday, April 25, 2020

Why this volatility isn't unprecedented

I have heard comments from veteran technical analysts who have become bewildered by the market's action. The word "unprecedented" is often used.

I beg to differ. The violence of the sell-off, and subsequent rebound is not an unprecedented event. Recall the NASDAQ top of 2000. The NASDAQ 100 fell -39.8% from its March 2000 high, and rebounded 40.1% to its 61.8% Fibonacci retracement level in just four months. The index proceeded to lose -49.7% in that year, and ultimately -80.8% at the 2002 bottom, all from the July reaction high.


I am not implying that the NASDAQ pattern in 2000 represents any market analog to today's action. Barring some other unforeseen catastrophe, such as the Big One taking down California and decimating Silicon Valley, the market is not going to fall -80% from the reaction high.

In the past, I outlined my concerns about the stock market (see The 4 reasons why the market hasn't seen its final lows). This week, I register additional concerns, mainly from a technical analysis perspective.

The full post can be found here.

Wednesday, April 22, 2020

Making sense of the oil crash

Mid-week market update: How should investors interpret the crash in oil prices and its effect on the stock market? The most simplistic way of looking at it is to observe that stock and oil prices have diverged. Either oil has to rally hard, or stocks have to fall down - a lot.


That's a basic tactical view. While it may be useful for traders, correlation isn't causation. These gaps in performance can take a lot longer than anyone expects to close.

It certainly isn't the entire story.

The full post can be found here.

Monday, September 16, 2019

3 supply shocks could derail the economy

As the market reacts the weekend attack on Saudi oil facilities, the level of anxiety is mounting. Forbes published an article on Sunday entitled "Attacks on Saudi Arabia are a recipe for $100 oil".

Bloomberg that this represents the biggest disruption to global oil supply since the Iraqi 1990 invasion of Kuwait.


As visions of the 1974 Arab Oil Embargo and the ensuing recession dance in traders' heads, this is a timely reminder that the FOMC is meeting this week. Should the supply curtailment become prolonged, how should policy makers react to supply shocks? As well, there is a case to be made that the world is facing more than just one supply shock.

The full post can be found here.

Sunday, May 13, 2018

How I learned to stop worrying and love rising rates

Preface: Explaining our market timing models
We maintain several market timing models, each with differing time horizons. The "Ultimate Market Timing Model" is a long-term market timing model based on the research outlined in our post, Building the ultimate market timing model. This model tends to generate only a handful of signals each decade.

The Trend Model is an asset allocation model which applies trend following principles based on the inputs of global stock and commodity price. This model has a shorter time horizon and tends to turn over about 4-6 times a year. In essence, it seeks to answer the question, "Is the trend in the global economy expansion (bullish) or contraction (bearish)?"


My inner trader uses the trading component of the Trend Model to look for changes in the direction of the main Trend Model signal. A bullish Trend Model signal that gets less bullish is a trading "sell" signal. Conversely, a bearish Trend Model signal that gets less bearish is a trading "buy" signal. The history of actual out-of-sample (not backtested) signals of the trading model are shown by the arrows in the chart below. The turnover rate of the trading model is high, and it has varied between 150% to 200% per month.

Subscribers receive real-time alerts of model changes, and a hypothetical trading record of the those email alerts are updated weekly here.

The latest signals of each model are as follows:
  • Ultimate market timing model: Buy equities*
  • Trend Model signal: Bullish*
  • Trading model: Bullish*
* The performance chart and model readings have been delayed by a week out of respect to our paying subscribers.

Update schedule: I generally update model readings on my site on weekends and tweet mid-week observations at @humblestudent. Subscribers receive real-time alerts of trading model changes, and a hypothetical trading record of the those email alerts is shown here.


Yellow flags galore, but no red flags
In the wake of last week's publication (see Why I am not ready to call a market top), I had a number of discussions with investors that amounted to, "What about _________ (insert the worry of the day)".

The main themes discussed, in no particular order, were:
  • Rising rates and the flattening yield curve;
  • Trade war;
  • Oil price spike; and
  • Fed policy error as they tighten into a decelerating economy.
I conducted an (unscientific) Twitter poll, and respondents were mostly concerned about a Fed policy error, while the oil price spike was the least of their worries.


While I believe that all of these risks are legitimate, they can be characterized as yellow flags, but there are no red flags that signal an imminent recession or equity bear market.

The full post can be found at our new site here.


We would further like to announce our Sale in May. The offer is available only to the first 100 to sign up. Please use this link to order.


Sunday, July 23, 2017

What would a contrarian do?

Preface: Explaining our market timing models
We maintain several market timing models, each with differing time horizons. The "Ultimate Market Timing Model" is a long-term market timing model based on the research outlined in our post, Building the ultimate market timing model. This model tends to generate only a handful of signals each decade.

The Trend Model is an asset allocation model which applies trend following principles based on the inputs of global stock and commodity price. This model has a shorter time horizon and tends to turn over about 4-6 times a year. In essence, it seeks to answer the question, "Is the trend in the global economy expansion (bullish) or contraction (bearish)?"

My inner trader uses the trading component of the Trend Model to look for changes in the direction of the main Trend Model signal. A bullish Trend Model signal that gets less bullish is a trading "sell" signal. Conversely, a bearish Trend Model signal that gets less bearish is a trading "buy" signal. The history of actual out-of-sample (not backtested) signals of the trading model are shown by the arrows in the chart below. Past trading of the trading model has shown turnover rates of about 200% per month.


The latest signals of each model are as follows:
  • Ultimate market timing model: Buy equities*
  • Trend Model signal: Risk-on*
  • Trading model: Bullish*
* The performance chart and model readings have been delayed by a week out of respect to our paying subscribers.

Update schedule: I generally update model readings on my site on weekends and tweet mid-week observations at @humblestudent. Subscribers will also receive email notices of any changes in my trading portfolio.


What's the contrarian class?
Being a contrarian is a lonely life. You don't hang out with the popular kids. You are probably the nerd in the class. You get picked last in team sports. You don't get invited to any of the parties. And even if you do, everyone laughs at you.

Over at Macro Man, he put us in a contrarian state of mind by asking, "What's the unloved asset class?"

The question was not in the context of a trade, such as short FAANG, but an asset class that you buy and hold for the next few years. Going down the list, he rejected US equities for the reasons of high valuation.


He also rejected developed market fixed income, as well as all forms of credit. The cap rates on commercial real estate isn't offering great value either.


Private equity? Just look at the cash on the sidelines waiting for deals.


At the end, he concluded, "Hmm, cash and gold seem to check a lot of boxes." No wonder contrarians don't get invited to parties.

Cash? Gold? While I believe that it's still a little early to get overly bearish on equities, but here is how a scenario that favors cash, gold and other commodities may develop.

The full post can be found at our new site here.

Thursday, May 26, 2016

$50 oil! What's next?

As the oil price touched $50, there has been a growing paradigm shift, a sort of "this time is different", consensus forming about the long-term outlook for oil prices. Amy Myers Jaffe of UC Davis recently addressed the 69th CFA Institute Conference and made the following bearish points about the long run trajectory of oil prices:
  • Demand: Global demand growth is set to slow, flatten and perhaps fall as countries start to adopt alternative energy sources. Indeed, Bloomberg recently reported that there are more people employed in renewable energy in China than oil and gas. Similarly, solar power related employment has surpassed employment related to coal and oil and gas combined in the United States.\
  • Supply: The fracking revolution is a revolution. For the first time in history, advances in engineering has allowed us to extract oil and gas from oil bearing rock, which means that any geology that formerly produced oil, such as Pennsylvania, is has the potential to produce oil again. Jaffe did not, however, address the cost question and said in so many words that these are engineering problems, which can be solved over time.
In effect, don`t expect much more upside in the price of oil.

Independent of Jaffe's analysis, Bloomberg Gadfly column by Liam Denning used similar assumptions about oil prices and suggested a strategy by the Big Oil companies is in order:

Like OPEC, they [Big Oil] assumed the value of their reserves of this finite, critical commodity would, more or less, keep rising over time. So a barrel not produced today, even if it cost a lot to find or acquire, is effectively money in the bank. This is why the majors obsess over their reserves replacement ratio, measuring how many new barrels come in to replace the ones they pump out.

Now, the upcoming Saudi Aramco IPO raises one troubling possibility: That the assumption of endlessly rising reserve value may no longer hold true.

A flurry of paradigm-shifting announcements out of Saudi Arabia came soon after a speech in October by BP's chief economist. He posited that the shale boom undercut the notion of peak oil supply, while efforts to curb carbon emissions raised the possibility of peak demand.
Denning went on to suggest that the upcoming partial privatization of up to 5% of Saudi Aramco representing a Saudi strategic shift to produce at any price, rather than to bank the oil in the ground because it is becoming a commodity with diminishing value.
Saudi Arabia's sudden desire to sell shares in its national champion and generally shift the entire economy away from its oil addiction suggests it at least entertains those possibilities. It also provides a rationale to maximize production at any price, rather than risk barrels being left worthless in the ground.
Shale boom + carbon emissions curb = Peak Oil demand. It's time to change the thinking on the management of this resource and sell it as fast as possible because some of those assets will become stranded in the future. Call it the Hot Potato Theory of oil.

The full post can be found at our new site here.


Website notice
If you found the above post to be of interest, come over to the new site and check out our track record. We have something for traders and investors alike:


Tuesday, January 26, 2016

Why the Saudis will either blink...or collapse

As Saudi Arabia`s budget has come under pressure from low oil prices, I see that the Kingdom (KSA) has announced a diversification initiative into IT, healthcare and tourism (via CNBC):
Saudi Arabia outlined ambitious plans on Monday to move into industries ranging from information technology to health care and tourism, as it sought to convince international investors it can cope with an era of cheap oil.

A meeting and presentation at a luxury Riyadh hotel was held against a backdrop of low oil prices pressuring the kingdom's currency and saddling it with an annual state budget deficit of almost $100 billion - the biggest economic challenge for Riyadh in well over a decade.

Top Saudi officials said they would reduce the kingdom's dependence on oil and public sector employment. Growth and job creation would shift to the private sector, with state spending helping to jump-start industries in the initial stage.

"It's going to switch from simple quantitative growth based on commodity exports to qualitative growth that is evenly distributed" across the economy, said Khalid al-Falih, chairman of national oil giant Saudi Aramco.

What KSA faces is a classic problem in development economics. How do you create new industries and employment in an economically depressed region?

The full post is at our new site here.


Site notice
We have temporarily stopped taking monthly and annual subscriptions in order to better control the rapid growth of our community. However, if you are interested, you can either subscribe

Wednesday, January 20, 2016

A possible generational low in oil and energy stocks

The bad news just doesn't stop coming for oil. It all began when Saudi Arabia had turned on the production spigots to counter growing production from American frackers, and now it has to contend with the geopolitical dimensions of the growing power of Russia and Iran in the Middle East. The calls are growing for $20 oil and even $10 oil as there seems to be no prospects of an end to the oversupplied market.

For some long-term perspective, keep in mind this chart from of supply and demand from Jeff Gundlach (via Business Insider). While it is true that there is a significant gap between supply and demand right now, demand has steadily risen and that excess supply will eventually get absorbed:


The full post is at our new site here.


Site Notice
We are extending the deadline for taking new subscribers from midnight Friday (Pacific Time) to midnight Friday January 22, 2016 because of the website outages in the last few days. Readers who aren't ready to subscribe can receive notification of free posts, which are open to the public two weeks after publication, by registering here.


Wednesday, August 19, 2015

How a gold rally could derail the stock bull

Sometimes it's interesting how macro trade setups line themselves up. Right now, one of the crowded macro trades seems to be long US Dollar and, by implication of their negative correlations, short commodities. So what happens if this trade were to reverse itself? What the implications for the markets in general?


A crowded long (and short)
First, let`s consider what the crowded trades are. Here are the results of the BoAML Fund Manager Survey, which surveys a sample of mainly globally oriented institutional fund managers. The consensus crowded long is long USD.


Since the USD and commodity prices are inversely correlated, it was therefore no surprise that global equity fund managers were hugely underweighted in the energy sector.


When we analyze sector weightings, the global sample shows that equity managers were underweight energy, materials, commodities and emerging markets, which are all correlated to each other.


The US sector positioning was more or less the same, namely a huge underweight in energy and materials, which is a very small sector by weight.


Gold and oil poised to rally
However, the technical internals of oil and gold, gold is trying to bottom and oil may not be that far behind, while the USD Index has been stuck in a tight trading range since March.

Here is the chart of gold. The silver/gold ratio is shown in the bottom panel. Note how higher beta silver bottomed before gold did, indicating selling exhaustion. Even though gold remains in a long-term downtrend, the metal was highly oversold and it has room to stage a counter-trend rally all the way up to the 1160-1180 level.


Here is the chart of crude oil. I have shown the charts of Brent, which is arguably more reflective of the world price of oil and does not have the transportation issues of WTI, in the middle panel and WTI in the bottom panel. Brent sustained a successful test of technical support while exhibiting positive RSI divergence, while WTI fell to new lows for this cycle.


The charts of resource equities are telling a similar story. The chart of Metals and Mining stocks below show that this industry group is testing a key support level, but market internals are positive as it is experiencing a positive RSI divergence.


Here are the gold stocks. The ratio of the higher beta junior golds (GDXJ) to senior golds (GDX) is shown on the bottom. The high beta juniors bottomed out well before the seniors, indicating that selling exhaustion had set in, much in the manner of the silver/gold ratio.


The chart of the energy stocks below are showing two forms of positive divergence. Despite the new lows seen in WTI today, energy equities held up and did not breach their lows. As well, the RSI positive divergence is another bullish sign.


While the technical internals of commodities and resource stocks are exhibiting blatantly bullish tendencies, the USD Index chart is not as obviously bearish. The USD Index peaked out in March and has been moving sideways every since. Some minor bearish signs can be seen as the USD Index did breach its 50 dma today and RSI appears to be trending down, which indicates deteriorating momentum. However, these are not decisively bearish signals in the way that resource stocks appear bullish.


What if commodities rally and the USD weakens?
Supposing that the commodity complex were to stage a counter-trend rally for the next few months, what are the likely implications?

Strength in commodity prices would likely mean USD weakness by virtue of their inverse relationship. Assuming that the FOMC were to raise rates at their September meeting, the market would then focus on the pace of future rate hikes. Would there be another rate hike in December?

This is where I believe the markets could force the Fed's hand. The Federal Reserve has made noises in the past about its concerns about the strength of the US Dollar. A rising Dollar is a form of de facto tightening by importing deflation and a weakening Dollar would import inflationary pressures. Dollar weakness therefore puts upward pressure on inflation and a faster pace of rate hikes becomes more likely.

The bond market could very well freak out.

Matt Busigin wrote the following comment in 2013 about what to expect when the Fed raises rates, but his comments are still applicable today. He referred to the key 2012 Jackson Hole paper by Michael Woodford, Methods of Policy Accommodation at the Interest Rate Lower Bound. Busigin cited historical studies indicating that stocks tended to rise when the Fed raised rates, but there was a caveat to the analysis (emphasis added):
The mean monthly total return of the SP 500 is 0.65%. That return drops, but is still positive when the Fed Funds rate increases, to 0.45%. However, when the term premium between the 10y and Fed Funds rate is positive, the average return returns to 0.64%. When the term premium is above 1%, the average return is even higher than the sample mean – 0.82%! When adding the condition that the benchmark rate falls, the mean monthly return climbs to 1.27%. This tells us something very significant to the discussion: the price of SP 500 contains the expectation of monetary policy. Thusly, monetary policy tightening has not negatively impacted the SP 500 unless it happens more quickly than the market expects. In fact, both the 10y and the equity market don’t necessarily negatively react to Fed Funds hikes.
If commodity prices were to rise and the USD falls, then it would change market expectations about the likely trajectory of Fed policy, which would become more hawkish. Both the bond and stock markets wouldn't like that at all.

For a more empirical view, Urban Carmel took a stab at what happens after the first Fed rate hike. He found that the market response varied, but there were some commonalities. Stocks tended to rally into the rate hike, sell off and then rise again (emphasis added):
In all 6 cases, US equities rose in the 3 months ahead of the first rate hike (on the right side of the chart above). Note that $SPX sold off by at least 5% in the months after the last 4 rate hike cycles began. So, to generalize, stocks rally into the expected first rate hike, then sell off and then rally again.
Treasury yields tended to rise after the first rate hike:
Treasury yields rose after each rate hike (meaning: prices fell). The positive returns (first chart in this post) come from their offsetting coupon payments.

Interestingly, yields were flat or rising in the 3 months ahead of the first rate increase. In contrast, 5, 10 and 30 year yields have now declined over the past 3 months, and 2 year yields are flat. The set up is different now then it is normally.
Rate hikes generally occurred in commodity bullish environments (because commodities rise when the economy is expanding and demand growing), but the setup this time is different as commodities have been falling into the FOMC decision:
On average, commodities were the best performing asset class after the first rate hike. Again, this should make sense since an improving economy implies demand for industrial metals and energy. In fact, commodity prices had already been rising ahead of the first rate increase. Which makes today's situation, where energy and industrial metals are falling, very different.

What about earnings?
Based on my analysis so far, I can anticipate readers asking, "What about the positive effect on earnings when the USD falls?" After all, unfavorable currency translation has proven to be a headwind for the earnings of many US multi-nationals. Shouldn't a falling Dollar be earnings positive?

The answer to that question is a qualified yes. The chart below of the Trade Weighted Dollar shows that the rise of the USD began about a year ago and peaked in March. The TWD has been mainly flat ever since.


Unless the Dollar were to truly crater and retrace most of its gains that began last summer, YoY comparisons of currency translation effects will still be negative for Q3 and Q4 earnings season. While a weaker USD may pose less of a headwind to earnings, it will still be a headwind for the roughly the next two earning seasons. It is unclear, however, how much USD strength is already baked into Street EPS estimates and therefore the effects of Dollar weakness on expectations is uncertain.


A September correction?
So let's set up the scenario. Gold, oil and other commodity prices rally from their oversold positions. It should not matter for the next several months whether this is the start of a sustained bull or just a bounce in a downtrend. At the same time, the US Dollar takes a breather and retreats against major currencies. From a technical perspectives, these moves are overdue because of the crowded short in commodity and commodity-related stocks and a crowded long in the USD.

Supposing that the Fed raises rates by 1/4 point at its September meeting. The market then asks, "Will they move again in December?"

The falling Dollar changes market expectations about the pace of tightening, though whether it necessarily forces the Fed's hand will be a matter for debate. The key point is that market expectations will have changed about the trajectory of changes in short-term interest rates.

The bond market sells off on rising inflationary pressures, which then pushes equity earnings multiples downwards. Equities then correct over the next few months.

This is not necessarily my forecast, but it does show how macro forces that begin with an oversold rally in gold and oil could spark a stock market correction. The key signposts to watch over the coming weeks are:
  • The US Dollar;
  • Commodity prices; and
  • The September FOMC decision.
As an investor, I work with possible market scenarios and then estimate their likelihood. A commodity sparked correction in stock prices is a possibility that we need to keep in mind.

Wednesday, February 11, 2015

3 reasons why oil prices haven't bottomed

As oil prices have begun to stabilize, there has been a lot of opinions as to whether oil has bottomed or not. I thought that I would throw in my 2c worth on why I believe the path of least resistance for oil is still down.


Technical: Bottoms are a process
First, I refer to the excellent technical work done by Urban Carmel, who indicated that when oil prices crater the way they do, they generally don't form a V-shaped bottom:
Let's look at other drops in oil over the past 30 years. Below is a monthly chart of crude oil (WTIC). The yellow bars are the size and duration as the current fall in oil since June 2014. Three other instances look similar in that the drop was swift and without a pause (marked with stars: 1986, 1990 and 2008). Two others took twice to four times as long to unfold (1997 and 2000).

He pointed out that bottoms tend to be a process. If the recent rally is the first phase of a bottom, then rallies are typically capped by the 50 day moving average. Prices then weaken and then re-test the previous low, sometimes successfully and at other times undercut the low. The key feature of a bottom is a positive MACD divergence.


Still too much supply
Another impediment to a sustainable rally has been the dynamics of the futures market. Consider the forward curve of oil as shown below (via Yahoo finance):


The most often quoted price is the front month, which closed at 49.45. If you look out six months, however, the price is 56.43 and the 12 month price is 60.01. This upward sloping contango means that any trader with storage could buy oil at 49.45 for delivery, hold it and then sell it in six months for 56.43 for a tidy 14.2% profit (less carrying costs). A 12-month buy-and-hold will get you 21%.

The contango has created two effects. First, oil producers typically hedge their production with a 6 or 12 month strip contract (e.g. 12 month strip = 1/12 of 1st month + 1/12 of next month + ... ). The actual realized hedged price is about 10% higher than the often quoted front month contract. In that sense, things aren't as bad as the headlines sound.

In addition, the strongly upward sloping forward curve has encouraged trading desks and hedge funds to take advantage of the contango by buying the physical, storing it and selling it forward. Add a bit of leverage to that trade and you have yourself a very big payday. The contango has therefore created an inventory level that's off the charts (via Business Insider):


More Nigerian supply?
In addition, global supply could see a boost in the short-term. CNBC interviewed Helima Croft of RBC, who said that more geopolitical considerations could be at play (emphasis added):
Croft added other factors could also cause oil prices to bottom. "[Those] are not based on actual production," she said. "Those are more geopolitical factors." Croft also said some of these external geopolitical factors have yet to filter through the oil market.

"There's not a concern in the market right now about Nigeria," she said. "Their election was supposed to take place this weekend; it's been postponed. Historically, we've seen significant volumes of crude come off the market around Nigerian elections. In the 2003 elections ... we lost 850,000 barrels of production because of unrest around oil facilities."

Bottom line: Don't expect the current oil rally to be long lasting or sustainable. I have no idea whether  the mid-40s level seen in the most recent swoon was THE BOTTOM for oil prices, but my inkling is that the near-term direction for oil is down.

Monday, April 23, 2012

Not enough panic to buy yet

Now that we are nearly at support on the Spanish IBEX 35 Index, my inner trader tells me it's too early to be buying. We need to wait for more pain and panic to materialize. My inner investor says that signs of value are starting to show up in a number of natural resource sectors and it's time to start accumulating positions in resource cyclicals.


Spain a contrarian buy, but not yet
Soon after I wrote my last post (see Why I am buying the pain in Spain), Macro Man and I seemed to be on the same page when he wrote that Spain is unlikely to crash:
To TMM [ed. TMM=Team Macro Man] it would appear that the only scenario that supports selling right now is one where Spain crashes, doesn't receive assistance, defaults and the euro and then Europe break up. Now call us picky but though that indeed is one potential outcome there are a lot of other scenarios and most of them involve some internal resolve, even if it does involve printing your amount of money. Elections may change the leaders of some countries but as the UK Con/Lib coalition is finding out, they are but the tip of the iceberg of the machine that is government. There is enough mass below the waterline that knows where its true interests lie to stymie any threats to them. Yes Minister indeed.
In fact, they were piling into the Spanish trade:
Having piled back into equities last week the current mood should be considered as red flags to us and we really ought to run with the pack, chop the longs, swing short and whip up the doom. Instead though TMM have decided to do the reverse and have broken the glass on the cabinet containing their Kevlar Gloves and bought some Spanish stocks of international appearance ( braced for comments). Hold on tight !!
Recall that my original premise for buying Spain is to wait for a period of maximum pain and panic (see How much more pain in Spain?). The defining moment was the 2009 lows, which would be a level of technical support for Spain's IBEX 35 Index.


Now that we are nearly there, I don't think we've seen sufficient pain and panic in the markets for Spanish equities to be a contrarian buy yet. My inner trader thinks that TMM should be following his initial instincts to "run with the pack, chop the longs, swing short and whip up the doom."

Consider this chart of European stocks, which exhibited a break of an uptrend, but the index is not showing any signs of panic yet.


What about the euro? The EURUSD exchange rate is holding in nicely, thank you very much.


So are 10-year Treasury yields. No signs of panic there either.


Is the market about to hit an air pocket?
I am starting to see the signs of a change in leadership. While my Asset Inflation-Deflation Trend Model remains in at a weak neutral reading and I am not in the business of anticipating model reading changes, my best wild-eyed guess for the stock market is a gut-wrenching correction, followed by an explosive rally as the Bernanke Put and Draghi Put kicks in.

Consider the relative return charts below. The top chart shows the relative return of the Morgan Stanley Cyclical Index compared to the market. Cyclicals are underperforming and they have been in a relative downtrend after topping out in early February. By contrast, defensive sectors such as Consumer Staples and Utilities have been bottoming out relative to the market this year and recently started to outperform.


These are the signs of a change in leadership pointing to a deeper correction in stocks.


Value in resource sector
Despite the negative near-term prospect for cyclicals, I am seeing signs of value showing up in the deep cyclical sector, particular in the resource sector. Canada's Globe and Mail featured an article detailing that while energy companies were going like gangbusters:
Alberta’s oil patch is roaring. Oil prices are flying, pipelines are pumping millions of barrels a day, and companies are engaged in a rollicking spending spree.


Every 2½ weeks, companies shovel another billion dollars into oil sands projects. Drilling rigs across the province are tapping big new pools of oil. And firms desperate for skilled workers are scouring the globe to help them get on with ambitious growth plans. Western Canadian oil output is expected to surge by more than a third to 3.6 million barrels a day by 2018.
Their stockholders were missing out on the party:
Alberta’s energy frenzy has all the makings of a hollering rodeo party. But there’s one group conspicuously missing out on the action: investors.


In the midst of a boot-stomping boom, oil and gas has been among the country’s worst-performing sectors of the stock market. Since the global economic crisis, benchmark oil prices have soared from below $40 (U.S.) a barrel to above $100. Many Canadian energy stocks, however, have been left in the dust.
Indeed, this chart of the XOI, or Amex Oil Index, against the price of WTI shows that energy stocks are historically cheap against oil. Arguably, the graph doesn't show the true picture as XOI is shown against WTI, which has been trading at a discount to Brent, which is becoming the de facto benchmark for the world price of oil.


We see a similar picture with gold mining stocks. The Amex Gold Bugs Index, or HUI, is trading at a huge relative discount to gold bullion and the relative relationship is approaching the post-Lehman Crisis panic liquidation and capitulation lows.


The slope of the recent price action of the energy stock/oil and gold stock/gold ratio, however, tell the story of controlled selling rather than the panic selling that characterize a capitulation low. That's the same picture that I see in the IBEX 35, the Euro STOXX 50, Treasury bond yields and the EURUSD exchange rate.


A market crash is unlikely
Longer term, however, I expect that asset prices to be well-supported by the Bernanke Put and Draghi Put. Consider the Italian MIB Index as a bellwether of market fortunes. While there is downside risk, tail risk is likely to be mitigated by the Draghi Put and the near-by presence of major technical support that stretch back to the mid 1990's.


As the table below shows, this week is a big week for Spanish equity market, as most of the Spanish banks are expected to report earnings. Bad news could provide a catalyst for another downleg, which would be a set up for the good contrarian to start buying.


In summary, my inner trader tells me that there isn't enough panic here for him to step up to buy, but my inner investor, who has a longer time horizon, tells me that it's time to start nibbling away at long positions in distressed sectors, such as Spain and resource stocks, at current levels.


Cam Hui is a portfolio manager at Qwest Investment Fund Management Ltd. ("Qwest"). This article is prepared by Mr. Hui as an outside business activity. As such, Qwest does not review or approve materials presented herein. The opinions and any recommendations expressed in this blog are those of the author and do not reflect the opinions or recommendations of Qwest.


None of the information or opinions expressed in this blog constitutes a solicitation for the purchase or sale of any security or other instrument. Nothing in this article constitutes investment advice and any recommendations that may be contained herein have not been based upon a consideration of the investment objectives, financial situation or particular needs of any specific recipient. Any purchase or sale activity in any securities or other instrument should be based upon your own analysis and conclusions. Past performance is not indicative of future results. Either Qwest or Mr. Hui may hold or control long or short positions in the securities or instruments mentioned.


Tuesday, March 6, 2012

The energy bull still lives

Ambrose Evans-Pritchard recently wrote an article entitled Plateau Oil meets 125m Chinese cars, in which he discusses why oil prices haven't fallen despite the anemic nature of global economic growth [emphasis added]:
What is deeply troubling is that Brent crude should have reached fresh records in sterling (£79) and euros (€94) - with a knock-on effect on US petrol prices, mostly tracking Brent - even though the International Monetary Fund has sharply downgraded its world growth forecast to 3.25pc this year from 4pc in September, and even though International Energy Agency (IEA) has cut its oil use forecast for this year by 750,000 barrels per day (bpd).

Oil is not supposed to ratchet defiantly upwards in a downturn, which is what we have with the Euro zone facing a year of contraction in 2012, and much of the Latin bloc sliding into full depression. Japan‘s economy shrank in the fourth quarter.
The reason is Peak Oil, or Plateau Oil, where crude supply is not expanding to meet rising global demand because of rising emerging market affluence.
Asia’s emerging powers of Asia - the key force driving the commodity boom of the last decade - are in various stages of “soft-landings” after hitting the monetary brakes last year to check property bubbles and curb inflation. China’s manufacturing has been bouncing along near contraction levels through the winter. So what happens when it recovers?

The unpleasant fact we must all face is that the relentless supply crunch - call it `Peak Oil’ if you want, or `Plateau Oil’ - was briefly disguised during the Great Recession and is already back with a vengeance before the West has fully recovered.
The commodity markets are now selling off over China's new GDP growth of 7.5% as it shifts from export driven growth to internal consumption growth. I would argue that the move is commodity bullish (instead of bearish as interpreted by the market knee-jerk reaction) because resource intensity grows because of the shift to consumption, as shown by this analysis from the Council on Foreign Relations.


Indeed, the emerging market demand story has become so prominent that Big Picture Agriculture points out that Asian oil demand has already risen to exceed North American demand.


Not too late to buy energy stocks
It's such these kinds of positive fundamentals that makes me a long-term commodity and energy bull - and it's not too late to buy energy stocks. The chart below shows the price chart of Select SPDR Energy ETF, or XLE, going back to 2000.
 
 
I have also constructed a crude trading signal for energy stocks. Below the main XLE price chart, I show the relative performance of the more volatile Oil Services ETF (OIH) against the more stable XLE, which is more heavily weighted with integrated oils. Note that troughs in the OIH/XLE ratio have been good times to buy. Investors would have seen higher prices within a year after each of those buy signals. Moreover, if you had waited for the OIH/XLE ratio to rise by 0.25 to 0.30 after each of those buy signals and sold your position, you would have profited handsomely.
 
We just saw a buy signal for energy stocks last year. Based on the OIH/XLE ratio, it's not too late to buy and ride the energy stock bull.


Cam Hui is a portfolio manager at Qwest Investment Fund Management Ltd. ("Qwest"). This article is prepared by Mr. Hui as an outside business activity. As such, Qwest does not review or approve materials presented herein. The opinions and any recommendations expressed in this blog are those of the author and do not reflect the opinions or recommendations of Qwest.
 
None of the information or opinions expressed in this blog constitutes a solicitation for the purchase or sale of any security or other instrument. Nothing in this article constitutes investment advice and any recommendations that may be contained herein have not been based upon a consideration of the investment objectives, financial situation or particular needs of any specific recipient. Any purchase or sale activity in any securities or other instrument should be based upon your own analysis and conclusions. Past performance is not indicative of future results. Either Qwest or Mr. Hui may hold or control long or short positions in the securities or instruments mentioned.

Monday, November 15, 2010

China and oil usage

Back on August 23, 2010, the Center for Geoeconomic Studies showed this chart of crude oil usage intensity of China and other countries in a blog posting:


Their comment was that China is rapidly approaching the $15,000 GDP per capita level when oil consumption intensity starts to rise. Given the vastness of Chinese population, this would mean that global oil demand would take off like a rocket [emphasis added]: "Were China’s per capita oil consumption to be brought up to South Korea’s, its share of global consumption would increase from today’s 10% to over 70%."

By implication, such a development would be incredibly bullish for oil and other energy prices.


Does the new five year plan mitigate demand?
Or does it?

In some ways, China's communist based central planning approach gives us a better picture of her intentions. In a recent interview with Caixin, Liu He, a vice minister of the Office of the Central Leading Group on Financial and Economic Affairs, expounded on the Chinese government's latest five-year plan:


In other words, China's aim in the latest five year plan is to move from low value-added production up to higher value added production, both for domestic consumption and export. Romer calls it growth based on creativity, i.e. more design. Michael Porter would call it moving up the value-chain.

In the past, China's insatiable demand for natural resources has been the result in some silly projects, e.g. inefficient steel plants. This mis-allocation of capital has gobbled up a lot of natural resources such as iron, copper, coal, oil, etc. A transformation of the economy that is more oriented to higher value-added and more creative design oriented output is likely to dampen some of the oil and other raw material intensity nature of the Chinese economy.


Long-term bullish or bearish for energy?
Does this mean that crude oil demand intensity is not poised to skyrocket as per the Center for Geoeconomic Study chart above? On the bullish side, we have seen this same level of rising affluence drive up energy demand in other countries. On the bearish side, the Chinese government seems to be at some level working to restrain energy and other natural resource intensity of their economy. Don't forget the transformation in the American economy in the 1980's, when prolonged oil prices resulted in more efficient use of energy, e.g. smaller cars, etc., and oil demand dropped as a result.

I am still leaning bullish on the case for rising oil demand. However, there are risks to this story and the bearish case shouldn't be ignored.


Addendum: Further to my post, I see that the latest IEA report concludes that oil demand would peak in 2020 if CO2 is cut aggressively (also see story here). While it is unlikely that individual countries would adhere to global accords on CO2 emissions, it does show that efforts to cut consumption, such as fossil fuel subsidy reductions, can have a significant impact on demand.

In the past, what was proposed was transforming the economic growth model. Transforming the economic growth model means increasing efficiency, which involves Paul M. Romer’s New Growth theory, which is to improve total factor productivity and the knowledge content of growth. Transforming the economic growth model is really improving the efficiency of supply.

Sunday, August 23, 2009

No repeat of the Great Depression

There have been a number of analysts like Bob Prechter and Doug Short who believe that the pattern shown by the US stock indices look like a repeat of the 1930s and the Great Depression.

It is difficult for me to make the case that the current conditions make a repeat of the Great Depression inevitable, or even likely. James Hamilton of Econbrowser commented on Short’s analysis this way:

Among the factors that turned the hoped-for recovery of 1930 into the debacle of the Great Depression were a sharp hike in interest rates in October 1931 and a decline in the overall price level of 10% per year in 1931 and 1932. Whatever else happens, I don't expect those particular mistakes to be repeated by the Bernanke Fed.

In addition to Hamilton’s assertions about the Bernanke Fed, I would add a couple of other points that should be encouraging for the bulls.


Protectionist hounds are in the kennel
Countries raising their protectionist drawbridges was one factor that exacerbated the effects of the downturn in the 1930s. This time, it doesn’t seem to be happening. Recently, the Economist reported that global trade seems to have flattened out. Floyd Norris recently wrote in the New York Times that there are even hints of an upturn in global trade.

Countries all around the world seemed to have learned to open markets and free trade lesson this time around. Consider these headlines in the last few months:


What’s interesting about some of these headlines is that free trade is being embraced around the world, which is highly encouraging for the long-term macroeconomic backdrop. The fact that the EU, which has a history of bickering and isn’t known for being friendly to open markets, is negotiating free trade deals around the world is a bit of a surprise to me.


What if peace breaks out?
There are also geopolitical wildcards. What if the US and Iran made peace?

Bruce Bueno de Mesquita, a specialist in game theory at NYU, forecasts precisely such an outcome:

Last year, Bueno de Mesquita decided to forecast whether Iran would build a nuclear bomb. With the help of his undergraduate class at N.Y.U., he researched the primary power brokers inside and outside the country — anyone with a stake in Iran’s nuclear future. Once he had the information he needed, he fed it into his computer model and had an answer in a few minutes…

...Iran won’t make a nuclear bomb. By early 2010, according to the forecast, Iran will be at the brink of developing one, but then it will stop and go no further. If this computer model is right, all the dire portents we’ve seen in recent months — the brutal crackdown on protesters, the dubious confessions, Khamenei’s accusations of American subterfuge — are masking a tectonic shift. The moderates are winning, even if we cannot see that yet.

Should these events come to pass, which are not on any market analyst’s radar screen, oil prices would like fall because of a reduction in the geopolitical premium and equities would rally.


No Armageddon
In conclusion, it is highly unlikely that the world is going to repeat the mistakes of the 1930s. I am concerned, however, that it would make new mistakes.

In the short term, I continue to believe that the market is extremely vulnerable to setbacks. China seems to be the bellwether. The trajectory of the Shanghai Composite seems to indicate that China’s stimulus mini-bubble is bursting and the world is in danger of getting dragged into a double-dip slowdown as China appeared to be the last engine of growth.

If a double dip does occur, investors should keep in mind that it is only a bear market, not Armageddon.

Tuesday, April 14, 2009

For commodity bulls

I began Humble Student of the Markets as a way of putting down my thoughts on the markets, quant funds, investment processes and hedge funds. These are only my thoughts and I have no other agenda. The audience for those topics can be somewhat divergent and topics that interest one group may not be of interest to others.


A weekly newsletter for commodity bulls
Long time readers know that I remain a long-term commodity bull, although I am at odds with a number of gold bugs because gold is not a religion for me. I am experimenting with writing longer pieces on commodity trends on a weekly basis that are really too long to be posted here.

I will be emailing them to a number of contacts that I know and it is free.

If you would like to get on the email list please drop me a line at cam at hbhinvestments.com. I promise that I will keep your email address to myself and won’t give, sell or rent your email away to anyone.

The first post will be entitled An investment for the gold bull daredevil, to be sent out this weekend.