Sunday, November 15, 2015

Profiting from a late cycle market

Trend Model signal summary
Trend Model signal: Neutral
Trading model: Bullish

The Trend Model is an asset allocation model which applies trend following principles based on the inputs of global stock and commodity price. In essence, it seeks to answer the question, "Is the trend in the global economy expansion (bullish) or contraction (bearish)?"

My inner trader uses the trading model component of the Trend Model seeks to answer the question, "Is the trend getting better (bullish) or worse (bearish)?" The history of actual out-of-sample (not backtested) signals of the trading model are shown by the arrows in the chart below.


Update schedule: I generally update Trend Model readings on my blog on weekends and tweet any changes during the week at @humblestudent.


A late-cycle market
Evidence is piling up that we are entering a late cycle market. Note that I am referring to a late market cycle, which may be different from an economic cycle. In this case, however, the market and economic cycles appear to be more or less synchronized. Here is the framework that I use to describe an idealized market cycle (see The bearish verdict from market cycle analysis):
Early cycle: The economy is in recession or on the edge of a recession. In response, the central bank stimulates the economy with low interest rates (or unconventional policy). As a result, stock begin to rise, led by interest sensitive sectors, such as Financial and housing related stocks.

Mid cycle: Some analysts split this part of the cycle into several pieces, but here is roughly how market expectations change. The economy gets better, or is perceived to get better. More jobs are created and consumers have more money to spend. Corporations find that they start to get capacity constrained. They respond by hiring more people, which leads to a virtuous cycle of more consumer spending, and buy more capital equipment. During this part of the market cycle, Consumer Discretionary, capital equipment sensitive sectors like Technology and Industrial stocks lead the market higher.

Late cycle: The economy starts to overheat and inflation starts to tick up. At this point, inflation sensitive commodity related sectors like Energy and Materials start to outperform. The central bank responds to rising inflationary pressures by raising interest rates, which leads to...

Bear phase: The stock market falls because of the expectations of higher interest rates and falling growth. Defensive sectors such as Consumer Staples, Utilities and Healthcare outperform during this phase.
I would also add that in the late part of the expansion, excesses start to appear and sometimes begin to unravel, which is what we are starting to see today. Examples include record levels of Mergers and Acquisitions; wounded and dying unicorns and the growing sense of panic in Silicon Valley (via Luke Kawa), as exemplified by Fidelity`s 25% writedown of its Snapchat stake; and the frothiness seen in the art market.


Negative omens from the credit market
In the past couple of week, I have also been watching with great concern as bearish omens have appeared from the bond and credit markets. First, Tracy Alloway documented a number of uneasy signs highlighting the fragility of the bond market:
  • Negative swap spreads, which is signaling a possible lack of liquidity in Treasury paper.
  • Fractured repo rates, which is also a sign of limited liquidity.
  • Corporate bond inventories below zero, ditto.
  • Synthetic credit is trading tighter than cash credit, which is also a sign that the market is paying for liquidity in the form of tighter spreads.
  • Market moves that aren't supposed to happen keep happening, which can be caused by illiquid markets failing to clear at critical periods.
  • Volatility is itself more volatile.
On top of that, we are seeing signs of other excesses. Corporate leverage is rising, which is a logical response to the ultra-low rates of the last few years (via Business Insider).


The combination of these factors are just indications that the credit markets are fragile. A good analogy might be riding around in a motorcycle at high speeds without a helmet on. Nothing will happen to you unless your crash. In that case, the outcome might not be very pretty.

The motorcycle may be approaching a twisty and bumpy road. Deutsche Bank recently sounded a warning about rising defaults, as yield spreads are starting to blow out (via Business Insider):
With the recent back-up in both IG [investment grade] and HY [high-yield] spreads to their respective 3.5-year wides, a discussion has emerged about whether the market is sensing the next default cycle around the corner or is simply “overreacting” to some exogenous but ultimately irrelevant events. At 570bp ex-energy spreads, the market is well ahead of what would normally be considered sufficient compensation for defaults that are still tracking sub-2% in this segment of our markets.

The Deutsche analysts are worried:
Strategists Oleg Melentyev and Daniel Sorid looked at six leading indicators to judge whether the credit market has over-reacted, and found that two are flashing red - meaning they are "at levels consistent with where previous credit cycles have started."

The two signals flashing red are volatility shocks, and spreads on the highest rated corporate bonds. As the chart at the bottom of this page shows, the Vix and spreads on AA-rated corporate bonds are moving in a similar fashion to the late 90s and the years leading up to the financial crisis.

Two other indicators - financial stocks and monetary policy - are flashing yellow, meaning they have shown some signs of deterioration but are not yet at stressed levels. Two other indicators - volatility in Treasuries and issuer fundamentals - are sending no warning signals.

The message from the credit markets is indeed worrisome. Yield spreads are rising across all credits, from investment grade to high yield. History shows that rising spreads have been a precursor to economic recessions, which are bull market killers. However, this signal has been very early in its recession warning in two out of the last three economic cycles.


No recession on the horizon
Despite these negative signals from the bond and credit markets, I am not ready to hit the panic button yet, as there is no sign of a recession on the horizon. I am grateful to New Deal democrat for his long leading indicator framework, which he adapted from Geoffrey Moore (see his post where he outlines his methodology here). New Deal democrat monitors seven long leading indicators and only one is negative:
My interpretation of current conditions indicate risks are rising but we are in no imminent danger of an economic downturn. Instead, the US economy is entering the late cycle phase of the economic expansion.


Inflation is dead, long live Inflation!
The "normal" way of playing a late cycle expansion is to rotate into the deep cyclical sectors, such as energy and mining. However, I have been seeing charts like this last week (via Jereon Blokland) indicating that commodity prices are hitting new lows, which is undoubtedly giving many investors pause.


Is asset inflation dead, or are commodities a contrarian buy? I believe that this is setting up to be a classic contrarian value play, which can be defined as putting on a position that makes you distinctly uncomfortable. This value investment theme was reinforced by the news that billionaire and deep value investor Seth Klarman had bought a 53 million share stake in Alcoa.

An inflection point for inflation and hard assets may be just around the corner. Goldman Sachs warned that the market is underestimating future inflation (via Bloomberg):
"The market is way too bearish on U.S. inflation in the medium term," meaning between five and 10 years, said Silvia Ardagna, an analyst in London with Goldman Sachs, one of the 22 primary dealers that trade with the Fed.

A rebound in the bond market’s inflation view would signal rising investor confidence in the Fed’s ability to increase interest rates without derailing the economy. Stronger-than-forecast U.S. jobs data on Nov. 6 backed up the case for the central bank to boost its benchmark rate from near zero at its meeting next month.

A turnaround in the inflation measure could happen quickly because the gauge is so low compared with where the bank assesses fair value -- a statistically rare two standard deviations away -- according to Ardagna.

"When an asset class in our space is this misvalued relative to its fair level estimated with our model, usually a reversal tends to be pretty fast," she said.

The 10-year break-even rate hasn’t traded at 2 percent since October 2014, when crude oil was above $90 a barrel, compared with about $42 Thursday. Investors should exit the trade if the break-even closes below 1.4 percent, according to the bank.
Is inflation truly dead? The Atlanta Fed's labor market spider chart shows steady improvement on all dimensions, indicating imminent wage and cost-post pressures.


Benn Steil pointed out that despite the Fed's tightening tilt, global central banks are still adding aggregate liquidity to their balance sheets:


Commodities are becoming a crowded short. Meb Faber recently rhetorically asked Why You Should Ask For Coal (Stocks) In Your Stockings This Holiday Season because of how washed out they are. Bloomberg reported that GLD assets are hitting 2008 levels:


From a chartist's viewpoint, the relative performance of late cycle sectors is becoming more constructive. This 20-year relative performance chart of energy stocks to the SPX show that energy is testing a relative support zone with signs of positive RSI divergence.


I am also seeing a similar pattern of positive divergence on the relative performance of gold stocks as they test relative support.


This chart of the spread of PPI to CPI (blue line) shows that it is at levels where it has historically rebounded. The green line depicts the YoY change in the important industrial commodity complex, copper and copper products, which is poised to rise.


Tom McClellan identified a 10 month cycle in copper prices (ht Jeff Miller), indicating that the red metal may be nearing an inflection point:


McClellan did warn, however, that copper typically bottoms with a capitulation sell-off that we haven't seen yet:
The 10 month cycle in copper price bottoms says that a bottom is due imminently. But we are not yet seeing a big negative reading on the ROC to say that we have seen a washout selloff. When that washout eventually comes, there will likely be some big geopolitical or economic news to justify the selloff, and to help facilitate the washout selling wave. So when you hear that the sky is falling in the copper market, that will be the signal that the bottom is almost at hand.
When I put it all together, these late cycle sectors are getting ready to rocket upwards based on the combination of extreme negative sentiment and the benefit of an unexpected macro tailwind (also see this bullish commodity comment developed independently from Market Anthropology). Should the Fed raise rates in December, analysis from Barclays show that energy, materials and capital goods sectors, along with selected financial stocks that benefit from higher rates, tend to outperform (via Bloomberg):


I expect that late cycle sectors like capital goods and commodity producers should be the surprise winners over the next 6-9 months. Investors should be accumulating positions now, while traders may either wait for oversold extremes or a technical breakout before buying.


The week ahead
Last Sunday, I postulated that stocks would see some consolidation and pullback, which is exactly what we saw in the week (see Global reflation = Buy risk (and cyclicals)). The weakness overshot my targets, however, as I expected initial SPX support at 2055-2060 to hold. Instead, the SPX retreated and tested the first Fibonacci retracement level of 2020. Readings are oversold on RSI5 and the VIX Index, which is now above its upper Bollinger Band.


Breadth measures such as this chart of % of stocks above their 10 dma on IndexIndicators are at levels where stocks have rallied in the past. These oversold conditions suggest that any stock market weakness in reaction to the Paris attacks should be viewed as temporary and a buying opportunity.


On an intermediate term basis, I view the market action last week in the context of a breather in the wake of a Zweig Breadth Thrust, which is a powerful bullish momentum signal that lasts many months (see Bingo! We have a buy signal!).

My inner investor remains bullishly positioned in stocks. My inner trader was averaging in as the market weakened last week. He bought a small position in gold stocks on Tuesday, bought SPX on Thursday and added to his long energy positions on Friday.


Disclosure: Long SPXL, NUGT, ERX

Friday, November 13, 2015

Wednesday, November 11, 2015

How worried should we be about a China slowdown?

The figures coming out of China was mixed. Industrial production is decelerating and missed expectations; fixed asset investment slowed, but was in line with expectations; and retail sales rose and beat expectations. The overall picture is a slowing industrial, export and infrastructure spending and an upbeat household sector.

Tom Orlik summarized it as a good news and bad news story. The good news is the Chinese economy is re-balancing growth towards the consumer, but FAI is slowing and consumer growth isn't rising very quickly to make up for the lost growth (annotations in white are mine):


Here, we see that Old China style growth, powered by credit driven infrastructure spending, is decelerating along a number of dimensions:


I have written about China re-balancing before by highlighting this pair chart of New China-Old China ETF pairs. When the lines are rising, New China consumer led growth stocks are outperforming and, when the lines are falling, Old China credit driven infrastructure growth is ascendant. We have seen the New China stocks begin to outperform in April and they haven't looked back since.


What about the slowdown?
Many investors I have talked to are bewildered by the China bull and bear debate. The bulls will point to evidence of re-balancing as a positive sign for the Chinese growth outlook, as exemplified by Alibaba's Singles' Day sale of USD 14.3 billion, which surpassed last year's sales of USD 9.3 billion. The bears, on the other hand, will contend that, at the end of the day, Chinese growth is still slowing.

To settle the argument, I turned to Mr. Market for his verdict. The chart below shows the relative performance of the stock markets of China's major Asian trading partners, Hong Kong, Taiwan and South Korea, relative to the Chinese market. I used USD denominated ETFs to filter out any currency effects and used FXI as the proxy for China. As the chart indicates, the major Asian market ETFs that trade and export to China are all outperforming FXI. If Mr. Market was indeed worried about a China slowdown affecting her Asian trading partners, then these markets would be underperforming.


If the market doesn't seem to be all that worried a China slowdown, should you?

Sunday, November 8, 2015

Global reflation = Buy risk (and cyclicals)

Trend Model signal summary
Trend Model signal: Neutral
Trading model: Bullish

The Trend Model is an asset allocation model which applies trend following principles based on the inputs of global stock and commodity price. In essence, it seeks to answer the question, "Is the trend in the global economy expansion (bullish) or contraction (bearish)?"

My inner trader uses the trading model component of the Trend Model seeks to answer the question, "Is the trend getting better (bullish) or worse (bearish)?" The history of actual out-of-sample (not backtested) signals of the trading model are shown by the arrows in the chart below.


Update schedule: I generally update Trend Model readings on my blog on weekends and tweet any changes during the week at @humblestudent.


Global reflation
As long time readers are aware, the Trend Model uses commodity and global equity prices to spot market trends. The trading model component of the Trend Model was fortunate to have turned bullish in late September, which coincided with the start of the rally (see my post A choppy bottom). Today, those trends of global reflation are becoming more evident, which is a more definitive signal that the path of least resistance for stocks is up.

Gavyn Davies described the global economy as having dodged the recession bullet:
In this month’s regular report card on global activity growth rates, we conclude that the downward momentum identified by our “nowcasts” a month ago seems to have been arrested during October. The risk of a global recession has therefore declined recently, but growth in the emerging markets remains well below trend, and global spare capacity is continuing to rise.

Furthermore, the growth rate in activity in the US has dropped since mid year, and is now slightly below trend. Other advanced economies, especially the euro area, continue to record reasonably healthy, above trend growth rates, with some signs of a recent acceleration.

Overall, we therefore conclude that the risk of a global hard landing has diminished in the past month. However, while not in recession, the global economy does appear to be in the midst of a growth malaise, in which the “miracle” of the 2000s in the emerging world is unraveling, and productivity growth in the advanced economies has maintained its long term downtrend.
Remember how the market fretted about slowing growth in China and Europe in August? Now those fears can be laid to rest. We can see that from this chart of stock market averages, which show American and European stocks in solid uptrends.


The Greater China markets of China and her Asian trading partners are also in solid recovery modes. The Shanghai market is in an uptrend and all regional markets are above their 50 dma. Late Friday, China reported its FX reserves rose in the month, which alleviated much of the angst over capital flight in China.


The upturn is starting to show up in economic statistics. Ambrose Evans-Pritchard pointed out that global PMIs are rising.


...with improvements in US ISM Manufacturing new orders, with ISM Manufacturing. while weak, beat market expectations:


...an upside surprise in eurozone M-PMI:


...and signs of a bottom in China:


More helpful are signs of the Chinese economy rebalancing towards the household sector as Services PMI is outperforming Manufacturing PMI (via Callum Thomas):


On top of that, we had the blowout US Employment Report, which confirmed a trend of improving fundamentals. The Citigroup Economic Surprise Index, which measures whether high frequency economic releases are missing or beating expectations, is trending up:


On a bottom-up basis, the Street displayed its optimism for the future by raising forward EPS for a second week, according to figures from John Butters of Factset:


A bullish setup for commodities
At a sector level, equities have seen cyclical sectors and groups start to bottom and turn up. The chart below shows the market relative performance of cyclicals, starting with mid-cycle sectors such as industrial and semi-conductor stocks, as well as the globally sensitive Korean market. The bottom two panels show the late cycle commodity cyclical sectors, energy and materials, which appear to be basing but haven't turned up yet on a relative basis.


My bullish call on commodities last week seems to be premature (see How to energize returns even as momentum fades). In retrospect, it could be better characterized as a trade setup rather than an actual trade. Nevertheless, I believe that this bullish setup remains valid. Here is the updated version of the chart I showed last week of the USD (inverted scale, top panel) and the relative performance of energy and materials sectors (US=black, Europe=green).


One technician admonished me about jumping the gun on commodities, "What you have is a setup. Wait for the breakout or some signs of a reversal before committing to the trade."

I was overly eager and I stand corrected. Nevertheless, the weight of the evidence, based on the behavior of cyclical sectors and the confirmation of bottoming formation from Europe, all suggests to me that I am on the right track.

There are two components to the bullish commodity call, a currency element, which is facing headwinds from a strong USD, and a cyclical element, which is more bullish. The upside surprise in Friday`s Employment Teport raised expectations that the Fed would hike rates in December. This caused the USD to rally hard and created significant headwind for commodity prices. However, I believe that the market is giving little weight to the global reflation, which raises commodity demand,

The currency element of the commodity trade can be measured by what happens to inflationary expectations. Inflation is starting to tick up. Business Insider highlighted the fact that the NFP report showed that average hourly earnings rose to 2.5%:


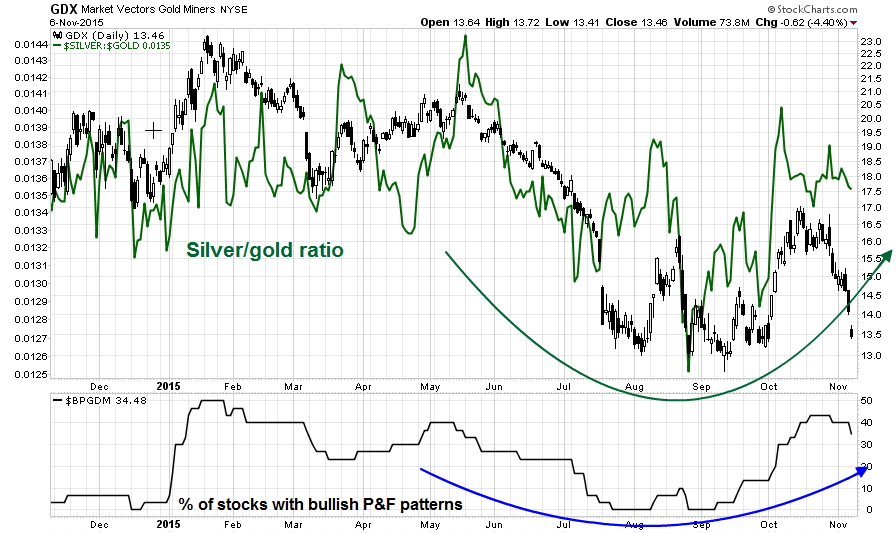
Another measure of inflationary expectations is gold and gold stocks. Gold stocks appear to be setting for a rally as well as breadth is appearing to be constructive. The silver-gold ratio (in green) shows high-beta precious metal silver outperforming gold. As well, the bottom panel showing % of bullish stocks is bottoming and turning up.


One way of measuring the cyclical element of commodity prices is to separate their cyclical factors from their currency influence. The top panel of the chart below shows the highly cyclical industrial metals in USD, which is a chart many analysts look at. while the next two panels focuses on the cyclical element of commodity prices. A conventional analysis of industrial metals show them to have rallied out of a downtrend and in the process of testing support. The middle panel filters out much of the effects of USD strength by showing industrial metal prices in euros, indicating a minor uptrend with a series of higher lows and higher highs (in red) after rallying out of a downtrend. The bottom panel shows lumber prices, which is highly dependent on the cyclical sensitive housing sector, to gold prices, which is mainly perceived as an alternative currency to the USD. The lumber-gold ratio appears to be making a rounded bottom, which is also constructive.


As global growth rises, the cyclical dimension of the commodity trade will start to assert itself. As well, better non-US growth will also serve to push the USD downwards, which will also be commodity bullish. My inner trader is inclined to take a partial position should either energy or material stocks move to the bottom of their market relative trading range and buy a full position on a relative breakout.


The week ahead
Looking to the week ahead,  a period of consolidation and pullback is likely at hand, though any weakness is likely to be shallow and should be bought. Both the SPX and its RSI(14) have breached short-term uptrends. A logical downside support target would be the 2055-2060 area, which is the site of the 200 dma and a gap that likely needs to get filled. However, breadth metrics such as the SPX advance-decline line remains constructive as it made a new high last week.


The dual downside support consisting of the trading gap and 200 dma is graphically even more evident in the chart of the NASDAQ Composite.


I am near-term cautious. Last week's market action dispalyed the signs of an extended market reversing itself from its overbought condition, which is a corrective signal. Quantifiable Edges showed what happened under the unusual condition of when both the VIX Index and stock prices rose, in this case to a 50-day high:


My inner investor remains bullishly positioned, in both the energy sector and in the broad market. My inner trader took profits in long positions in energy stocks last Wednesday and in the SPX Thursday. He is in cash in anticipation of a pullback and lower prices next week and buy hopes to buy into positive seasonality for the remainder of the year.


The week ahead is likely to be volatile, stay tuned for any mid-week updates on Twitter at @humblestudent.

Friday, November 6, 2015

How Muslims will (not) marry our daughters and conquer us with births

I love reading Zero Hedge. Its constant theme of disaster-is-just-around-the-corner is the financial equivalent of skimming the supermarket tabloid at the checkout to see which celebrity was caught with the babysitter. The most amusing headline I saw recently was about the rise of xenophobia in Germany entitled Muslim Man Warns Germans: "We Will Marry Your Daughters And Conquer You With Births":
A week ago, we showed a video of what we hoped was not representative of the general sentiment among Germans towards the refugee crisis as two ladies suggested, "Every year 2-3 million arrive...it’s generally about foreign infiltration." Now we have the other side as the following video shows a muslim man threatening a German that "his daughter will wear a headscarf and marry a Muslim and that Germans stand no chance with their low birth rate," adding that muslims will "conquer Europe not with weapons, but with birth rates."
OH PUH-LEEZ! I hope that readers took that as seriously as the tabloid story about the transsexual who obtained a sex change operation but ultimately became a lesbian.


A demographics lesson
In order to make good on that threat, Muslim newcomers would have to surpass European populations with higher birth rates and overwhelm the hosts culturally. I would suggest that the opposite is much more likely to occur.

Consider, for example, the 2008 UN report indicating that fertility rates have been plummeting in the Middle East.


While the UN report only documented the decline in birthrates, the reason is obvious from an economic perspective. Prosperity and development are the best forms of birth control. In an agrarian or hunter-gatherer society, children quickly become production units and therefore profit centers. In a modern industrialized society, children are cost centers.

Callum Thomas recently highlighted this well-known inverse relationship between income and fertility rates, though the topic of discussion at the time surrounded China`s decision to abolish its one-child policy.


Even though China has abolished its one-child policy and tacitly encouraging two children per family, getting people to have more babies is not as easy as it sounds, according to this NY Times article:
Demographers and economists say the cost and difficulty of child-rearing are likely to deter many eligible couples from having two children despite the relaxed rules, Mu Guangzong, a professor of demography at Peking University, said in a telephone interview.

“I don’t think a lot of parents would act on it, because the economic pressure of raising children is very high in China,” he said. “The birthrate in China is low and its population is aging quickly, so from the policy point of view, it’s a good thing, as it will help combat a shortage of labor force in the future. But many parents simply don’t have the economic conditions to raise more children.”
As I noted before, children become cost centers in industrialized societies and the economic incentives to procreate in the era of birth control are low.

Bottom line: Muslim Europeans are likely to see their birthrates decline and converge to the levels of their hosts.


Cultural assimilation or invasion?
The second question involves the issue of cultural assimilation, or cultural invasion. To answer that question, we can turn to two case studies: China and Iran.

During the 13th Century, the Mongols conquered China and established the Yuan Dynasty to rule China. Over the space of a generation, the Mongol conquerors adopted many of the habits of the locals and became, in many ways, Chinese:
Notwithstanding the aspects of their rule that were certainly negative for China, the Mongols did initiate many policies — especially under the rule of Khubilai Khan — that supported and helped the Chinese economy, as well as social and political life in China.

In order to ingratiate himself with Confucian China, for example, Khubilai restored the rituals at court — the music and dance rituals that were such an integral part of the Confucian ideology. He also founded ancestral temples for his predecessors — his father and Chinggis (Genghis) Khan (his grandfather) — in order to carry out the practices of ancestor worship that were so critical for the Chinese.

And in an even greater effort to ingratiate himself personally to the Chinese, Khubilai insisted on giving his second son, Jin Chin, a Chinese-style education. Confucian scholars tutored the young boy, and he was introduced to the tenets of both Confucianism and Buddhism.

Khubilai also set up institutions to rule China that were very familiar to the Chinese, adapting or borrowing wholesale many of the traditional governmental institutions of China. For example, the Six Ministries that had been responsible for carrying out policy were retained by Khubilai's government, as was the Secretariat, a decision-making body. And the provincial administrative structure that organized China into provinces, further divided into districts and counties and so on, was not changed. The Chinese, therefore, found much of the Yuan Dynasty's political structures to be familiar.
Cultural invasion is not as easy as it sounds - and that occurred in an instance when the invaders militarily conquered the region, which is not the case in Europe today.

For a more modern example, consider the demographics of Iran. As the chart below shows, about one-third of the population was alive when radical students stormed and took over the American embassy in 1980.


It also shows the long-term problem facing Iran`s religious clerics. Young Iranians are becoming secular, which creates problems of control by the ayatollahs, according to this NY Times Op-Ed that compared and contrasted the political landscape between Israel and Iran:
For more than three decades, Iran’s oil wealth has allowed its religious leaders to stay in power. But sanctions have taken a serious economic toll, with devastating effects on the Iranian people. The public, tired of Mr. Ahmadinejad’s bombastic and costly rhetoric, has replaced him with Hassan Rouhani, a pragmatist who has promised to fix the economy and restore relations with the West.

But Mr. Rouhani’s rise is in reality the consequence of a critical cultural and demographic shift in Iran — away from theocracy and confrontation, and toward moderation and pragmatism. Recent tensions between America and Russia have emboldened some of Iran’s radicals, but the government on the whole seems still intent on continuing the nuclear negotiations with the West.

Iran is a land of many paradoxes. The ruling elite is disproportionately made up of aged clerics — all men — while 64 percent of the country’s science and engineering degrees are held by women. In spite of the government’s concentrated efforts to create what some have called gender apartheid in Iran, more and more women are asserting themselves in fields from cinema to publishing to entrepreneurship.

Many prominent intellectuals and artists who three decades ago advocated some form of religious government in Iran are today arguing for popular sovereignty and openly challenging the antiquated arguments of regime stalwarts who claim that concepts of human rights and religious tolerance are Western concoctions and inimical to Islam. More than 60 percent of Iranians are under age 30, and they overwhelmingly believe in individual liberty. It’s no wonder that last month Ayatollah Khamenei told the clerical leadership that what worried him most was a non-Islamic “cultural invasion” of the country.
In other words, Iranian youth prefer to party rather than spend their days in religious devotion. If they are tilting towards western influences and culture, then the more likely outcome of a mass migration of Muslims into Europe is cultural assimilation.

For an example of how cultural assimilation can work, consider the new government of Canadian Prime Minister Justin Trudeau. While this is not a Trudeau endorsement, I would point out that new cabinet ministers include a former refugee from Afghanistan and a turban wearing Sihk who was a soldier with tours in Bosnia and Afghanistan as Minister of Defense.


Now, that`s assimilation!

Bottom line: Europe may experience some temporary indigestion as it copes with the flood of refugees, but the more likely long-term outcome will be "how Muslims will become more secular, affluent and see their birthrates fall."

Tuesday, November 3, 2015

How patient an investor are you?

I received a lot of feedback to my post, How Valeant revealed the dirty little secret of fund management. Some of it was off the mark, as the post was not intended to be a discussion on the merits of Valeant (VRX) as an investment. Instead, it was an illustration of how impatient investors are forcing managers to closet index in order to manage their own business risk.

In the post, I cited an example that showed the simple act of a single wrong decision on one stock has the potential to sink an entire investment management practice - and we had't even begun to discuss the myriad of other ways that risk can rear its ugly head.

It all boils down to the question of how patient investors are with their managers and how much rope they are willing to give their managers to succeed, or fail.


The Value Investor example
Consider, for example, a style of investing that is known to reward patient money - value investing. At Euclidean Technologies, John Alberg and Michael Seckler demonstrated how difficult the value style can be. First, they did a backtest of a simple value discipline:
In this analysis, the value strategy is simply to buy companies that are most inexpensively priced in relation to their prior year’s EBIT (earnings before interest and tax). The top chart plots the simulated performance of this simple approach to value investing in context of the SP500’s total return. The bottom chart shows how much and for how long the value strategy fell behind the SP500 at each point in time.

Across this particular simulation, over the period January 1973 to June of 2014, the value approach achieved a compound annualized return of 17.2% while the SP500’s total return (price change plus dividends) did 10.3%. Sounds amazing!
Here's the catch:
However, as the bottom chart shows, an investor using this value strategy would have had to endure 14-years (1988 through 2001) where he wouldn’t have received much feedback that he was on the right path. Soon after recovering from falling behind the market by 30% from 1988-1991, he would have lagged by nearly 50% across a grueling 6 years.


Managing career risk
How many people can endure 14 years of poor performance, whether it's their own money or with client money?

We can all sit around and nod sagely that investment discipline is important, but what actually happens in the real world? Ben Carlson recently wrote about the difference between academic investment research and real world research:
When new investors are just starting out in the markets they’re often told that a paper portfolio is a good way to test out a strategy without putting real money to work. This one sounds good in theory but is fairly useless in practice.

The thing is that there are no simulations that can prepare you for the emotions you feel when investing actual money in the markets. The feelings you get from making or losing money can’t be simulated. The same is true of those who try to turn research into an investable strategy.
He highlighted a quote from an interview with Cliff Asness of AQR (emphasis added):
Well the single biggest difference between the real world and academia is — this sounds overly scientific — time dilation. I’ll explain what I mean. This is not relativistic time dilation as the only time I move at speeds near light is when there is pizza involved. But to borrow the term, your sense of time does change when you are running real money. Suppose you look at a cumulative return of a strategy with a Sharpe ration of 0.7 and see a three year period with poor performance. It does not phase you one drop. You go: “Oh, look, that happened in 1973, but it came back by 1976, and that’s what a 0.7 Sharpe ratio does.” But living through those periods takes — subjectively, and in wear and tear on your internal organs — many times the actual time it really lasts. If you have a three year period where something doesn’t work, it ages you a decade. You face an immense pressure to change your models, you have bosses and clients who lose faith, and I cannot explain the amount of discipline you need.
Managers face incredible career risk under those circumstances. Even Warren Buffett isn't perfect. CNN Money recently ran a story entitled Warren Buffett's top stocks are dogs this year, which pointed out that Berkshire top holdings (IBM, WFC, USB, GS, KO, AXP, PG, WMT) have all performed poorly this year. Now imagine that your manager is Brand X instead of a well-known name like Warren Buffett, and your Brand X manager followed a Buffet-like discipline. How much patience would you have with that manager after a bad year?

The following example should not be interpreted my "I told you so" victory lap, as I have been badly wrong in my investment career. When I factor in the sheer volume of hate mail that I received from reader when I was bearish on stocks early this year and when I turned more constructive on equities after the August sell-off, many investors are not very patient at all:
Why I am bearish (and what would change my mind) May 2015 (red arrow below)
Relax, have a glass of wine August 2015 (blue arrow below)
Why this is not the start of a bear market September 2015 (purple arrow below)

Key lessons
There are two key takeaways here. For investors, your lack of patience, both at an individual and institutional level, is forcing investment managers to take steps to control their own business risk and become sensitive to benchmark tracking error. If you want to know who to blame for closet indexing, look in the mirror.

Managers also have to recognize that, like it or not, client time horizons are very short. Even for institutions, the typical grace period for poor performance is no more than 2-3 years. In that case, you need to be aware of business risk when sizing your bets in a portfolio.

Notwithstanding the possible solvency problems that come with bad performance should AUM plummet, the way a manager controls business risk also affects the culture of the organization. For example, sales and marketing staff tend not to have the same level of conviction as the investment staff on the investment philosophy. Managed improperly, they can become "order takers" during good times, which is an easy job that practically anyone can do, but abandon the organization during bad times.

Is that the kind of organization that you want?

Sunday, November 1, 2015

How to energize returns even as momentum fades

Trend Model signal summary
Trend Model signal: Neutral
Trading model: Bullish

The Trend Model is an asset allocation model which applies trend following principles based on the inputs of global stock and commodity price. In essence, it seeks to answer the question, "Is the trend in the global economy expansion (bullish) or contraction (bearish)?"

My inner trader uses the trading model component of the Trend Model seeks to answer the question, "Is the trend getting better (bullish) or worse (bearish)?" The history of actual out-of-sample (not backtested) signals of the trading model are shown by the arrows in the chart below.


Update schedule: I generally update Trend Model readings on my blog on weekends and tweet any changes during the week at @humblestudent.


Time to pay off the VISA card?
Three weeks ago, I wrote a provocative post entitled A "What's the credit limit on my VISA card" buy signal, based on the thesis that US equities were experiencing a powerful global momentum thrust off a deeply oversold position. Stocks have rallied nicely since I wrote those words. Last week, I re-affirmed my position of a momentum driven market and postulated further gains (see Momentum = Risk on!).

This week, I am less sure that stock prices can continue to grind upwards. To be sure, the combination of improving fundamentals and positive seasonality all suggests that the next 5-10% move will be positive, but I have no idea what next 1-2% might do. It may be time for a pause.


Improving fundamentals
As we are well into Earnings Season, the latest update from John Butters of Factset was good news for the bull camp. With 67% of SPX components having reported results, the EPS beat rate at 76% is ahead of its 5-year average, though the revenue beat rate came in at a disappointing 47%. More importantly, forward EPS has arrested its decline of the last few weeks and started to tick up again (chart annotations are mine):


In addition, Brian Gilmartin wrote that SPX ex-energy revenues and earnings continuing to grow at a decent, though unspectacular rate:
Using Factset’s Weekly Earnings Insight, Ex-Energy, SP 500 earnings are +5% – 6% for Q3 ’15, probably slightly slower than the first and 2nd quarter’s of 2015.

Ex-Energy, SP 500 revenue has grown +2.2% y/y, with retail or Consumer Discretionary set to report in November ’15. Financials, Technology and Energy have pretty much all reported Q3 ’15 earnings...

Core SP 500 earnings growth Ex-Energy is still growing at a mid-single-digit pace, but slowing somewhat. What is the catalyst that will accelerate SP 500 earnings growth ? Hard to say. I think it will be SP 500 corporate boards and leadership growing more positive about the future. There is no question that SP 500 earnings growth is locked in this “slow, stable, mid to high-single-digit, year-over-year growth” range, quarter-in, quarter out, which despite the headlines and negative earnings pessimism, continues unabated.
I interpret these conditions as being constructive for equities.


A mixed sentiment picture
By contrast, the sentiment picture is a bit mixed. Market sentiment has moved from a crowded short level to a neutral or slightly bullish reading. The CNN Money Fear and Greed Index tells the story. The index is now mildly bullish, though not at extremes. As stock prices and investor sentiment have moved very quickly in a the space of about a month, this could a good time for the market to pause and consolidate its gains.


This historical chart of the Fear and Greed Index in 2011 could serve as a template of what might happen in the next few weeks. Though the market continued to rise into year-end after its initial rally in August 2011, stock prices and sentiment did correct briefly before the market resumed its upward progress.


As well, the latest report of insider activity from Barron's shows that the "smart money" has turned from buying stocks in mid-August to selling. While these numbers are noisy and insiders tend to be early in their timing, it does indicate that stocks do not represent compelling value for the smart money crowd.

On the other hand, other sentiment models indicate that the market could continue to rise from current levels. NAAIM exposure is neutral to slightly bearish, which suggests potential for more buying should a year-end FOMO rally materialize.


Option based sentiment are also supportive of further gains. The CBOE equity-only put/call ratio remains high by historical standards. Such levels of mild bearishness is contrarian bullish, especially after the powerful market rally that we've seen. Simply put, the market continues to climb the proverbial wall of worry:


The ISE equity-only call/put ratio also tells the same story as the CBOE equity-only put/call ratio. ISE statistics only count customer opening transactions, which is a more accurate measure of market sentiment. The chart below shows no signs of euphoria, which is bullish (remember that this is a call/put ratio and therefore the direction of the chart is inverted compared to the above put/call chart):


In the meantime, the Trend Model, which monitors the behavior of global stock and commodity markets, continue to signal recovery. However, the Trend Model is designed to spot the big moves in the market and cannot anticipate every 1% or 2% squiggle.

These conditions presents a dilemma for my inner trader. Should he take partial profits or stay for the bull ride? Trying to resolve that problem is hurting his head. Instead, he is looking for other profit opportunities beyond a simple directional exposure to stocks.


Energizing returns with commodity exposure
Here is another way of thinking about the market. I have written about Jim Paulsen's thesis that commodity prices are due for a bounce back (see past posts The weak USD scenario for equity bulls and How I differ from Jim Paulsen). To briefly recap, USD strength has been a headwind for earnings and the USD is inversely correlated to commodity prices. Jim Paulsen of Wells Capital Management believes that USD strength is due for a pause and commodity prices are likely to see a counter-trend rally:
In three of the last four recoveries (i.e., the late-1970s, 1980s and 1990s recoveries), commodity prices suffered a severe decline “during an ongoing economic recovery. In each of these cases, the economic recovery persisted well beyond the bottom in commodity prices. Indeed, in the past, once commodity prices bottomed, the pace of economic growth accelerated and the recovery did not end until commodity prices had substantially recovered. For example, in the late-1970s recovery, commodity prices bottomed in July 1977 and the recovery did not end until January 1980. Similarly, commodity prices bottomed in July 1986 but the economic recovery continued until July 1990. Finally, commodity prices bottomed in early 1999 but the recovery did not peak until March 2001. As shown, a significant decline in commodity prices usually points to stronger rather than weaker future economic growth. Moreover, once commodity prices do finally bottom, they have typically risen throughout the balance of the economic recovery.

Although most believe oil prices (and overall commodity prices) are continuing to collapse, chart 2 suggest they have been in a bottoming process since early this year. While the spot price of WTI crude oil did collapse last year, it is currently about $45, a level it first reached in mid-January. We suspect the commodity markets are about to embark on a multi-year advance which will likely alter leadership in the economy and in the stock market.
The chart below of the USD (top panel, inverted scale) and the relative performance of energy stocks (middle panel, US=black line, Europe=green line) and materials stocks (bottom panel, US=black line, Europe=green line) tell the story. The USD is range-bound and trading at the top of its range (remember the scale is inverted) while energy and material stocks are forming relative bases and performance is starting to turn upwards.


What I find encouraging about the commodity revival thesis is that the pattern is evident in both the US and European markets. This suggests that the commodity revival story is global in nature, which lends greater support for the case for a tactical rebound in these sectors.


Commodity bull = USD bear
Much of the case for commodity strength rests on USD weakness, as the two have been inversely correlated on a historical basis. Generally speaking, currency movements depend on the following two factors:
  • Relative growth and inflation rates
  • Differentials in monetary policy
Here is the current market consensus on the USD:
  1. The US economy is growing, but China is slowing and Europe is struggling. 
  2. There is no inflation anywhere.
  3. The Federal Reserve is about to raise interest rates while other global central banks are easing.
While the consensus view is supportive of USD strength, I am seeing developments that undermine that the USD bull case. On the issue of relative growth rates, the latest US Q3 GDP came in at 1.5%, which was below market expectations of 1.6%.

China is starting to experience a resurgence of growth, which is also contrary to the market consensus. I already wrote about how China is re-balancing in my last post and not freak out over a disappointment in M-PMI (see More evidence of China re-balancing). My long New (consumer) China and short Old (financial) China pairs trades seem to be signaling better household sector led growth:


As well, Moody's is projecting further price momentum in Chinese property prices, which has been a source of vulnerability for the economy (via Xinhua):
Positive sales momentum for China's property sector, a major pillar for economic growth, will continue in the last quarter of 2015, Moody's Investors Service said Thursday.

Moody's attributed the positive momentum to supportive monetary and regulatory polices implemented since the second half of 2014.
Meanwhile, in Europe, unemployment is plunging and the latest eurozone unemployment figures surprised on the downside (via Business Insider):


Frederik Durcrozet of Pictet also pointed out that stronger eurozone credit flows is foreshadowing a positive investment growth surprise (via Business Insider):


As for the question of the differential in monetary policy, the latest FOMC statement squarely put a December rate hike back on the table and the USD rallied in knee-jerk reaction. But John Williams of the San Francisco Fed seemed to walk back the hawkish tone in the latest round of post-meeting Fedspeak (via ABC News, emphasis added):
John Williams, president of the Fed's San Francisco regional bank, said he wants to study more economic data in coming weeks before deciding whether the economy is strong enough for the Fed to raise its key short-term rate from a record low, where it's been for seven years.

Williams said in an interview with The Associated Press that the Fed chose to mention in its latest policy statement that it could decide on a rate hike at its next meeting to avoid surprising investors in case it did raise rates then.
Is December rate hike a possibility? Definitely. But Williams' comments made the FOMC statement sound more like a CYA comment rather than a definitive commitment that the Fed will raise rates at its December meeting, especially in light of weaker than expected GDP growth and little signs of inflation pressure from the latest core PCE release, which is the Fed's preferred measure of inflation.


The bull case for energy stocks
While energy, materials and emerging market stocks are all correlated to each other, I wrote before that the greater upside potential appears to be in energy stocks because they got more oversold than the others (see The weak USD scenario for equity bulls). I will therefore focus my analysis on the energy sector, though the comments apply to materials and EM as well.

The bull case for oil and energy stocks rests on the following factors;
  • Improving demand-supply fundamentals
  • A washed-out market psychology indicating a crowded short
Recently, I have been seeing more and more analysis come across my desk that the cure for low oil prices is low prices and we are starting to see a supply response as to falling oil prices. The IMF recently issued a report warning of severe strains that the current low oil price environment is putting on Saudi Arabia;s fiscal position. The Saudi needs $106 oil to breakeven on its budget. With prices where they are today, their budget is swimming in a sea of red ink, which has so far been financed by its SWF reserves, but those reserves could be reduced to zero within five years. Such a precarious fiscal position therefore greatly limits their oil production and price policy and therefore highly suggestive of supply cutbacks in the medium term.

In addition, Fatih Birol of the IEA reported that industry capex had cratered by 20% in 2015:
"We expect this year, in 2015, global oil investments to be 20 per cent less than 2014," Birol told a news conference at a G20 Energy Ministers' meeting in Istanbul. This is the biggest decline in oil history," IEA Executive Director Fatih Birol told reporters in Istanbul.

"As a result of this, we expect that next year, US oil production will fall by 400,000 barrels per day because of projects not making economic sense ... We may well seen soon upwards pressure in price," he said.
As EM demand continues to rise and supply cutbacks looming on the horizon, the oil glut is eroded and analysis like this from Barclays is becoming more commonplace (via Sober Look):


In addition, extreme crowded short readings are showing up in energy stocks. Bespoke reports that energy shorts are nearing levels seen in the financial sector at the height of the 2008 financial crisis (via Bloomberg, emphasis added):
Bespoke Investment Group observes that short interest as a percent of shares available for trading, known as the "float," has spiked for the average company in the energy sector, to 11.6 percent as of mid-October:

In mid-2008, short interest as a share of float for the average financial stock peaked at 11.7 percent, a tick higher than the current level for energy equities, according to the report.

But Bespoke noted that short interest in financials was capped through a prohibition by the U.S. securities watchdog on short-selling in response to an outcry from Wall Street executives, chief among them Dick Fuld of Lehman Brothers.
Then there is this oil market commentary from last week, which is also indicative of a crowded short in crude oil (via Marketwatch, emphasis added):
U.S. crude inventories marked a fifth straight weekly increase, but oil prices rallied to their best gain in three months.

That doesn’t make sense at first glance. The degree to which oil rallied has some analysts stumped, but there are good reasons why oil prices are climbing.

Early Wednesday, the U.S. Energy Information Administration reported an increase of 3.4 million barrels in crude supplies for the week ended Oct. 23.

That was well above the increase of 1.6 million barrels forecast by analysts polled by Platts, but analysts surveyed by The Wall Street Journal looked for a bigger 3.7 million-barrel rise and the American Petroleum Institute Tuesday said inventories rose 4.1 million barrels.

“It looks like the majority of shorts got ahead of themselves and were looking for another high single-digit build that didn’t pan out, so they all ran for the door at once to unwind,” said Tyler Richey, co-editor of the 7:00’s Report.
I may be early on the energy and commodity theme, but I believe that downside risk is relatively limited in this trade. We are starting to see signs of better non-US growth, which puts downward pressure on the USD  (bullish for large cap US multi-nationals EPS and commodity prices). Better global growth also leads to a virtuous cycle of higher commodity demand, which is also bullish. Sentiment readings are wash-out and we are seeing a basing pattern in the relative performance of energy and material sectors. In addition, Callum Thomas also highlighted an intriguing potential bullish analog for oil prices based the pattern seen in 1998-99:


While I am not forecasting a revival of the secular commodity bull, current conditions represent a setup for a tradeable rally over the next 3-12 months.


The week ahead
Looking to the week ahead, the SPX has been grinding upwards and flashing a series of "good" overbought readings on RSI(5) and the uptrend continues in RSI(14). There are good reasons the advance can continue. However, market could also pull back and consolidate. In that case, the obvious downside support levels are:
  1. The 200 day moving average, which coincides with a gap that could get filled at 2050-2060; or
  2. Fibonacci retracement levels at 2007 and 1980.


A glance at breadth indicators from IndexIndicators, such as the average RSI(14) of SPX members, is instructive. This indicator, which tends to have a 1-2 week time horizons, show that readings are mildly overbought by 2015 standards but not at the kind of extreme levels seen a year ago. I would not be overly surprised if the market were to pause and correct here, but there are no signs of an intermediate term top.


Despite the near overbought readings shown in a variety of indicators, this chart from TradeFollowers, which measures Twitter sentiment of (mostly) day and swing traders, is suggestive of further near-term gains. As the chart below shows, twitter breadth is trending up and bullish sentiment has spiked to a post-correction high, indicating positive breadth and bullish participation of the mainly high-octane stock universe favored by traders.


The technical pattern for oil prices and its mirror image are even more interesting. Oil has been range bound for the past couple of months. It touched the bottom of their range, started to turn up and is on the verge of a positive MACD signal. On the other hand, the USD Index appeared to get rejected at a resistance zone last week and it`s starting to turn down. Moreover, Marc Chandler suggested that the USD may trade heavier this week ahead of the US Employment Report, which is expected to be weak.


My inner investor remains bullishly positioned, but my inner trader is getting nervous. He is still positioned for the stock market to grind upwards and he is maintaining an open mind as to whether the market is likely to pause its advance, but he is tightening up on his trailing stops as a way of defining his risk parameters. Both are long energy stocks in anticipation of further commodity strength and USD weakness.


Disclosure: Long SPXL, ERX